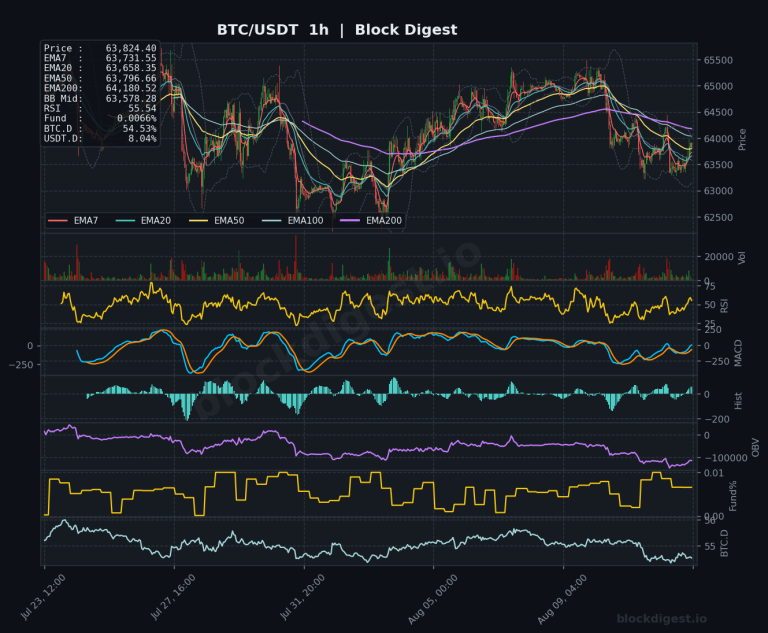
Market Overview
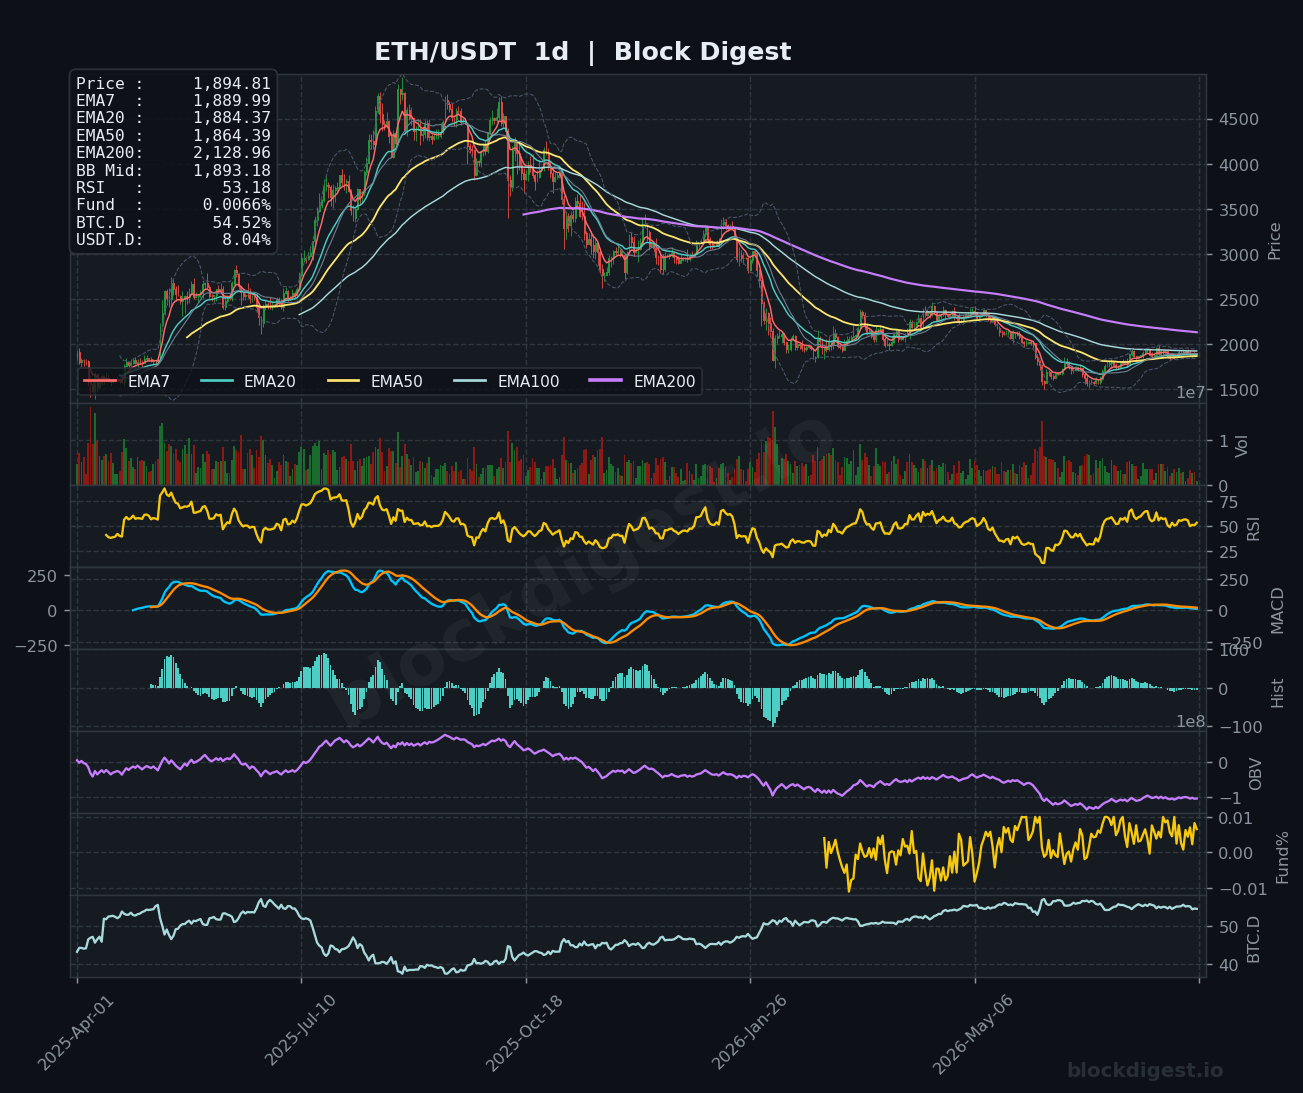
ETH/USDT is currently trading around $1,894–$1,915, holding a delicate position near the Bollinger Band midline on the daily chart at $1,893.18. Price has staged a meaningful recovery from the multi-month lows seen earlier this year, but remains deeply suppressed beneath the daily EMA200 at $2,128.96, which continues to act as a formidable macro ceiling. The short-term EMAs on the daily (EMA7 at $1,889.99, EMA20 at $1,884.37) are coiling tightly beneath current price, suggesting a short-term consolidation phase rather than a clear directional impulse. The broader daily trend structure remains bearish, with price having sustained a prolonged downtrend from the 2025 highs above $4,500.
Multi-Timeframe Confluence
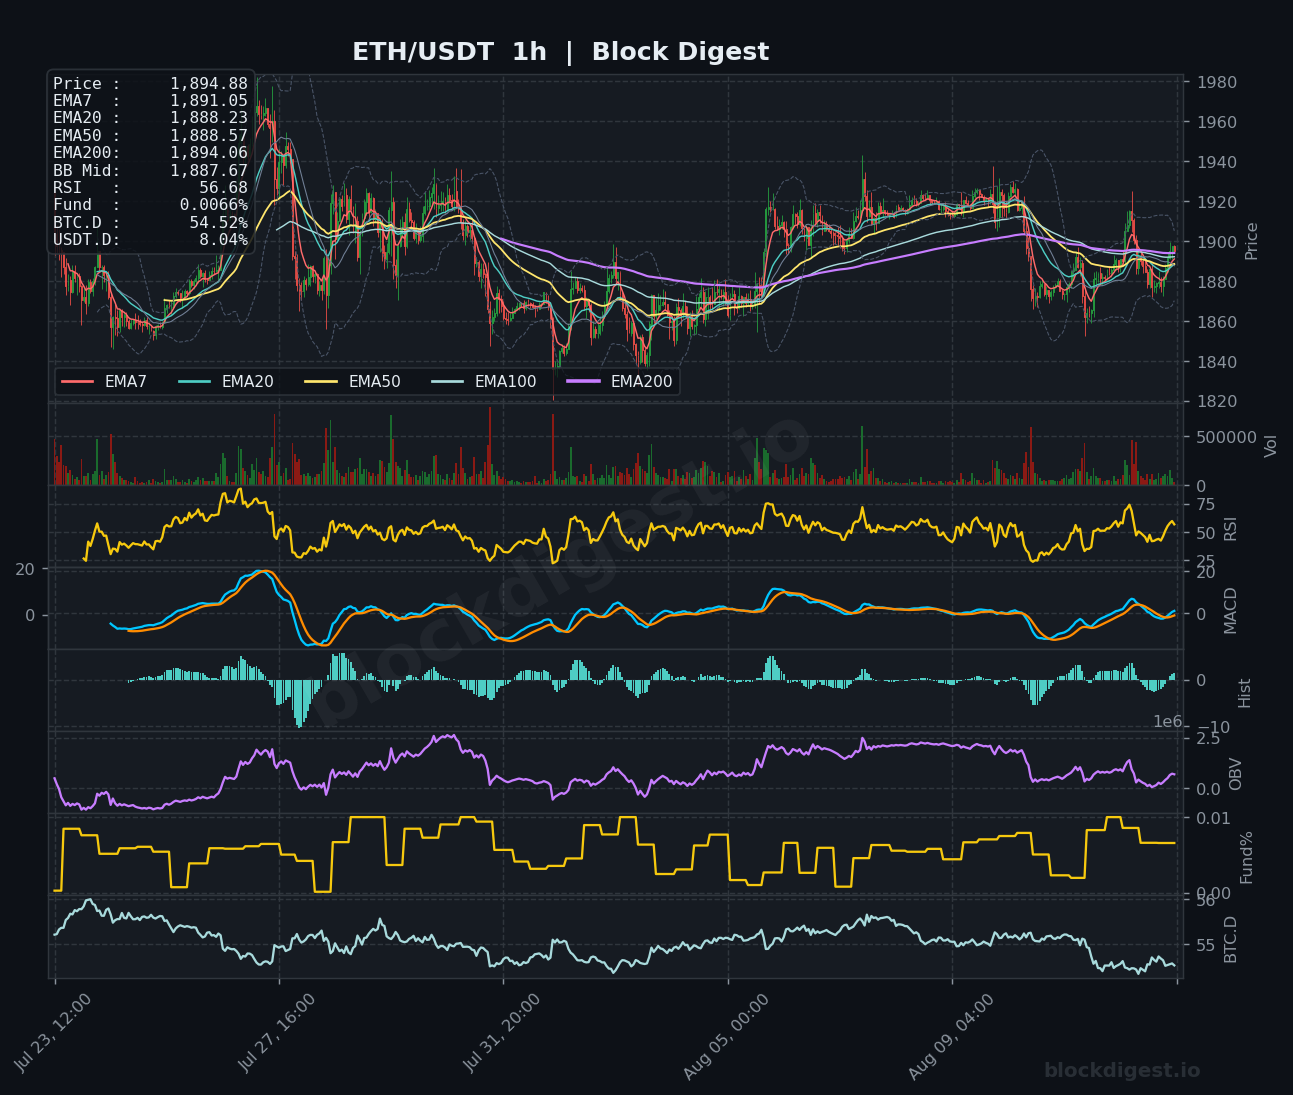
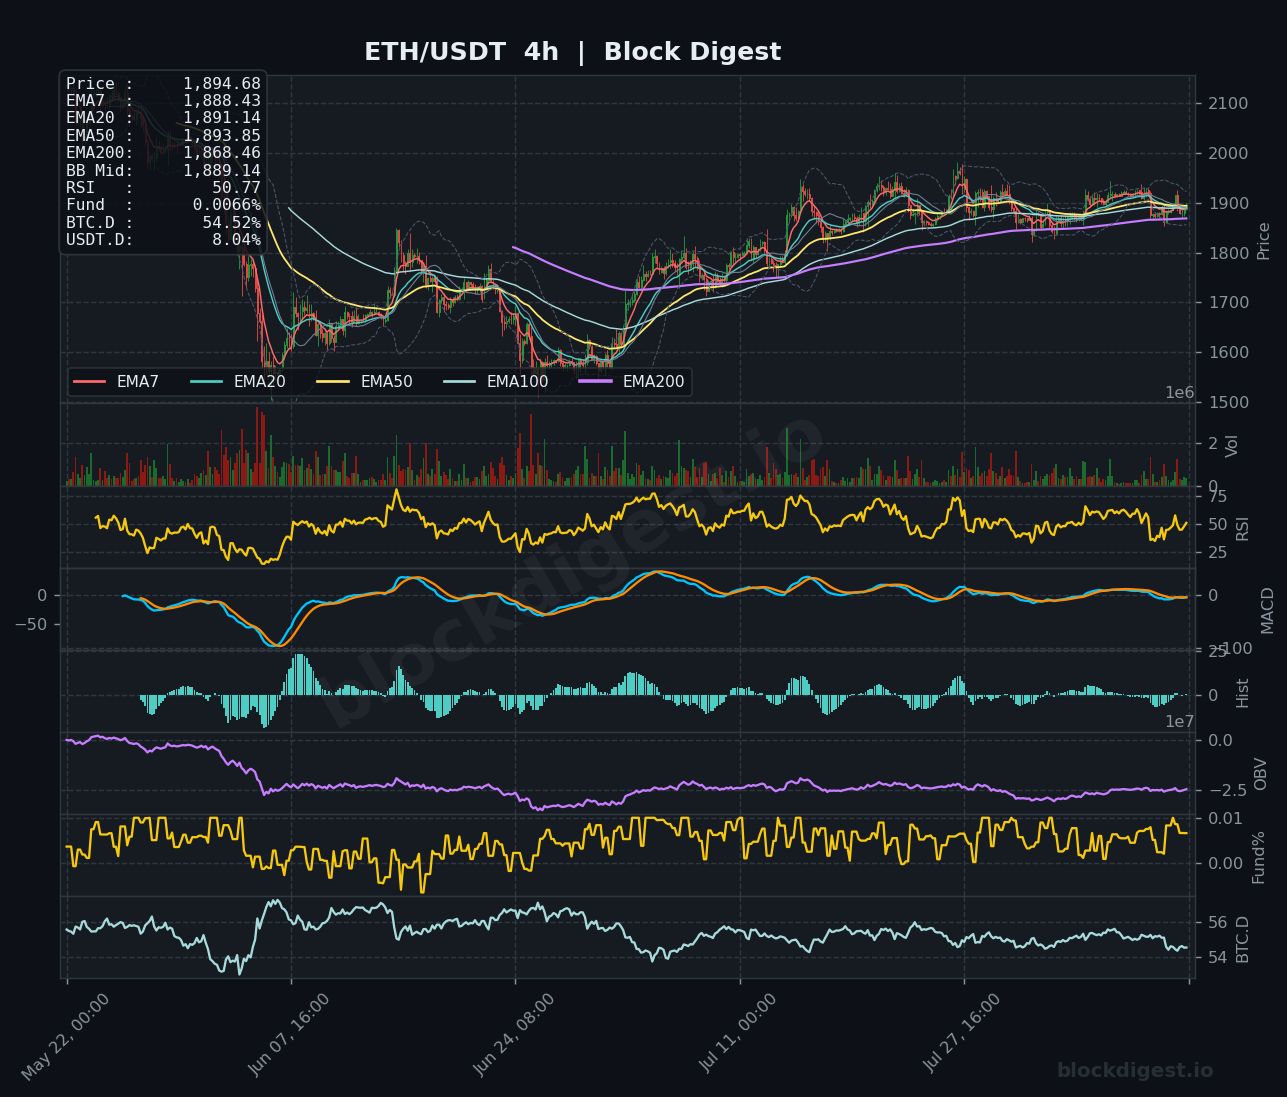
On the 1-hour chart, ETH is trading fractionally above its EMA200 ($1,894.06) with the shorter EMAs (7, 20, 50) tightly clustered between $1,888 and $1,894, pointing to extreme short-term indecision. The 4-hour chart reinforces this neutral read — price sits just above the EMA50 ($1,893.85) and BB midline ($1,889.14) while the RSI at 50.77 hugs the midpoint, offering no directional conviction. Across all three timeframes, the $1,880–$1,895 zone represents a dense EMA cluster where bulls and bears are actively contesting control, and a decisive close outside this range on the 4-hour will likely dictate the next swing of $50–$80 in either direction.
Key Levels to Watch
- Resistance: $1,930–$1,940 — This area capped multiple recent recovery attempts on the 1-hour and 4-hour charts and aligns with the upper Bollinger Band on the 4-hour timeframe.
- Resistance: $1,980–$2,000 — A psychological round number and prior consolidation zone; a reclaim here would shift near-term structure meaningfully bullish.
- Resistance: $2,128.96 — The daily EMA200, representing the dominant macro resistance and the dividing line between a recovery narrative and a confirmed bearish regime.
- Support: $1,880–$1,884 — Confluence of the daily EMA20 and 4-hour EMA20; loss of this level on a closing basis would signal near-term weakness.
- Support: $1,864 — The daily EMA50; a breakdown here would put the broader consolidation thesis under serious pressure.
- Support: $1,840–$1,850 — A demand zone established during the recent bottoming process and a key line in the sand for bulls on the daily chart.
Momentum & On-Chain Signals
The RSI picture across timeframes tells a consistent story of mid-range limbo: 56.68 on the 1-hour, 50.77 on the 4-hour, and 53.18 on the daily — all hovering near the 50 threshold with no momentum extreme in either direction. Our BD Pulse Score of 32/100 underscores this bearish undercurrent — despite the price recovery from lows, underlying momentum has not convincingly turned. The MACD on the 4-hour shows both lines converging near zero with a flattening histogram, consistent with a market searching for a catalyst rather than trending. The OBV on the 4-hour remains depressed at lower levels relative to earlier peaks, confirming that the recent price bounce has not been accompanied by strong volume accumulation — a distribution signal that warrants caution.
BTC Dominance & Market Sentiment
BTC dominance sits at 54.52%–54.53% across timeframes, remaining at elevated levels that historically correlate with capital staying parked in Bitcoin rather than rotating into altcoins like ETH. USDT dominance at 8.04% reflects meaningful sidelined capital that has yet to re-enter risk markets, suggesting broader sentiment remains cautious. For ETH specifically, this environment is unfavorable for outperformance — a meaningful drop in BTC.D would be a prerequisite for ETH to mount a sustained rally above the $1,940 resistance cluster.
Risk Scenarios
- Bullish case: A decisive 4-hour close above $1,940, accompanied by a pickup in volume and OBV inflection, would open the path toward the $1,980–$2,000 psychological zone. A softer-than-expected U.S. economic print reducing Fed rate-hike fears could serve as the macro catalyst to trigger this breakout.
- Bearish case: Failure to hold the $1,880–$1,884 EMA cluster on a daily closing basis would expose the $1,864 EMA50 and subsequently the $1,840 support zone. A hawkish Fed pivot or renewed dollar strength would amplify downside pressure on ETH given its risk-asset profile.
Outlook
ETH presents a cautious, range-bound setup heading into the next 24–48 hours, with the tight EMA cluster between $1,864 and $1,895 functioning as the fulcrum for near-term price action. The BD Pulse Score of 32/100 aligns with the technical picture — this is not a market offering high-conviction setups in either direction, and patience is warranted. Key triggers to monitor include U.S. macroeconomic data releases that could shift Fed rate expectations, as well as BTC’s ability to hold above its own key support levels given ETH’s strong correlation. A sustained move above $1,940 or below $1,864 on meaningful volume would be the clearest signal to reassess the current neutral thesis.
Disclaimer: This analysis is for informational purposes only and does not constitute financial advice. Cryptocurrency markets are highly volatile and unpredictable. All trading decisions should be made based on your own research and risk tolerance. Block Digest is not responsible for any financial losses incurred as a result of acting on this content.
Stay Ahead of the Market
Follow BlockDigest for crypto market intelligence, research and real-time updates.