
Market Context
Bitcoin dominance sits at 56.77% as of June 26, 2026, reflecting a market environment where capital continues to gravitate toward BTC at the expense of altcoins. USDT dominance at 8.68% signals a meaningful stablecoin allocation that has yet to rotate back into risk assets, suggesting cautious sentiment rather than active accumulation. The broader altcoin complex remains under structural selling pressure across multiple timeframes, with most major alts trading well below their key daily moving averages.
Solana (SOL)
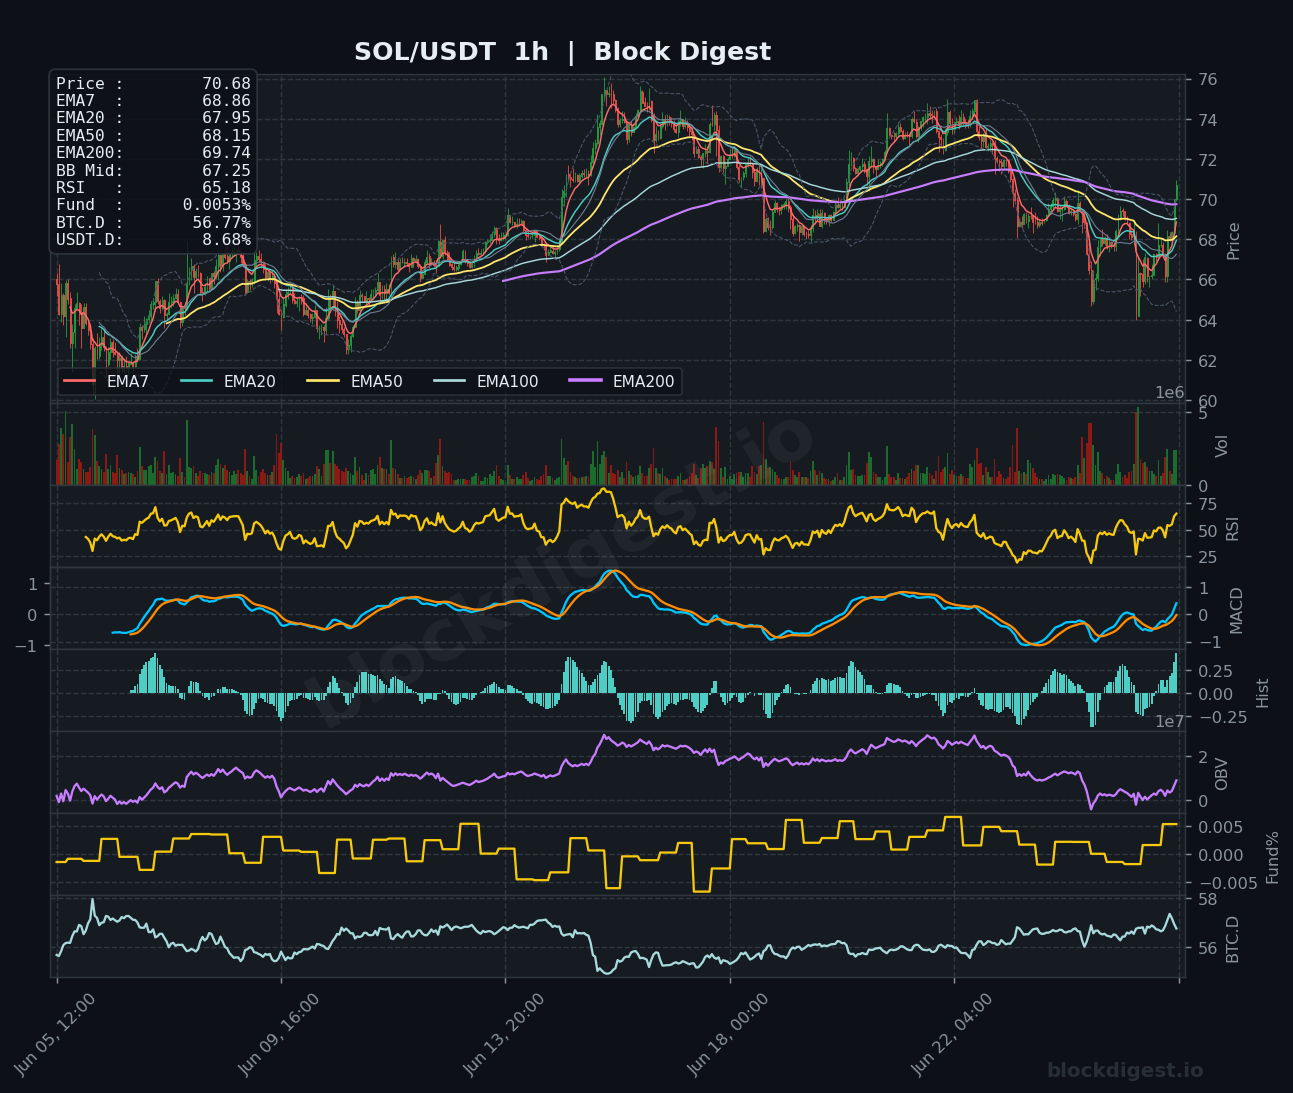
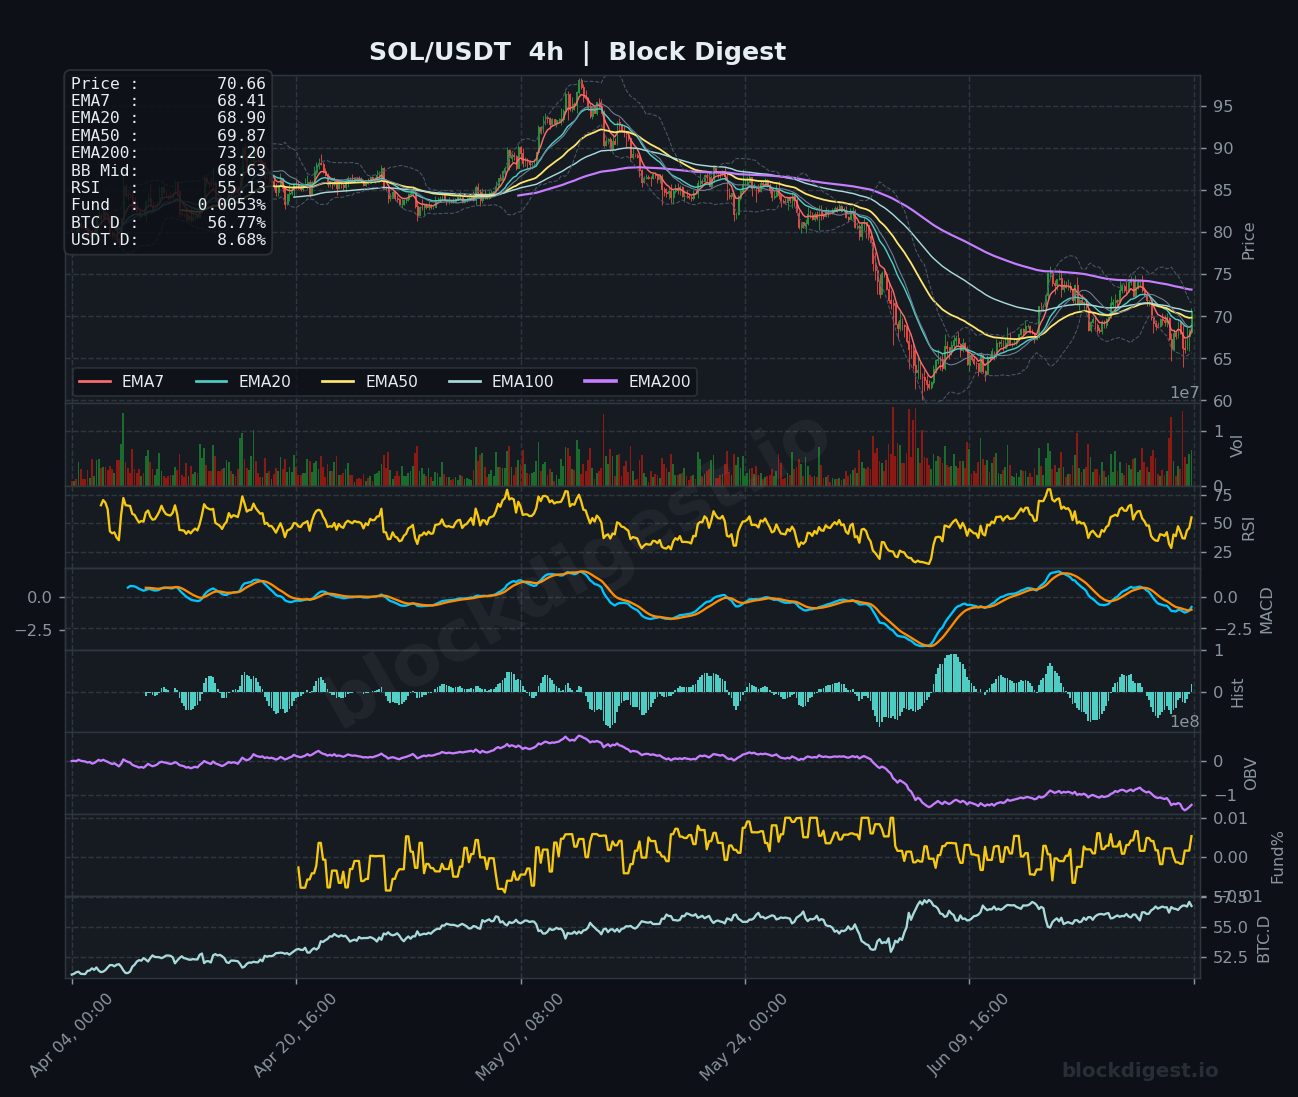
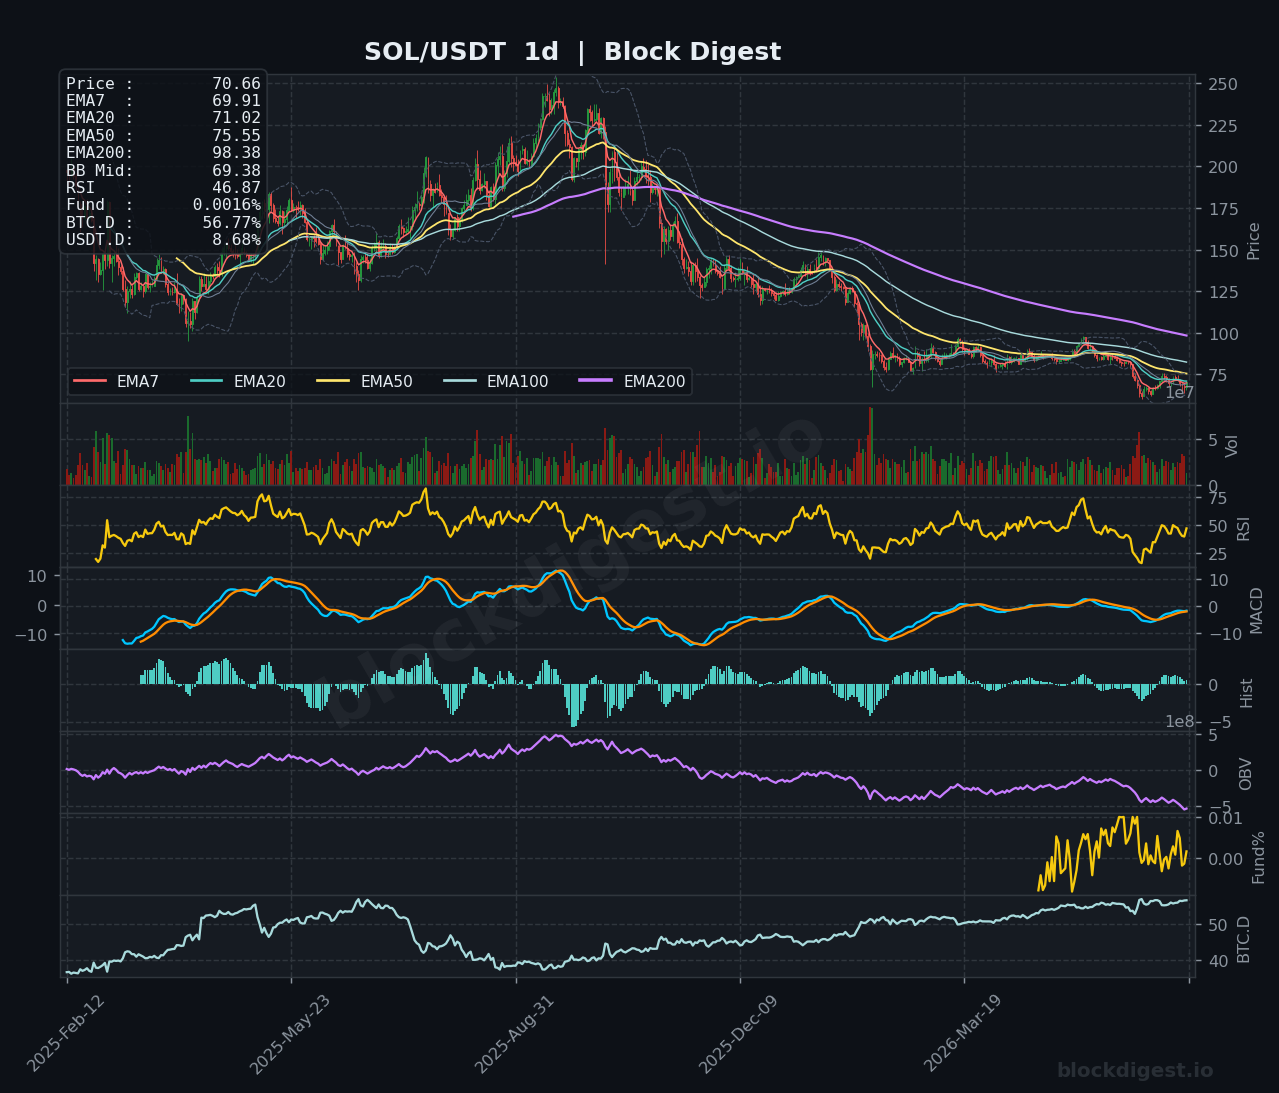
SOL is trading at $70.66, staging a modest short-term recovery after a sharp drop that tested the $64–$65 support zone on the 1h and 4h charts. On the 1h, price has reclaimed the EMA7 ($68.86) and EMA50 ($68.15), with RSI at 65.18 showing recovering momentum, though MACD remains near zero with a cautiously bullish histogram. The 4h chart paints a more sobering picture: all short-term EMAs (7/20/50) sit between $68 and $70 while the EMA200 at $73.20 acts as overhead resistance, with 4h RSI at 55.13 and MACD attempting a weak bullish cross. On the daily, SOL is firmly below all major EMAs — including the EMA50 at $75.55 and EMA200 at $98.38 — with RSI at 46.87 and declining OBV confirming sustained distribution; the short-term bias is cautiously neutral with a bearish lean on higher timeframes.
XRP (XRP)
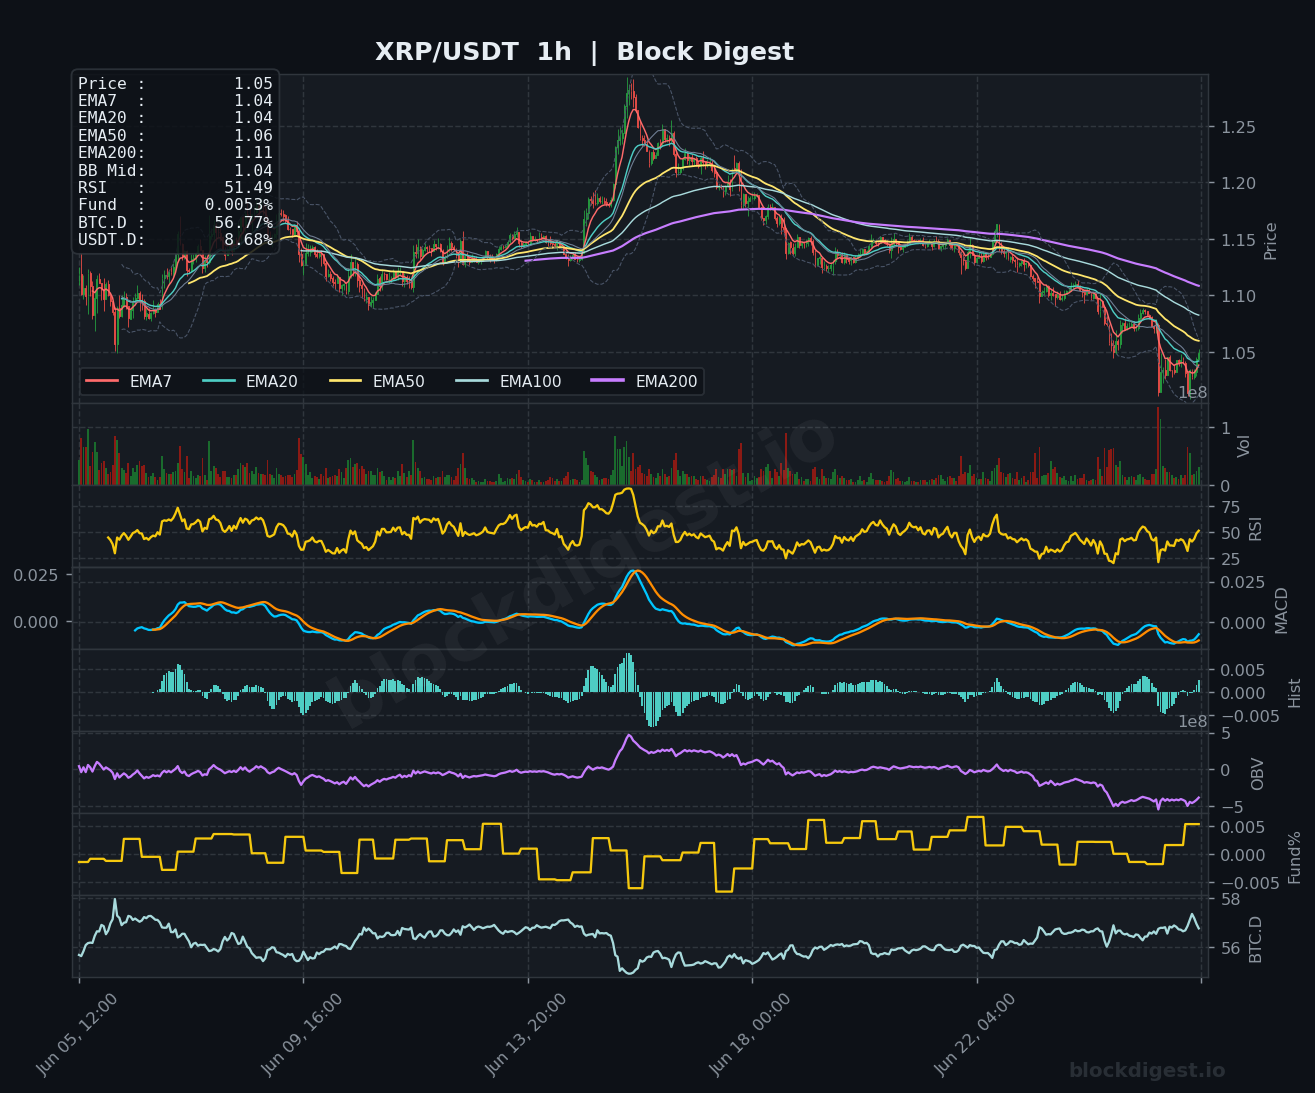
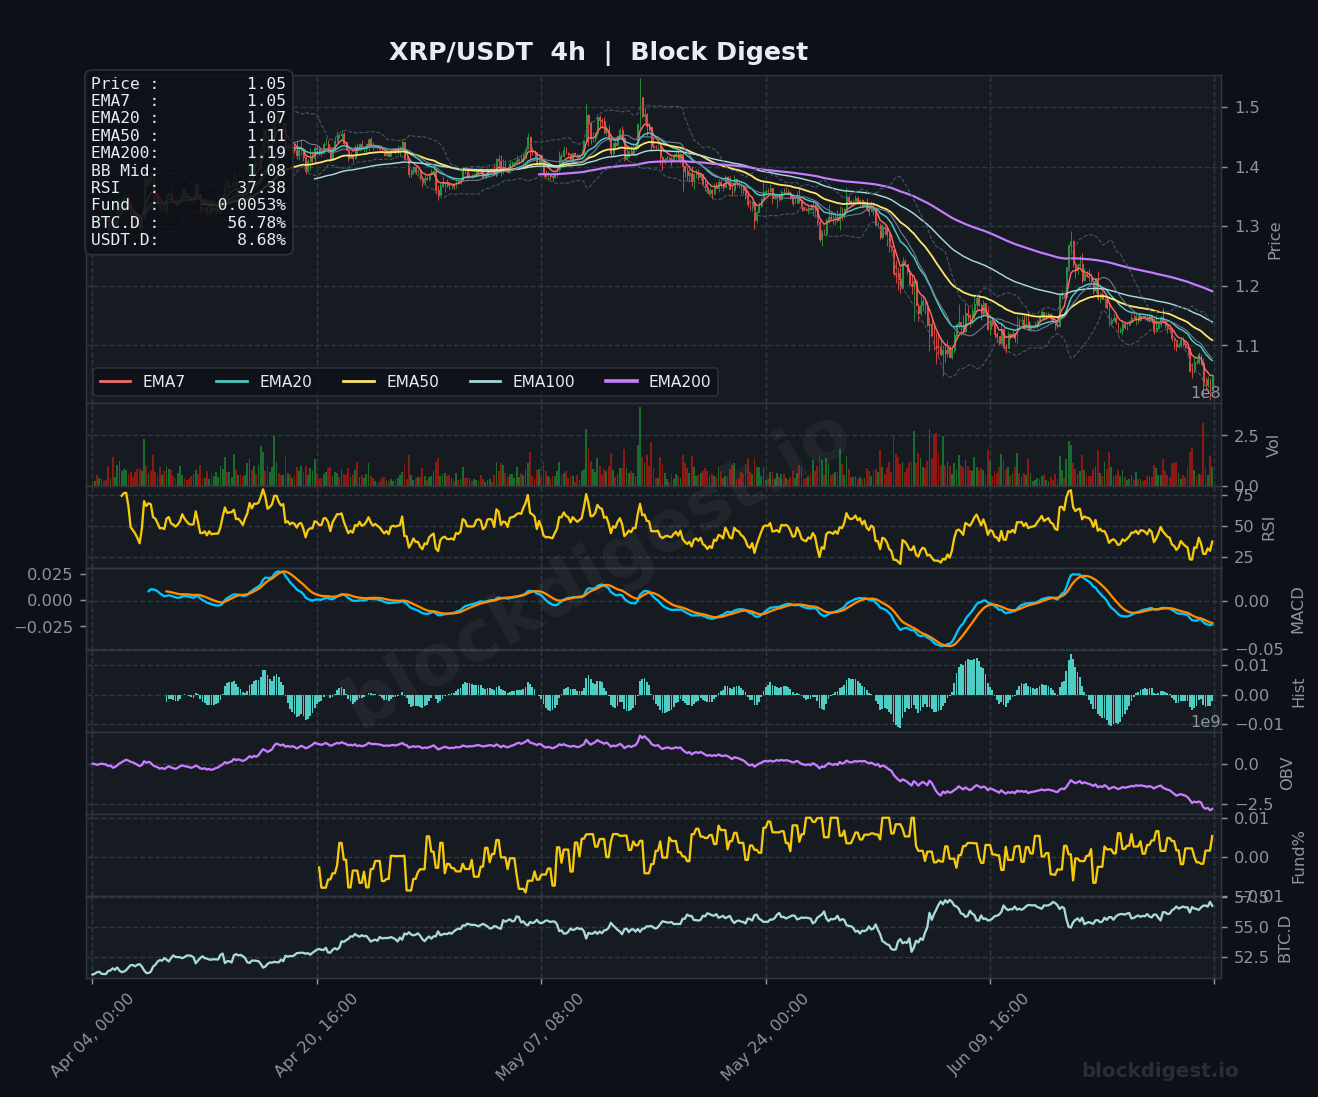
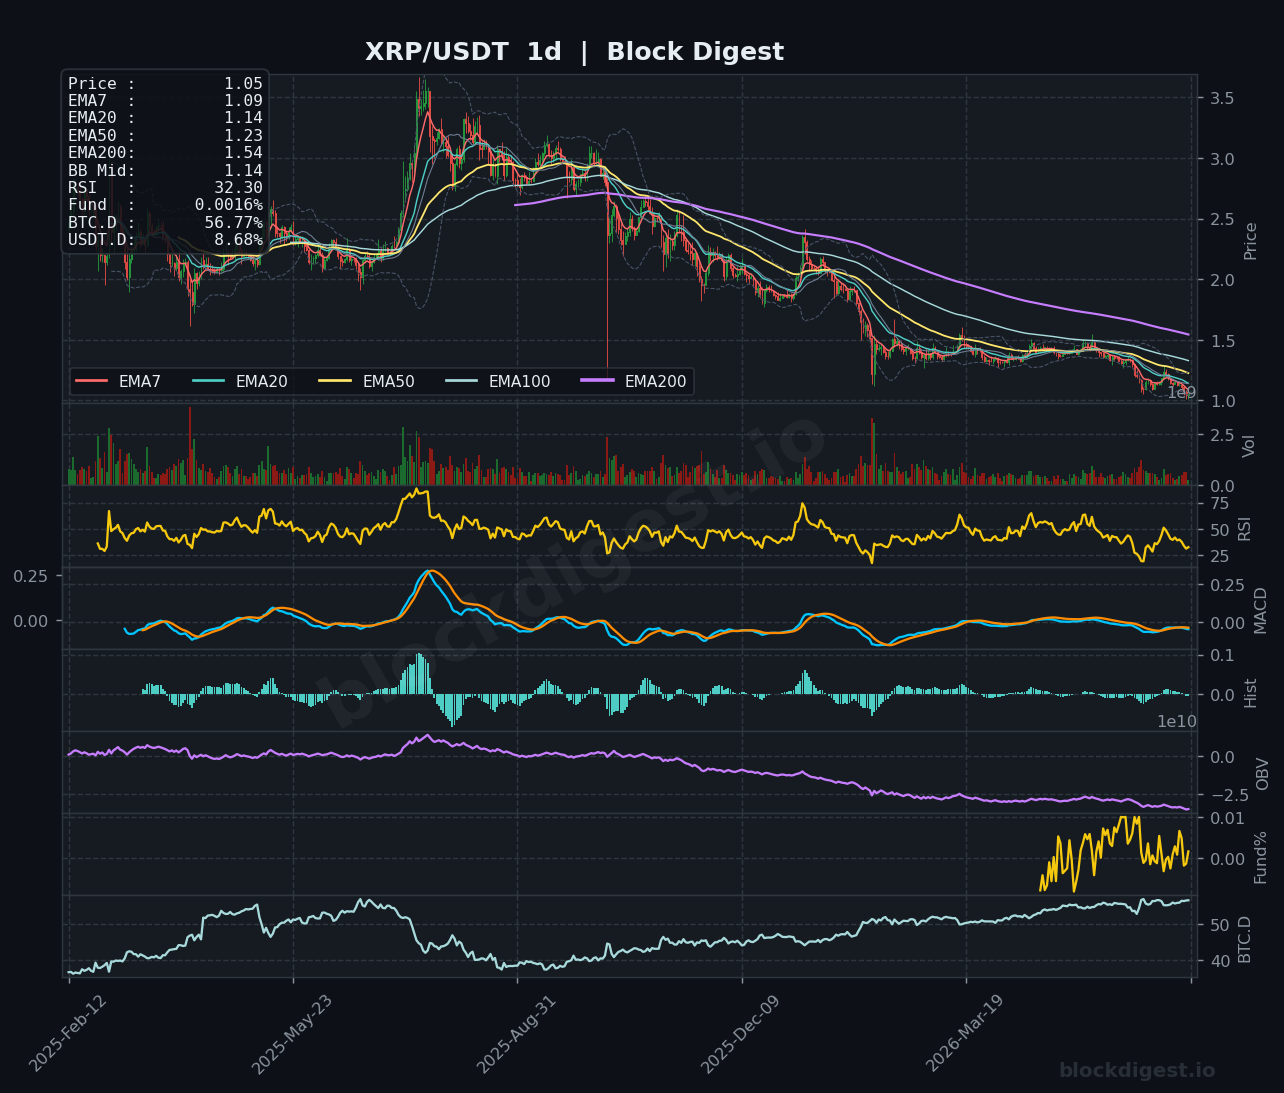
XRP is trading at $1.05, sitting at a critical support level after a prolonged downtrend from peaks near $1.27 seen on the 1h chart. The 4h RSI has dropped to 37.38 and is approaching oversold territory, while MACD remains in bearish territory though flattening slightly — a potential signal that selling momentum may be exhausting. On the daily chart, RSI has deteriorated to 32.30, just above the oversold threshold, and the price is now below all EMAs including EMA7 ($1.09) and EMA20 ($1.14), with OBV in a sustained decline that reflects persistent net outflows. Immediate resistance sits at the $1.07–$1.09 zone (EMA7/EMA20 on the daily), and unless XRP reclaims $1.10 with conviction, the short-term bias remains bearish with oversold conditions warranting caution for aggressive shorts.
BNB (BNB)
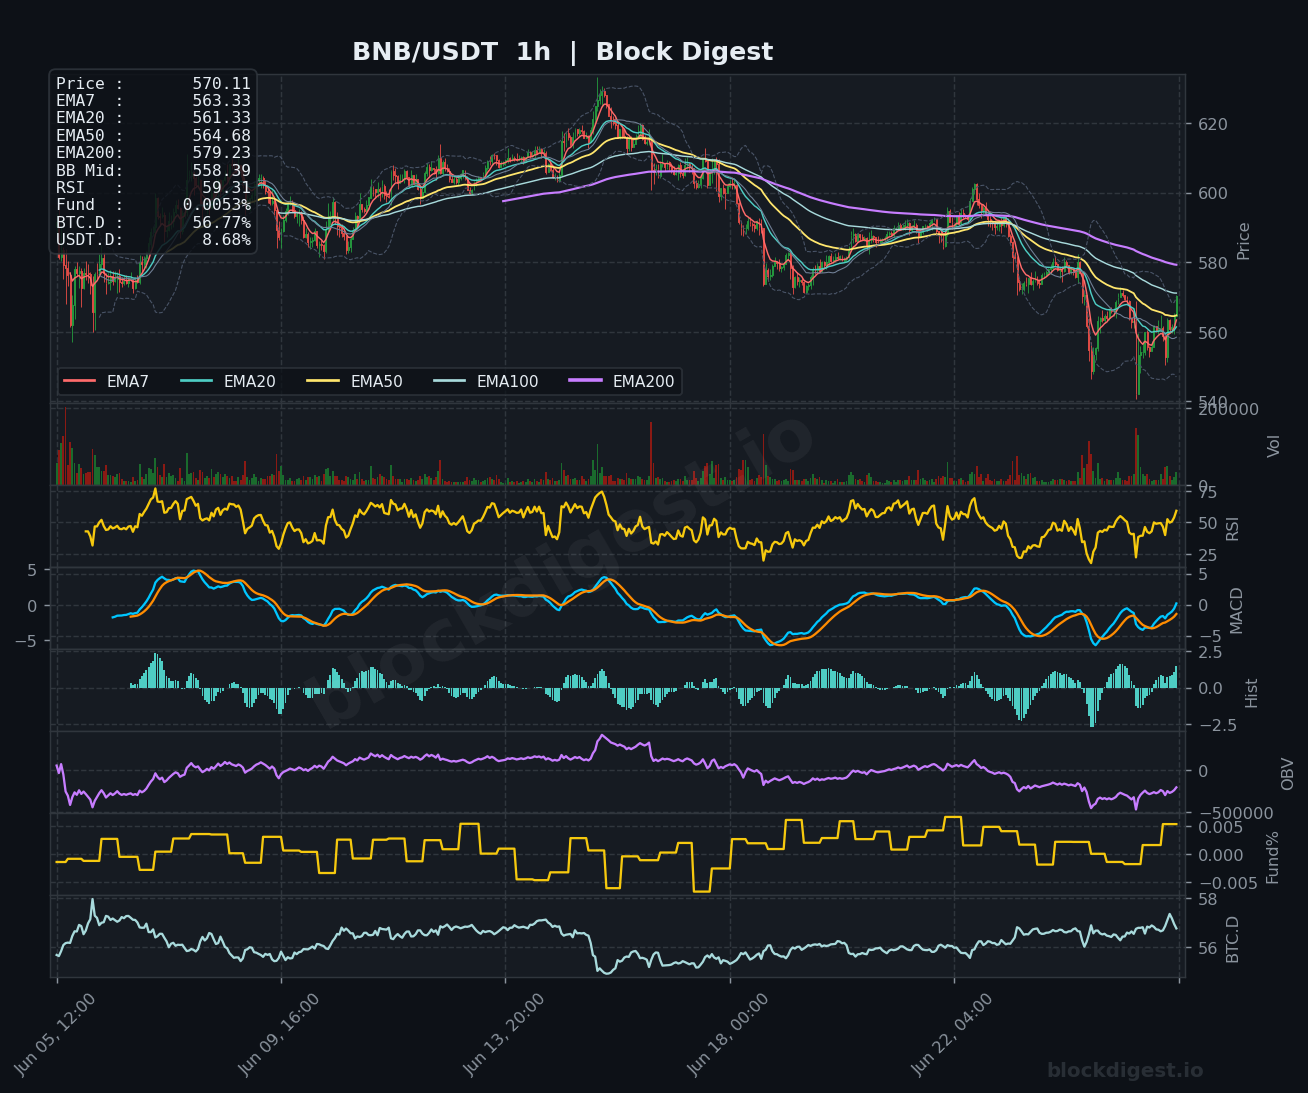
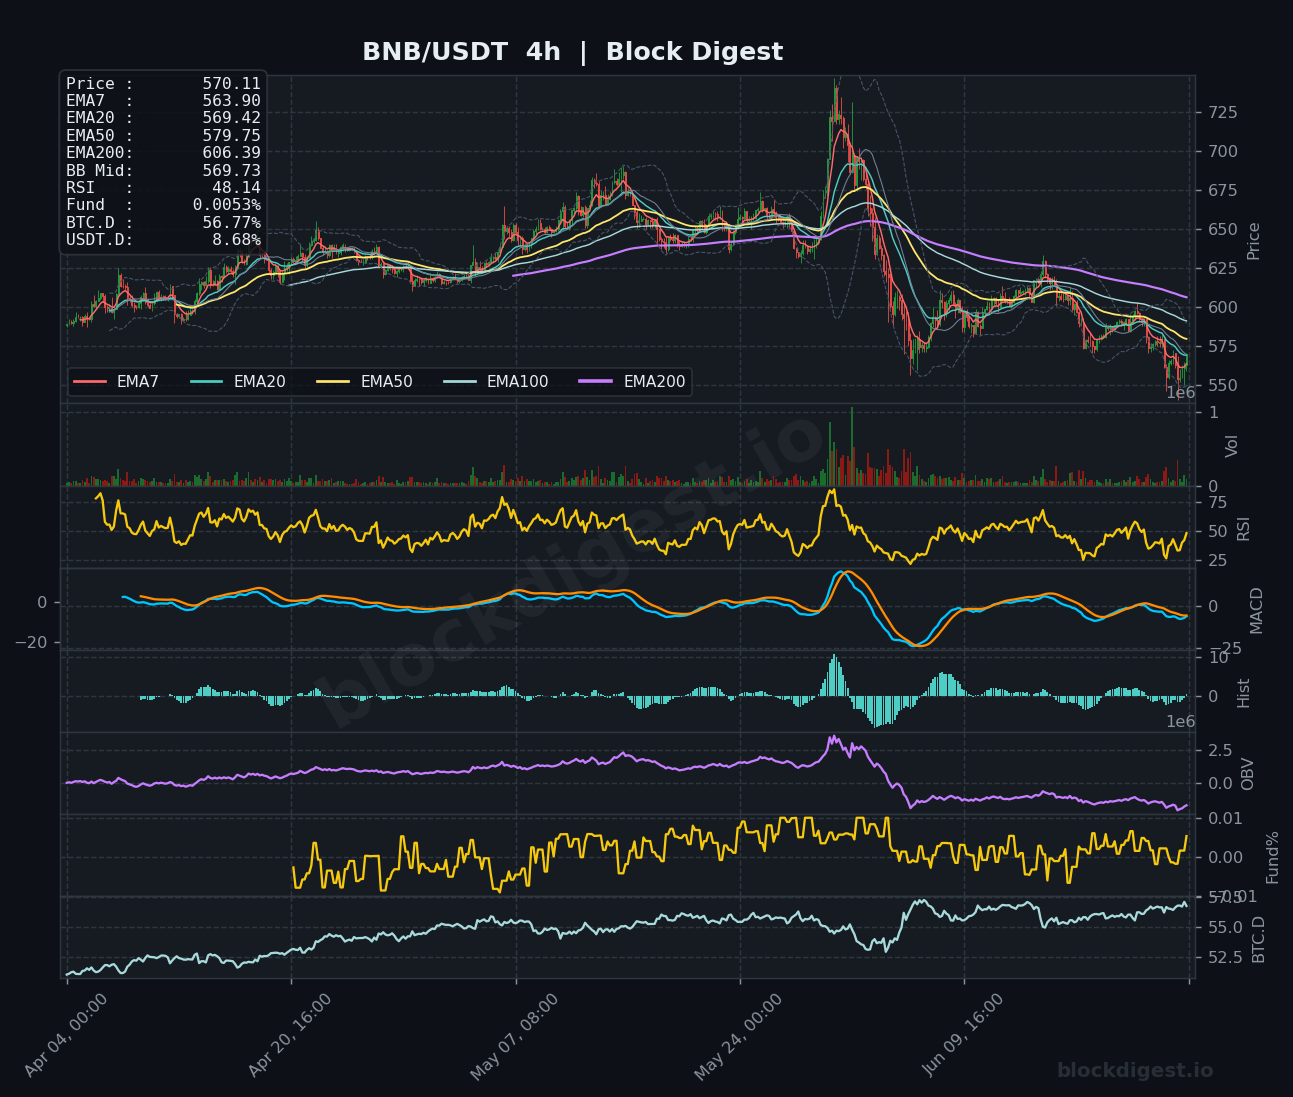
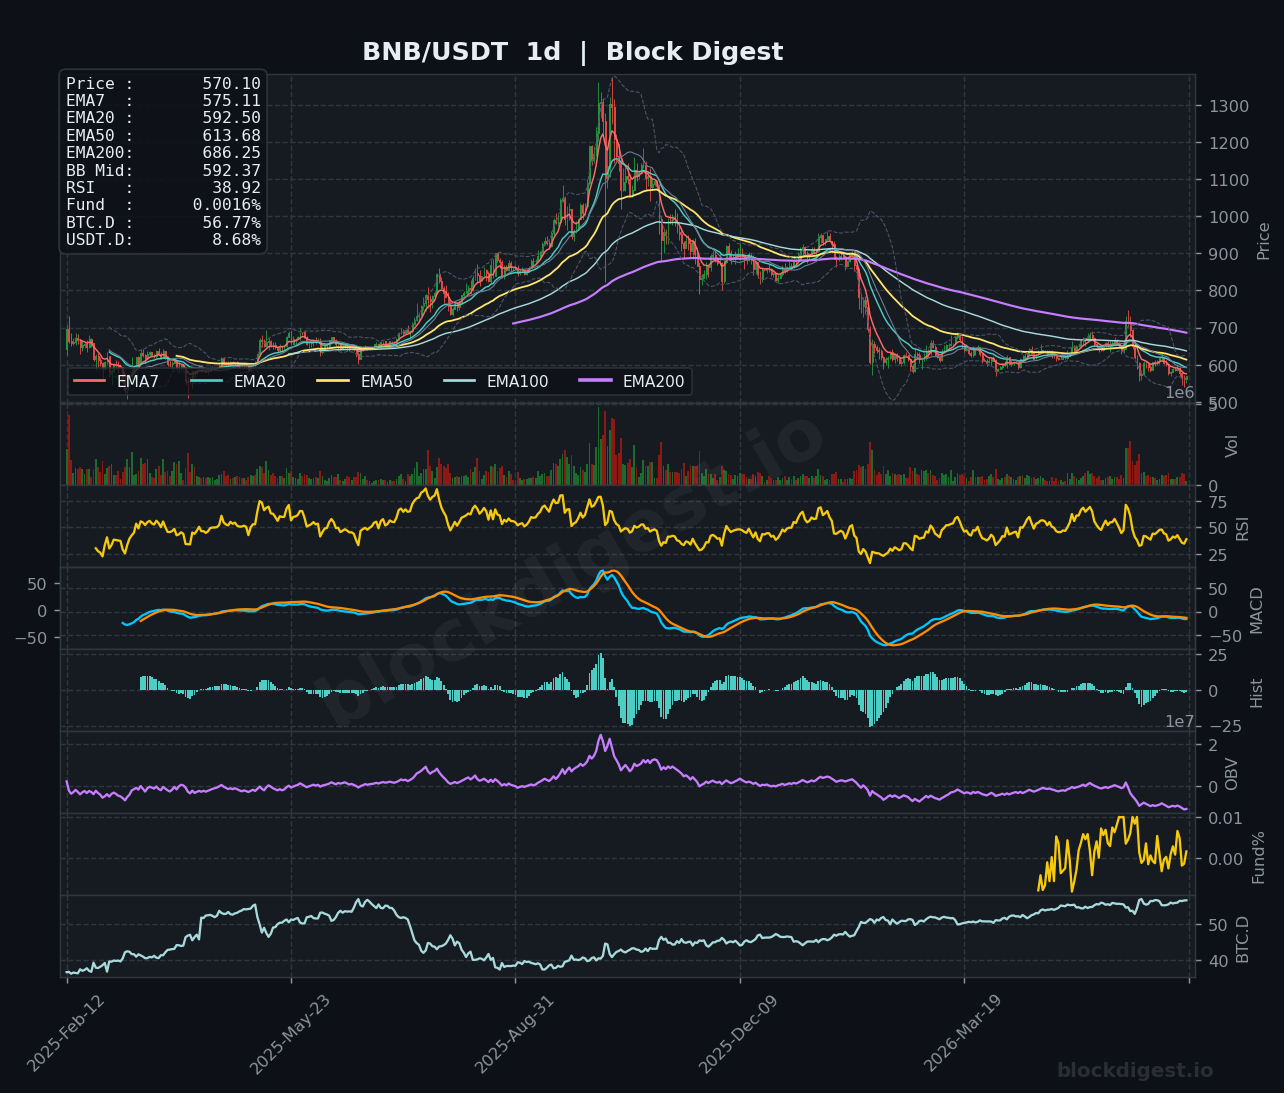
BNB is currently trading at $570.11, recovering modestly from recent lows near $545–$550 seen on the 1h chart, with price now above the EMA7 ($563.33) and EMA20 ($561.33) on the shorter timeframe. The 1h RSI at 59.31 and a bullish MACD cross suggest near-term momentum is positive, though the EMA200 on the 1h at $579.23 represents immediate overhead resistance. On the 4h chart, RSI sits at 48.14 with MACD still in negative territory but curling upward, and price is struggling to sustain above the $569–$570 BB midline ($569.73). The daily chart shows BNB trading well below its EMA20 ($592.50), EMA50 ($613.68), and EMA200 ($686.25), with daily RSI at 38.92 and declining OBV; the bias is neutral to bearish on higher timeframes, with any recovery likely capped at the $590–$595 zone.
Dogecoin (DOGE)
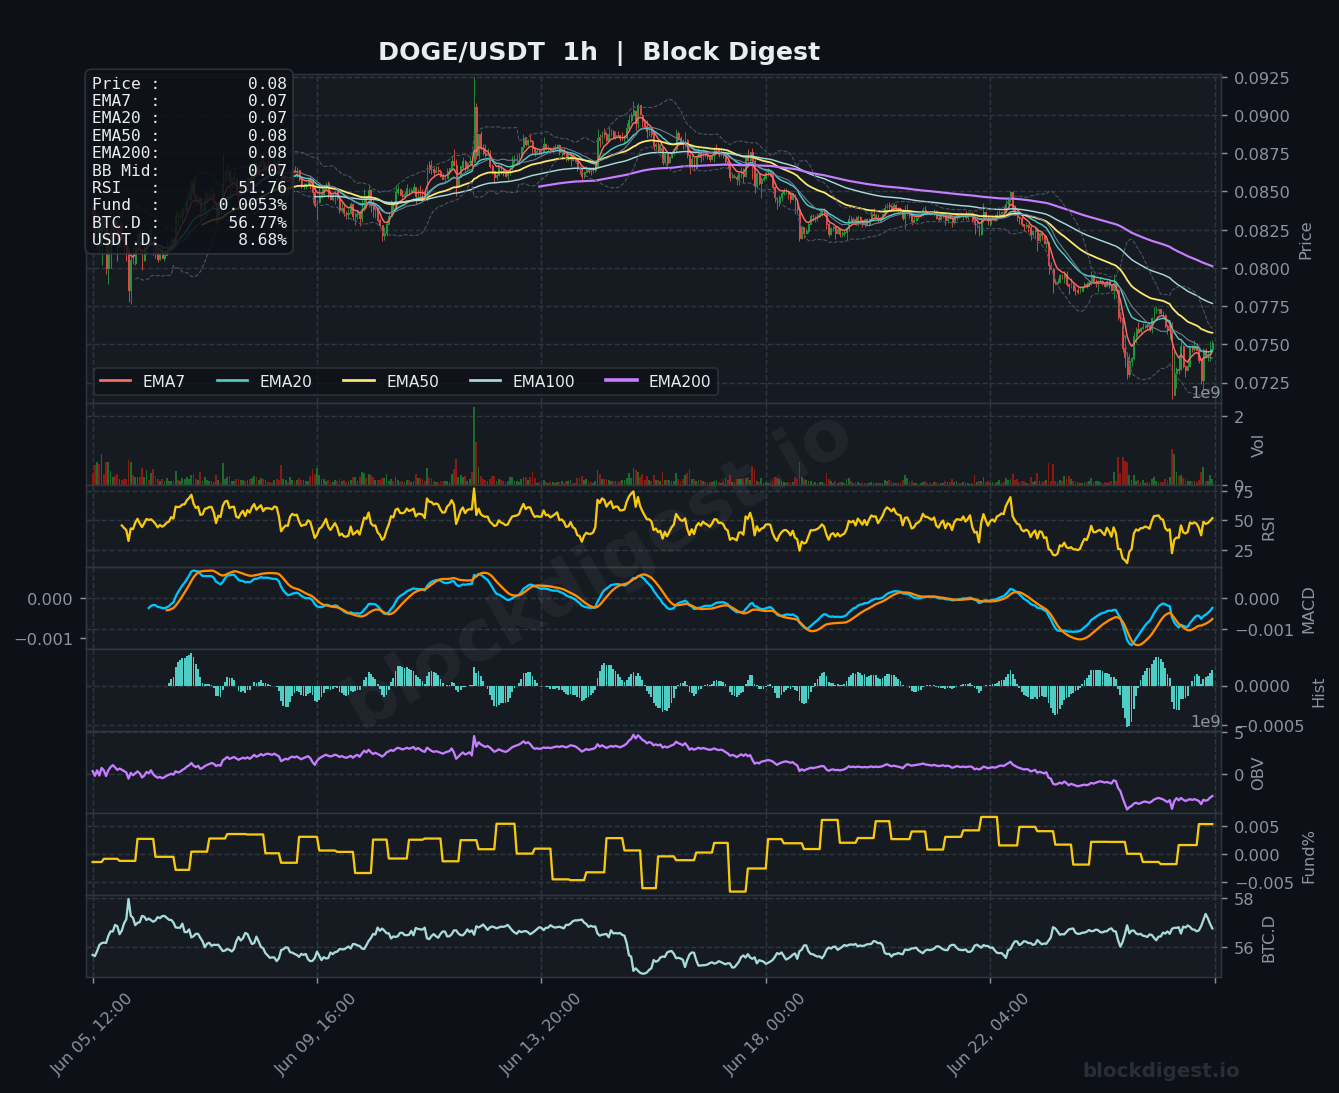
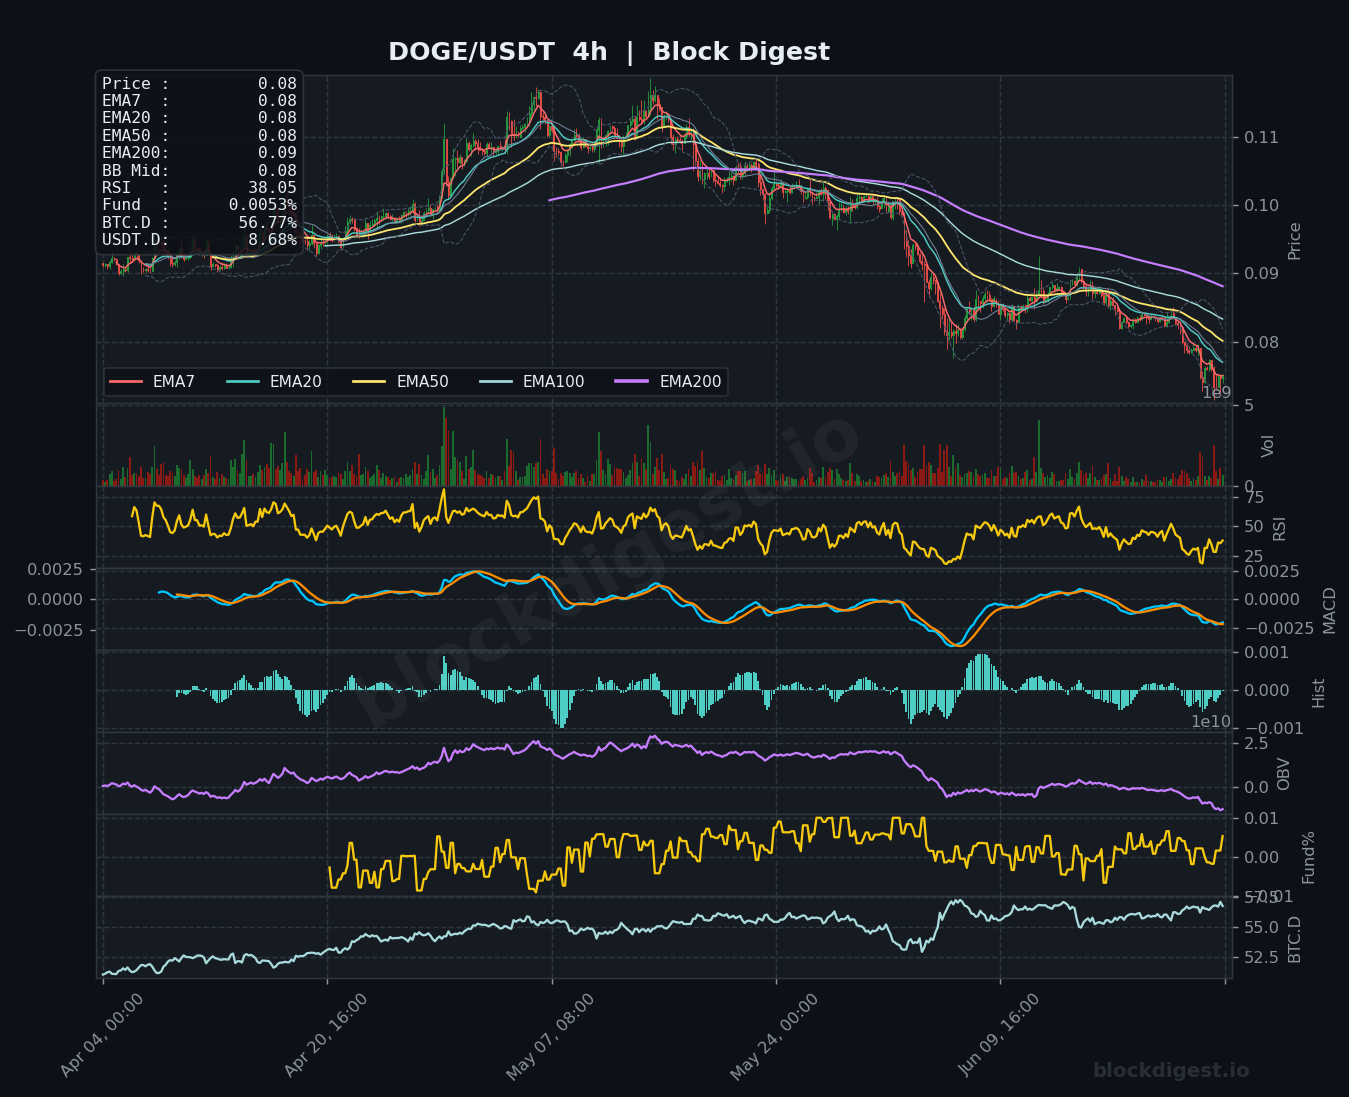
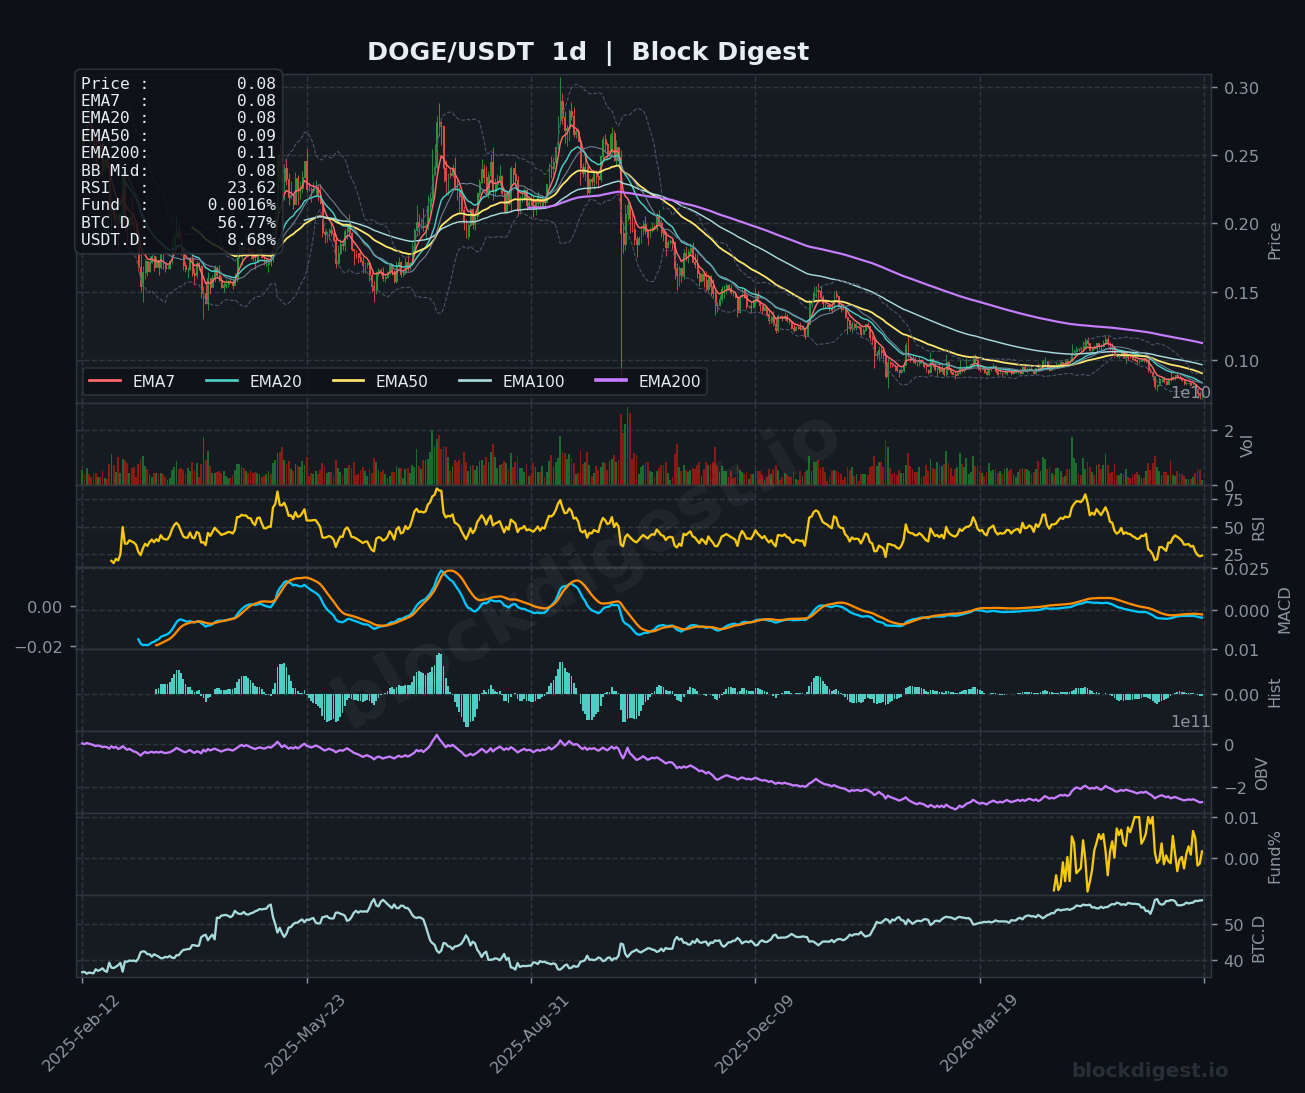
DOGE is trading at $0.0800, having experienced a significant breakdown from the $0.085–$0.090 range visible on both the 1h and 4h charts over the past several weeks. The 4h RSI at 38.05 is approaching oversold levels, while the MACD remains in bearish territory with the histogram showing modest contraction in selling pressure. On the daily chart, RSI has collapsed to 23.62 — deeply oversold — and OBV continues to trend sharply lower, indicating persistent institutional-level distribution with no sign of accumulation. All daily EMAs are stacked bearishly above price (EMA7 at $0.08, EMA50 at $0.09, EMA200 at $0.11), and while the extreme daily RSI reading could trigger a technical bounce toward $0.082–$0.085, the structural setup remains decisively bearish.
Litecoin (LTC)
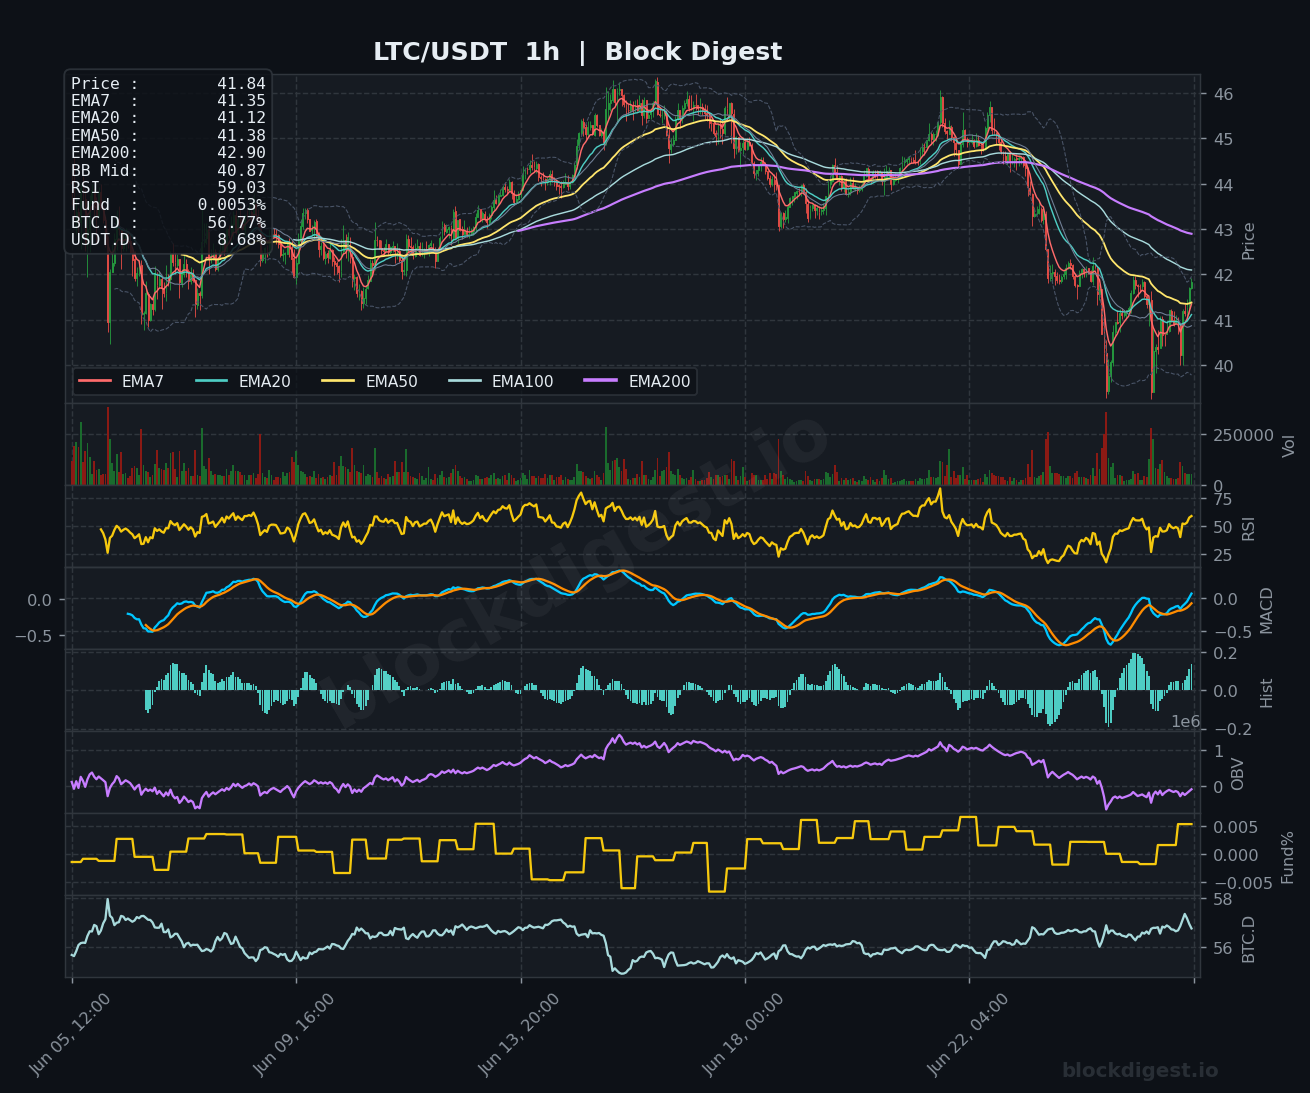
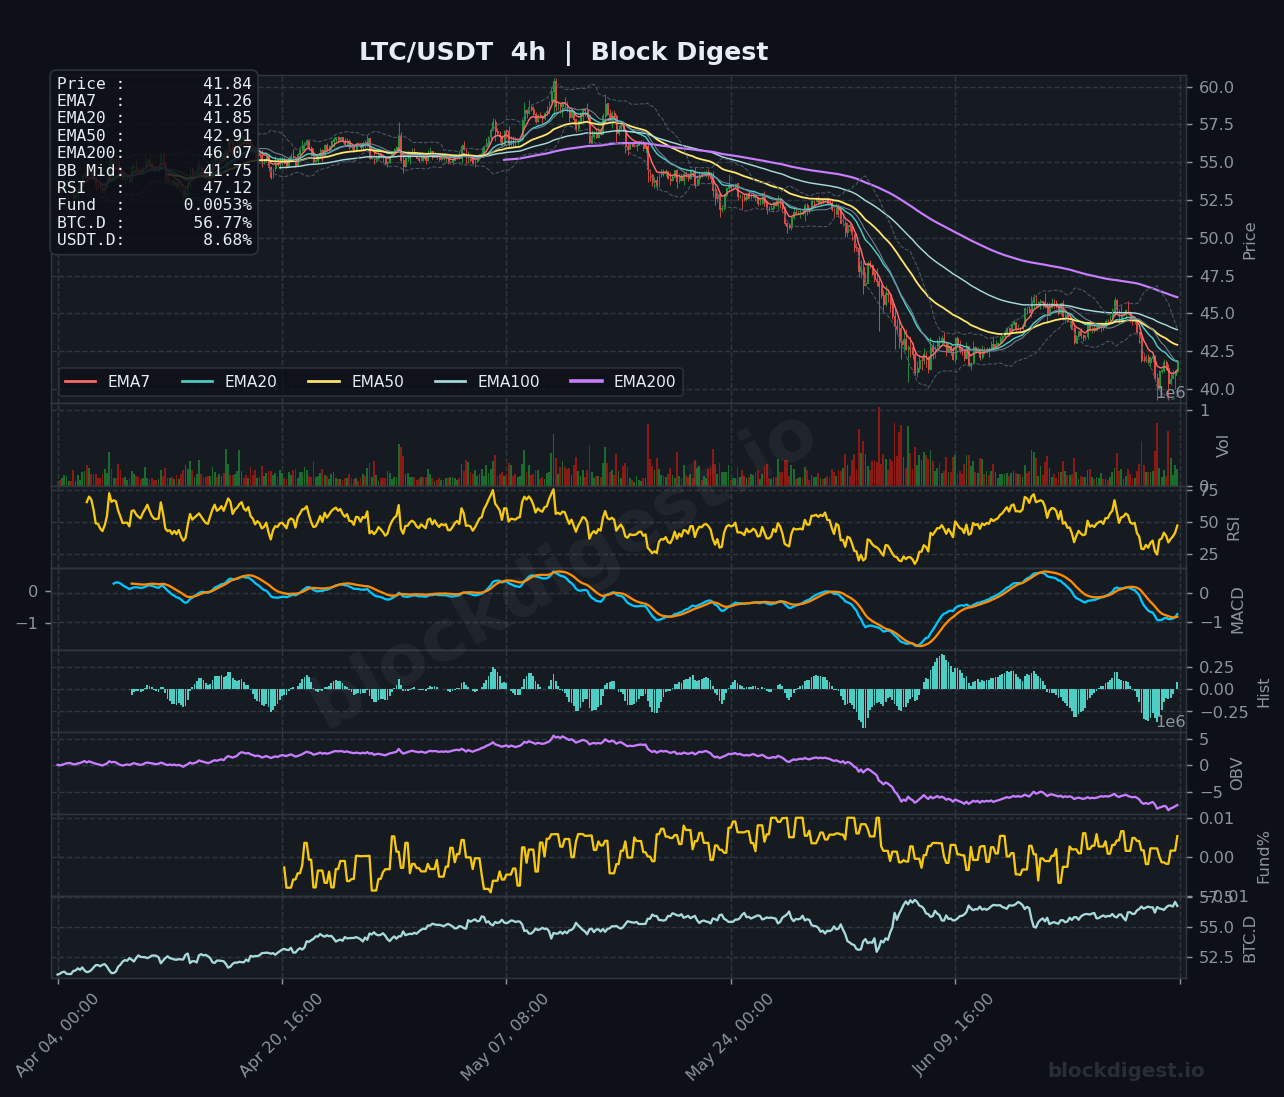
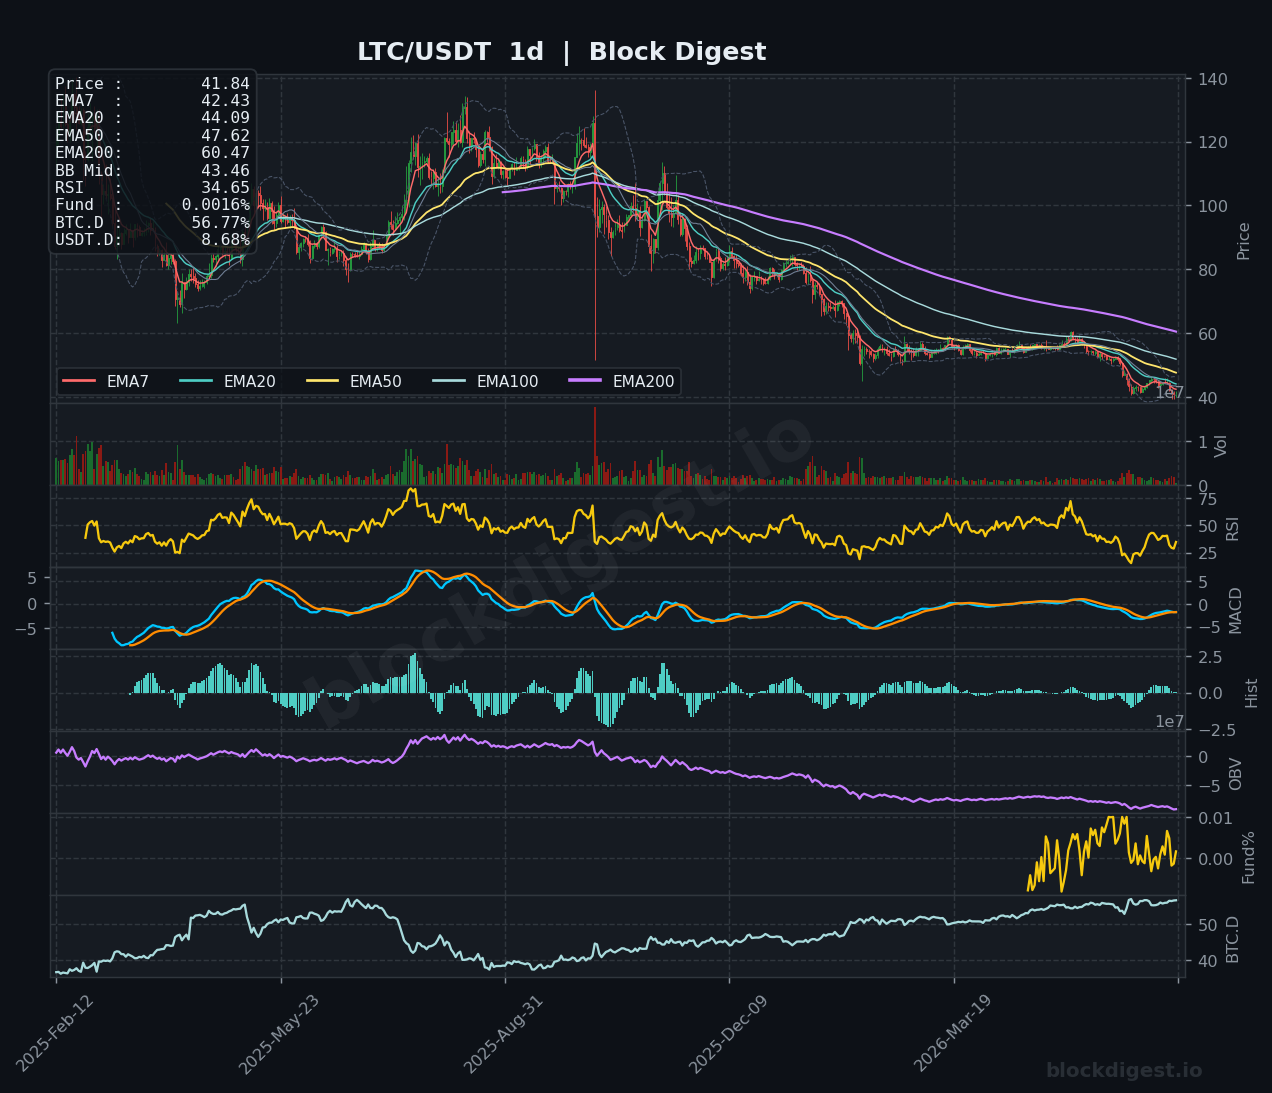
LTC is priced at $41.84, showing a mild 1h recovery with RSI at 59.03 after testing the $39.50–$40.00 support region on the lower Bollinger Band. On the 1h timeframe, price has reclaimed the EMA7 ($41.35) and EMA20 ($41.12), with MACD turning positive, suggesting a short-term bounce is underway. However, the 4h chart tells a more cautious story: RSI sits at 47.12 with MACD still in negative territory but flattening, and all short-term EMAs remain in a bearish stack with price trading beneath the EMA50 ($42.91) and EMA200 ($46.07). The daily chart is structurally weak — RSI at 34.65, OBV in a persistent downtrend, and price below all major EMAs including the daily EMA50 at $47.62 — leaving the short-term bias neutral at best, with significant resistance clustered between $43 and $47.
TRON (TRX)
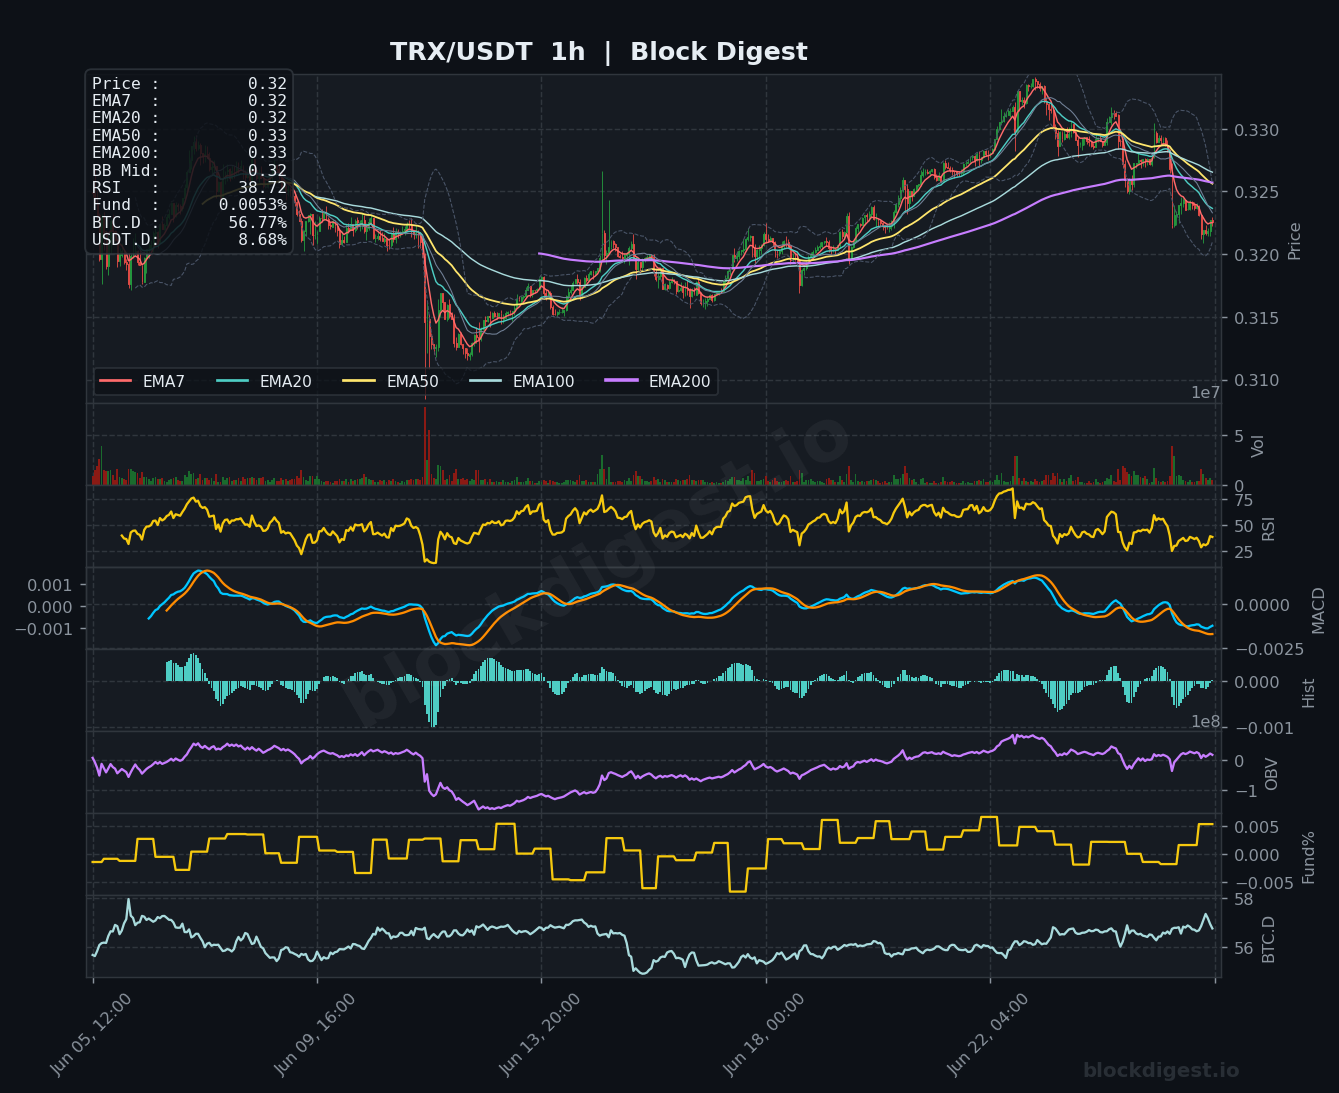
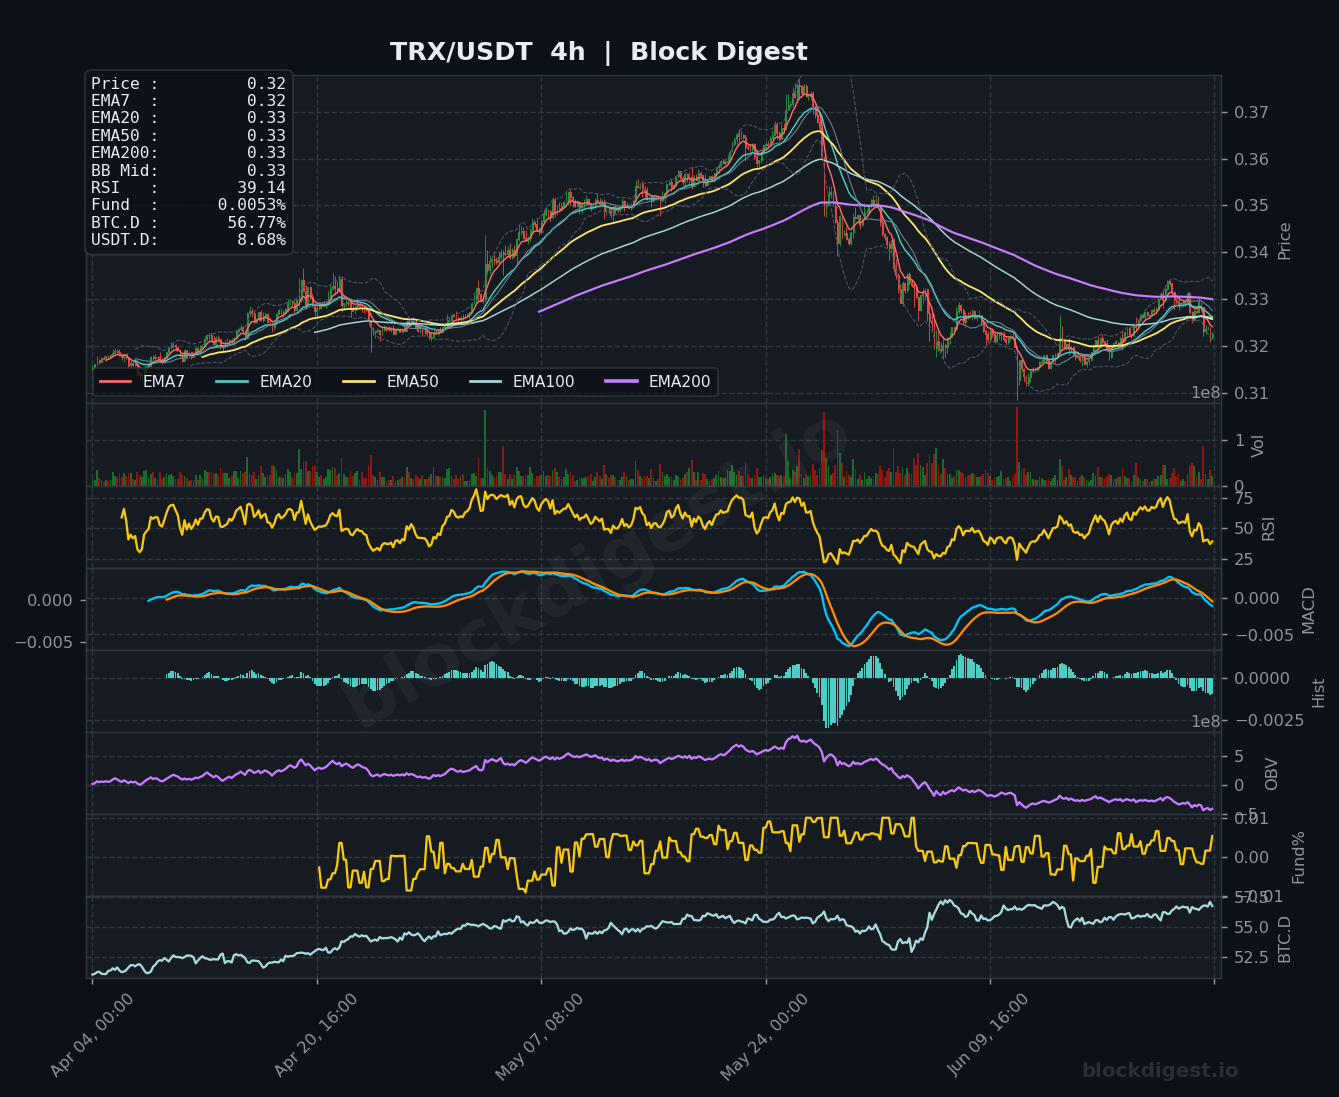
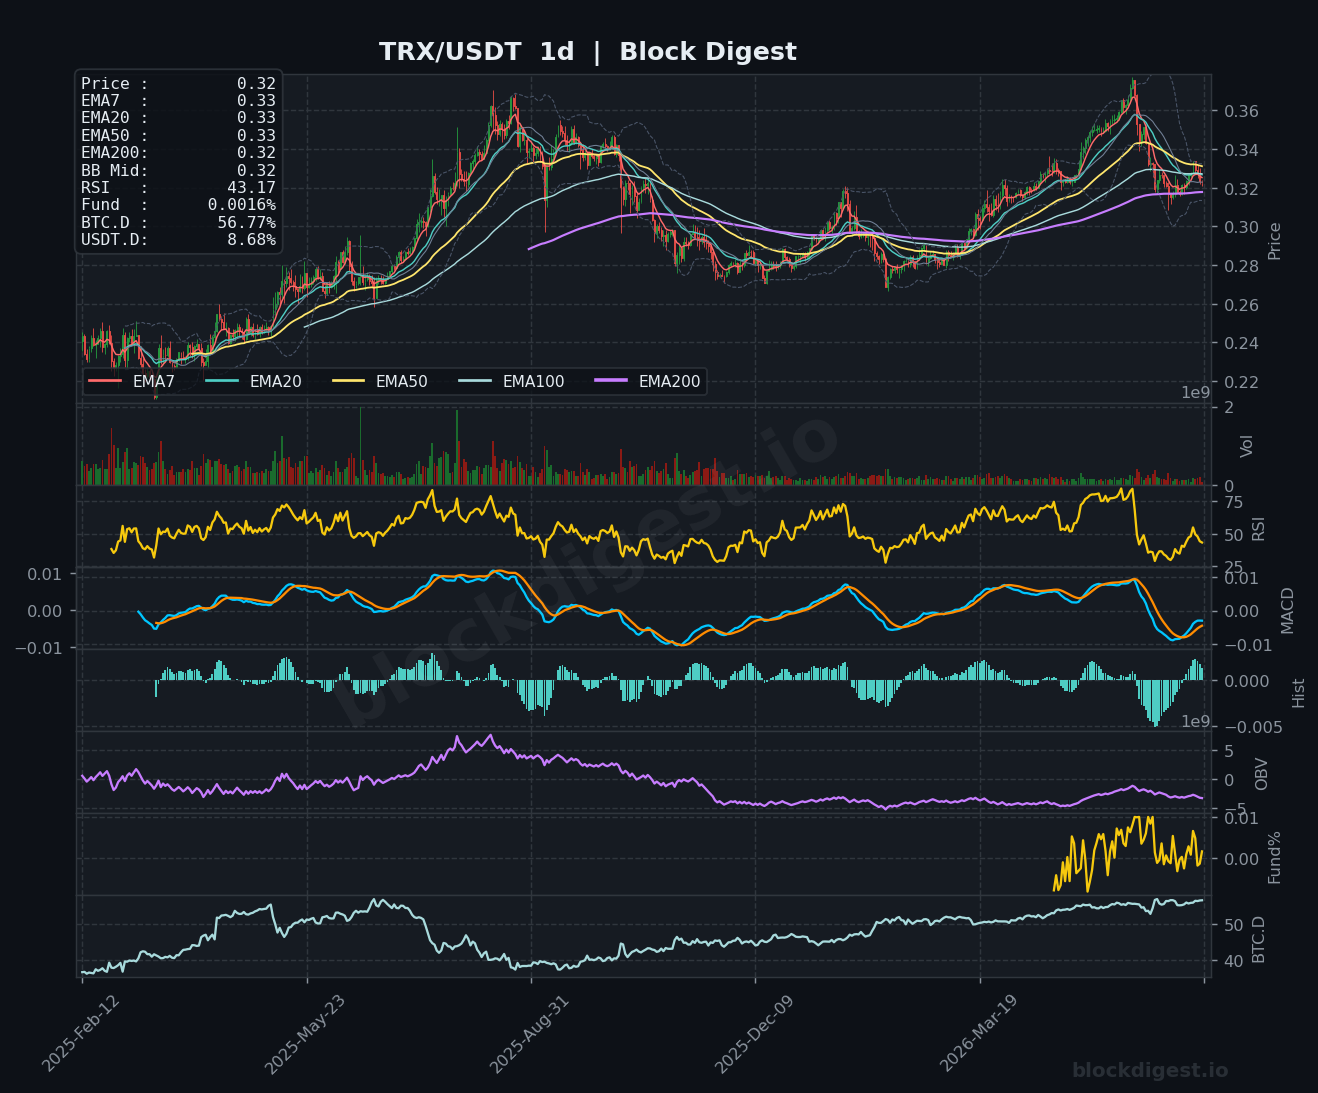
TRX at $0.32 presents the most resilient setup among the coins reviewed today, having held up notably better on a relative basis throughout the broader market weakness. The daily chart shows TRX is trading near its EMA200 ($0.32) with the EMA7 ($0.33), EMA20 ($0.33), and EMA50 ($0.33) all clustered tightly just above — a bearish compression that could resolve in either direction. The 4h RSI at 39.14 and the 1h RSI at 38.72 both indicate softening momentum following a pullback from the recent $0.33–$0.37 peak range, and the 4h MACD is negative but showing signs of flattening. Daily RSI at 43.17 and a relatively stable OBV compared to peers suggest TRX is digesting gains rather than distributing; the short-term bias is cautiously neutral with a slight bearish lean unless $0.33 is reclaimed on a closing basis.
Altcoin Outlook
The altcoin market as of June 26, 2026 is broadly under pressure, with sustained BTC dominance at 56.77% and elevated USDT.D at 8.68% creating a headwind for risk-on rotation. Among the coins reviewed, TRX shows the strongest relative structure — holding near long-term support with comparatively stable OBV — while DOGE and XRP display the weakest setups, with daily RSI readings in near-oversold or oversold territory and consistently declining on-chain volume indicators. SOL and BNB are attempting short-term technical recoveries but face formidable EMA resistance on the daily timeframe that will need to be cleared to change the intermediate trend. Traders should watch for a USDT.D rollover below the 8.50% level or a BTC.D pullback below 56% as early signals that altcoin rotation may resume.
Disclaimer: This analysis is for informational purposes only and does not constitute financial advice. Cryptocurrency markets are highly volatile and unpredictable. All trading decisions should be made based on your own research and risk tolerance. Block Digest is not responsible for any financial losses incurred as a result of acting on this content.
Stay Ahead of the Market
Follow BlockDigest for crypto market intelligence, research and real-time updates.


