Altcoin Daily Analysis — May 12, 2026
Altcoin Daily Roundup – May 12, 2026
Market Context
The altcoin market is exhibiting mixed signals with Bitcoin dominance holding at 54.76-54.78% across timeframes, suggesting a relatively neutral environment for altcoin performance. USDT dominance at 6.82% indicates moderate risk appetite, neither signaling aggressive risk-on behavior nor defensive positioning. Most major altcoins are consolidating near key technical levels following recent volatility, with several coins showing signs of momentum exhaustion after sharp rallies.
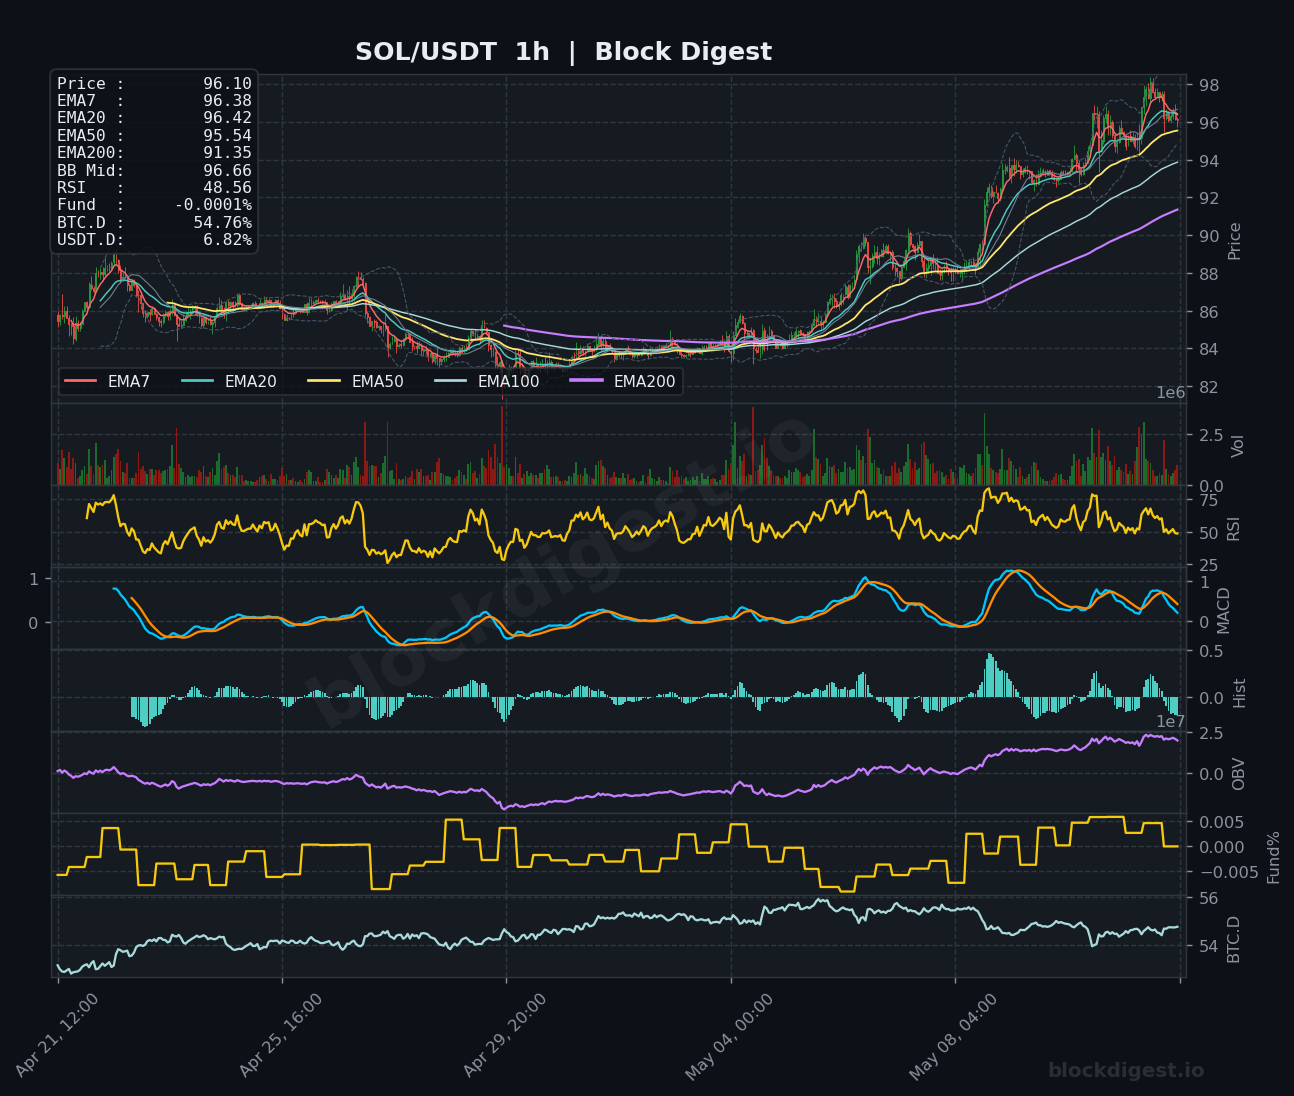
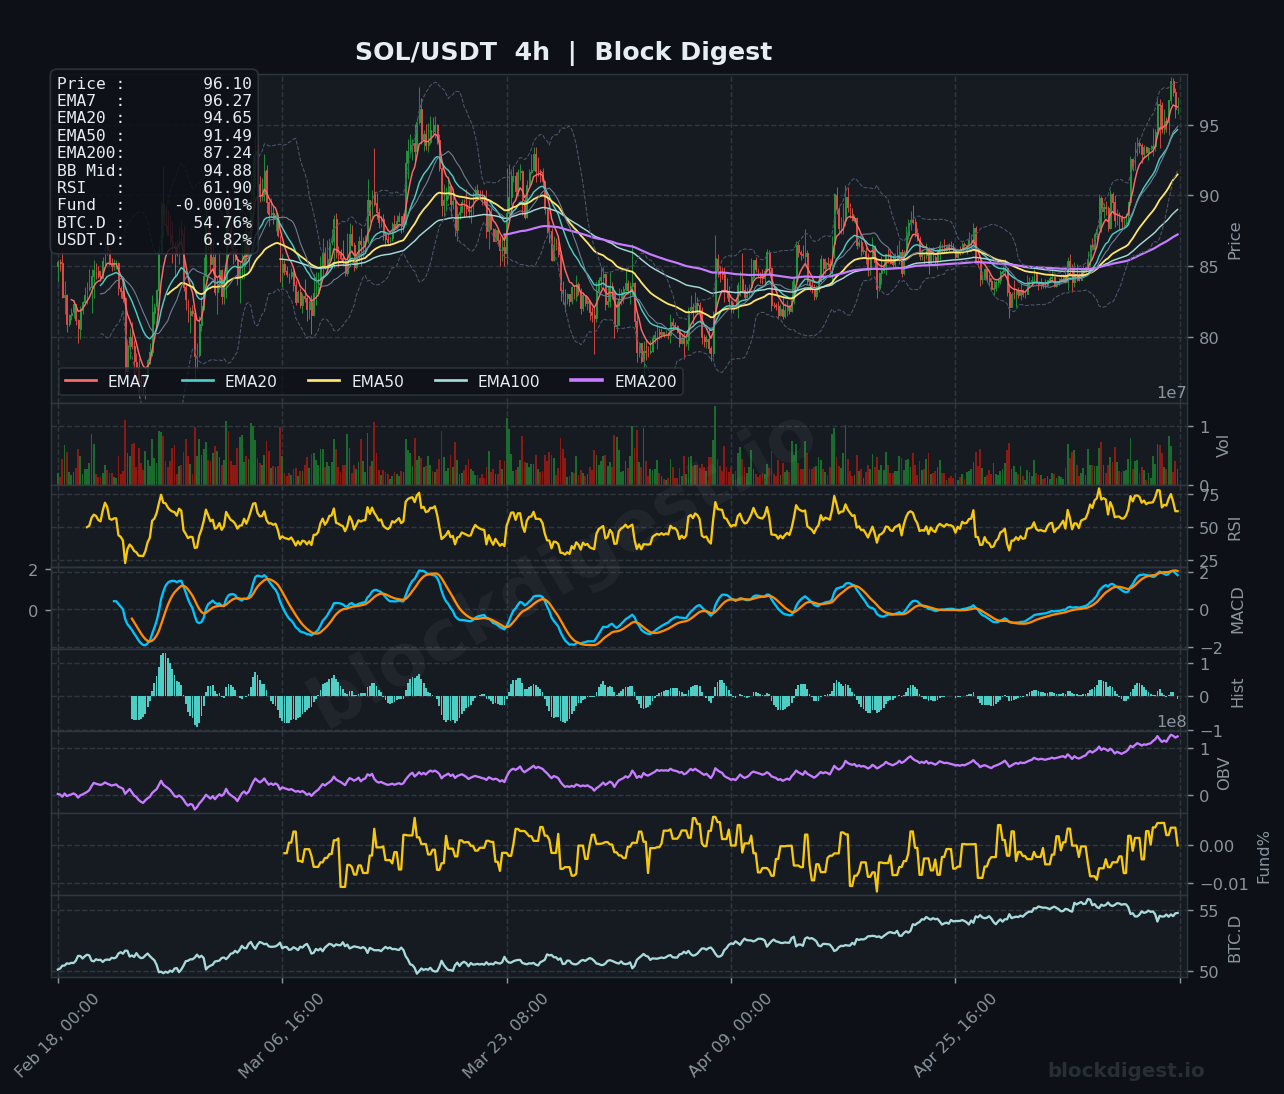
Solana (SOL)
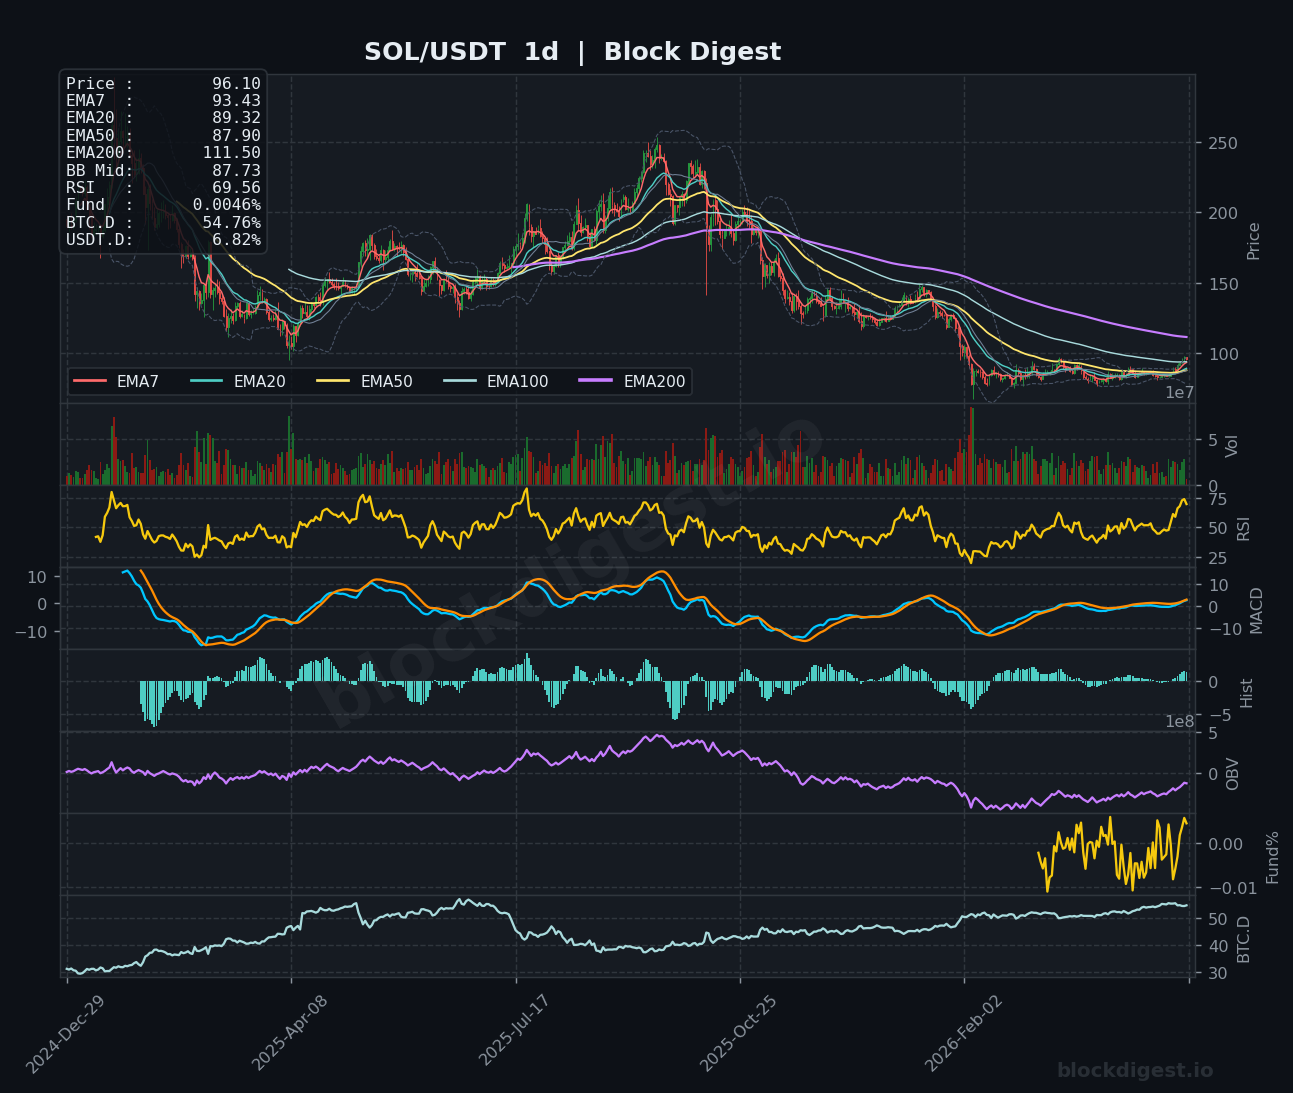
Solana is trading at $96.10 after experiencing a sharp rejection from the $98 level, with price currently compressed between short-term moving averages. The RSI at 48.56 on the 1-hour chart reflects neutral momentum, while the daily timeframe shows RSI at 69.56, indicating the asset may be approaching overbought territory. Price is holding above the critical $95.54 (EMA50 on 1h) support zone, with the 4-hour chart showing a bullish EMA alignment despite recent consolidation. The MACD histogram is turning negative on lower timeframes, suggesting short-term bearish pressure, though the broader daily structure remains constructive above the $87-91 support cluster.
XRP (XRP)
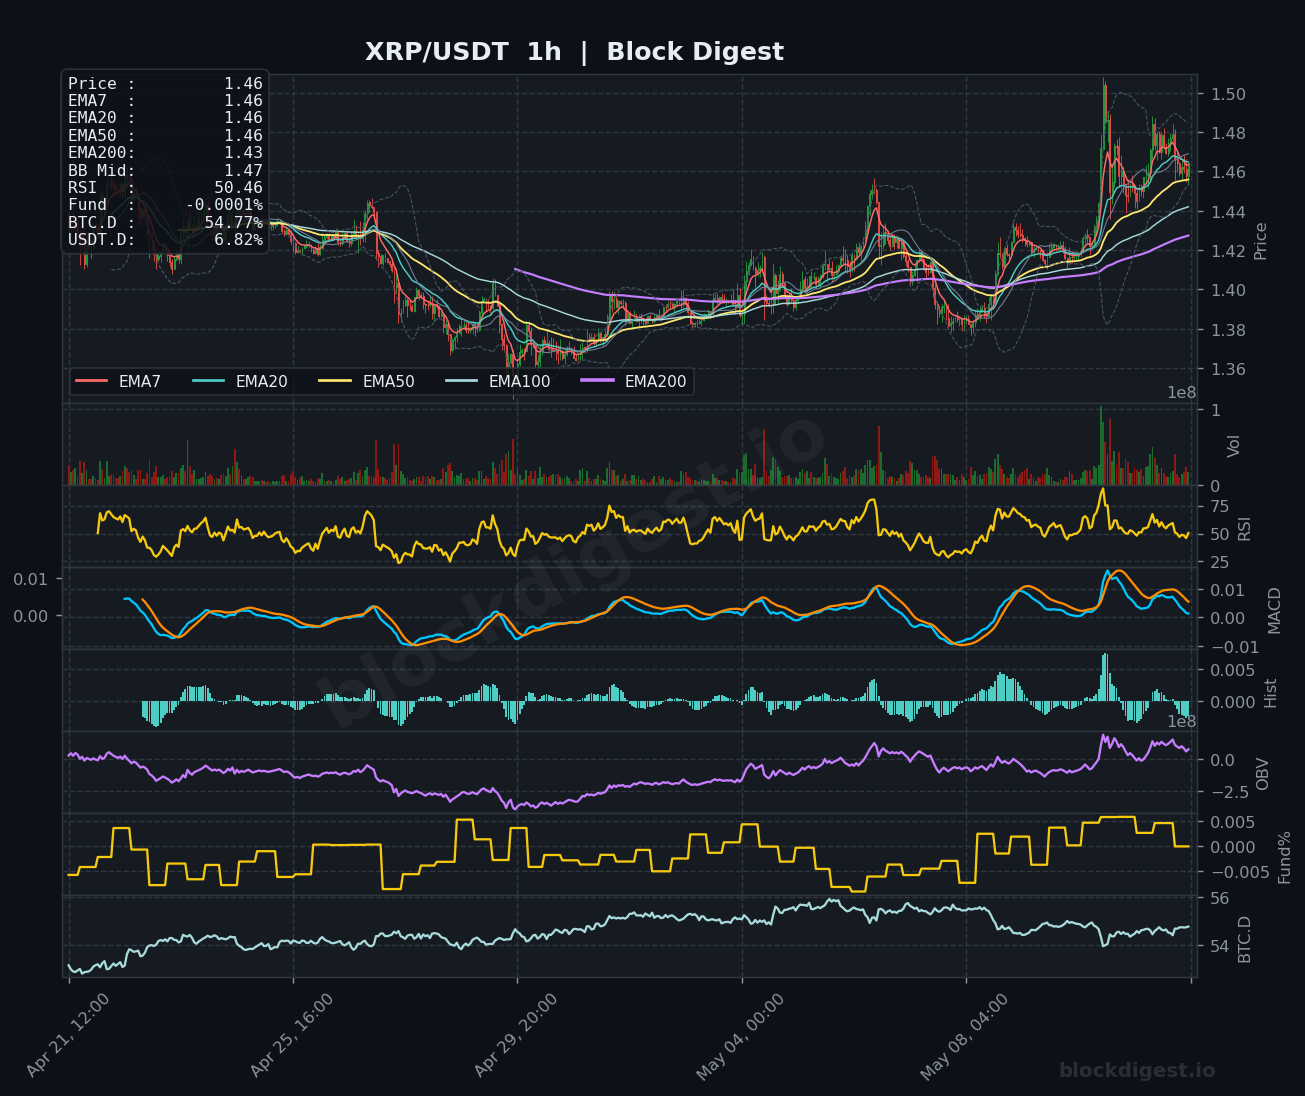
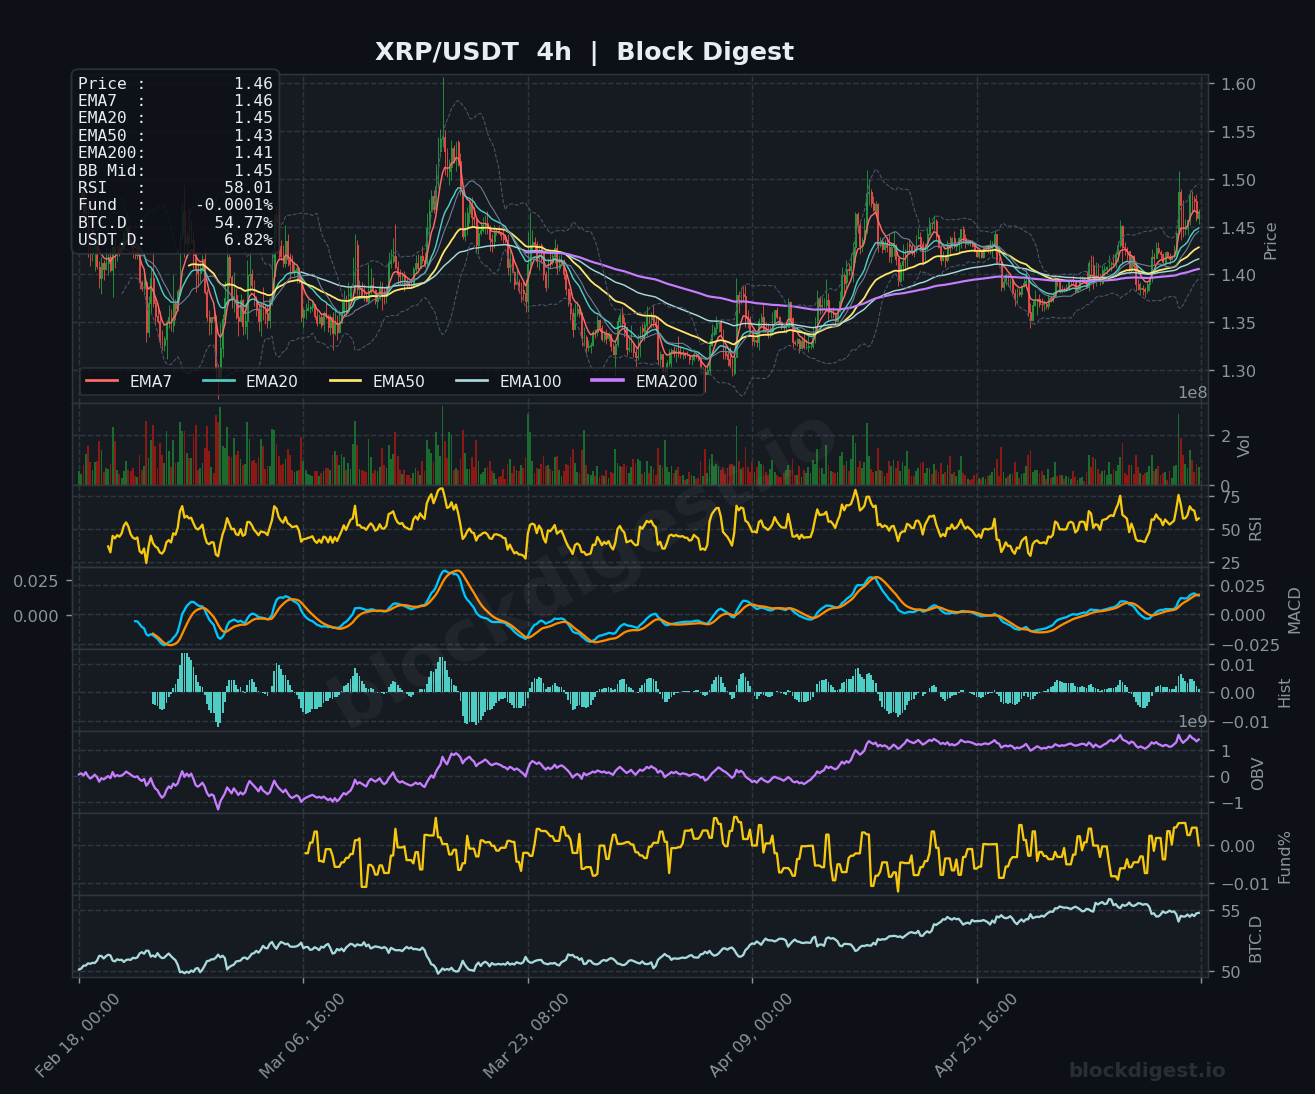
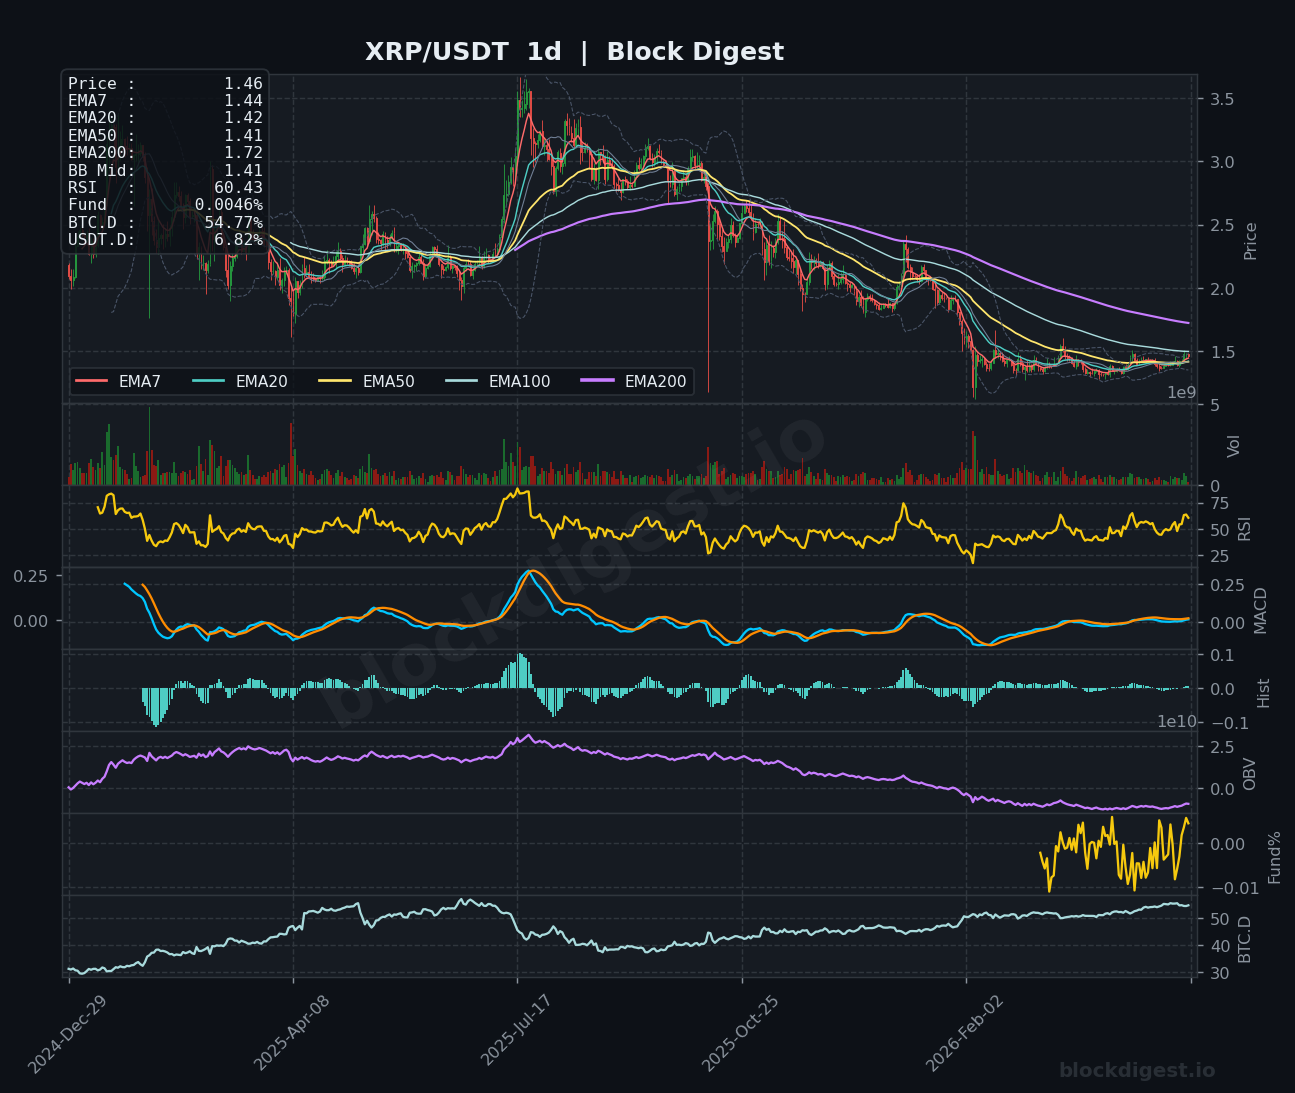
XRP is trading at $1.46, hovering just below the psychologically significant $1.50 resistance level that has capped recent advances. The token shows tight consolidation with all major EMAs converging around current price levels, creating a coiled spring setup on the 1-hour timeframe. RSI readings of 50.46 (1h) and 58.01 (4h) suggest balanced momentum with slight bullish lean, while the daily RSI at 60.43 indicates room for upside before overbought conditions. The MACD is approaching a bullish crossover on the 4-hour chart, and price remains well-supported by the rising EMA200 at $1.43, establishing a clear risk level for bulls attempting to break above $1.50.
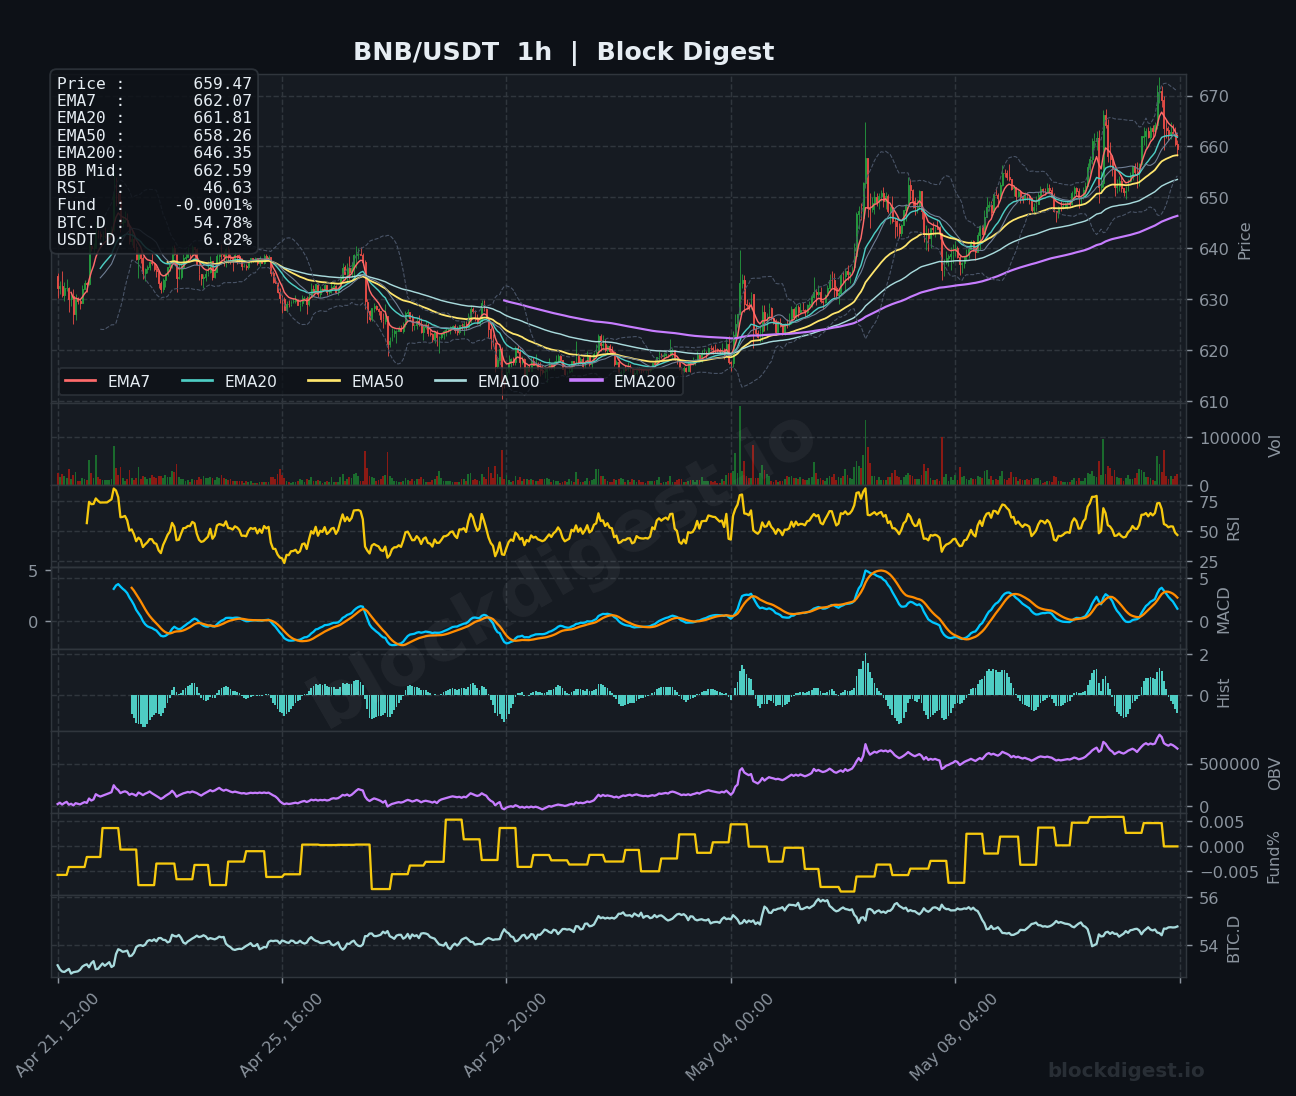
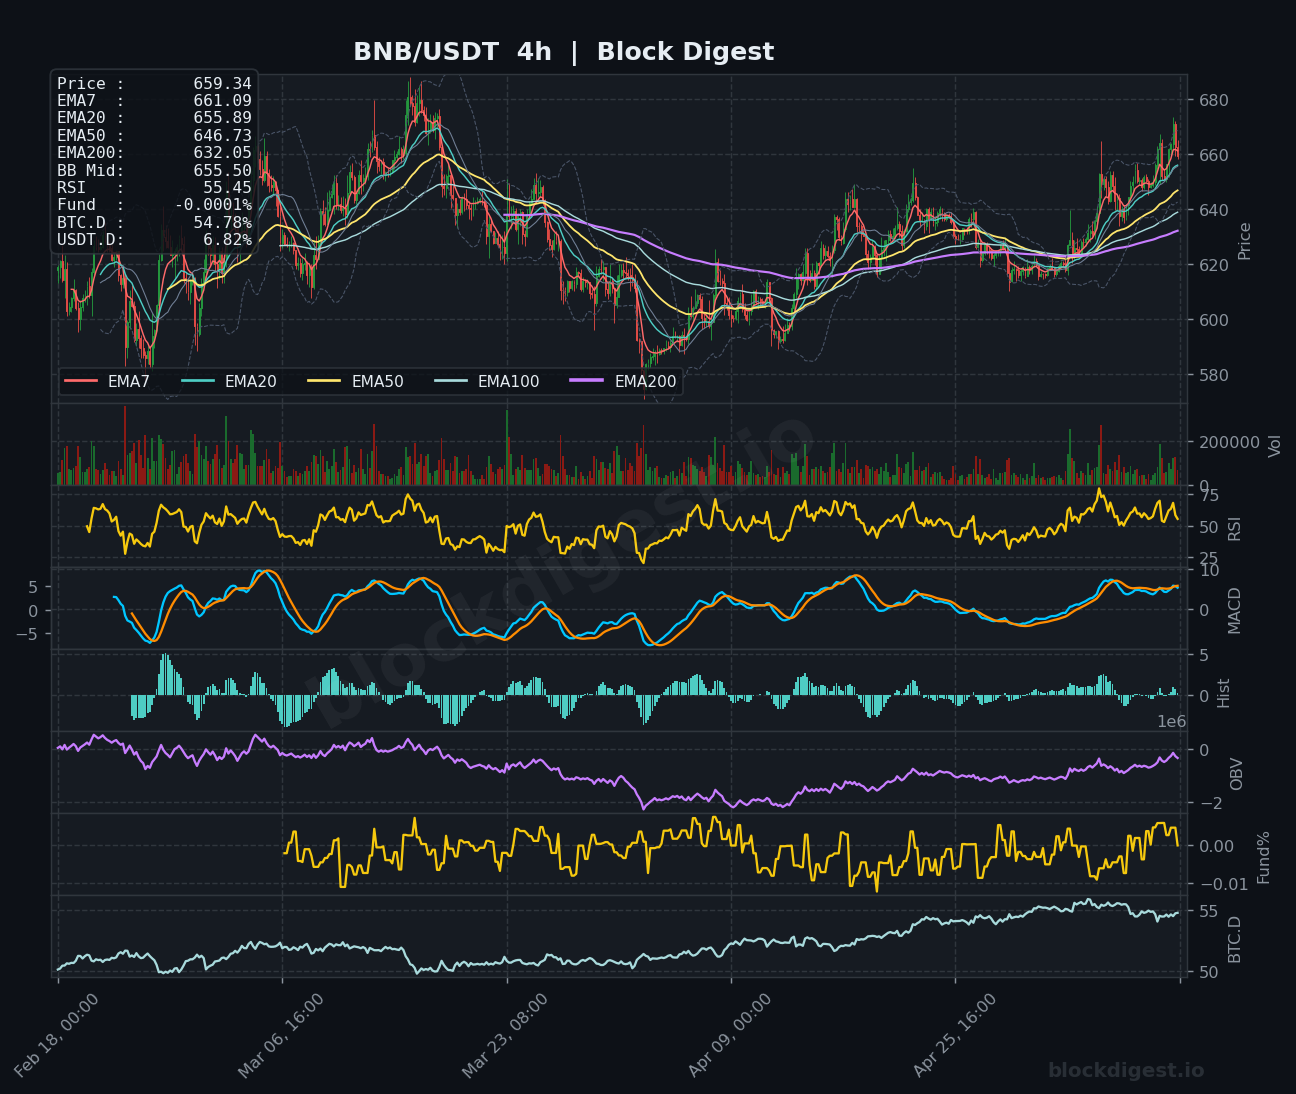
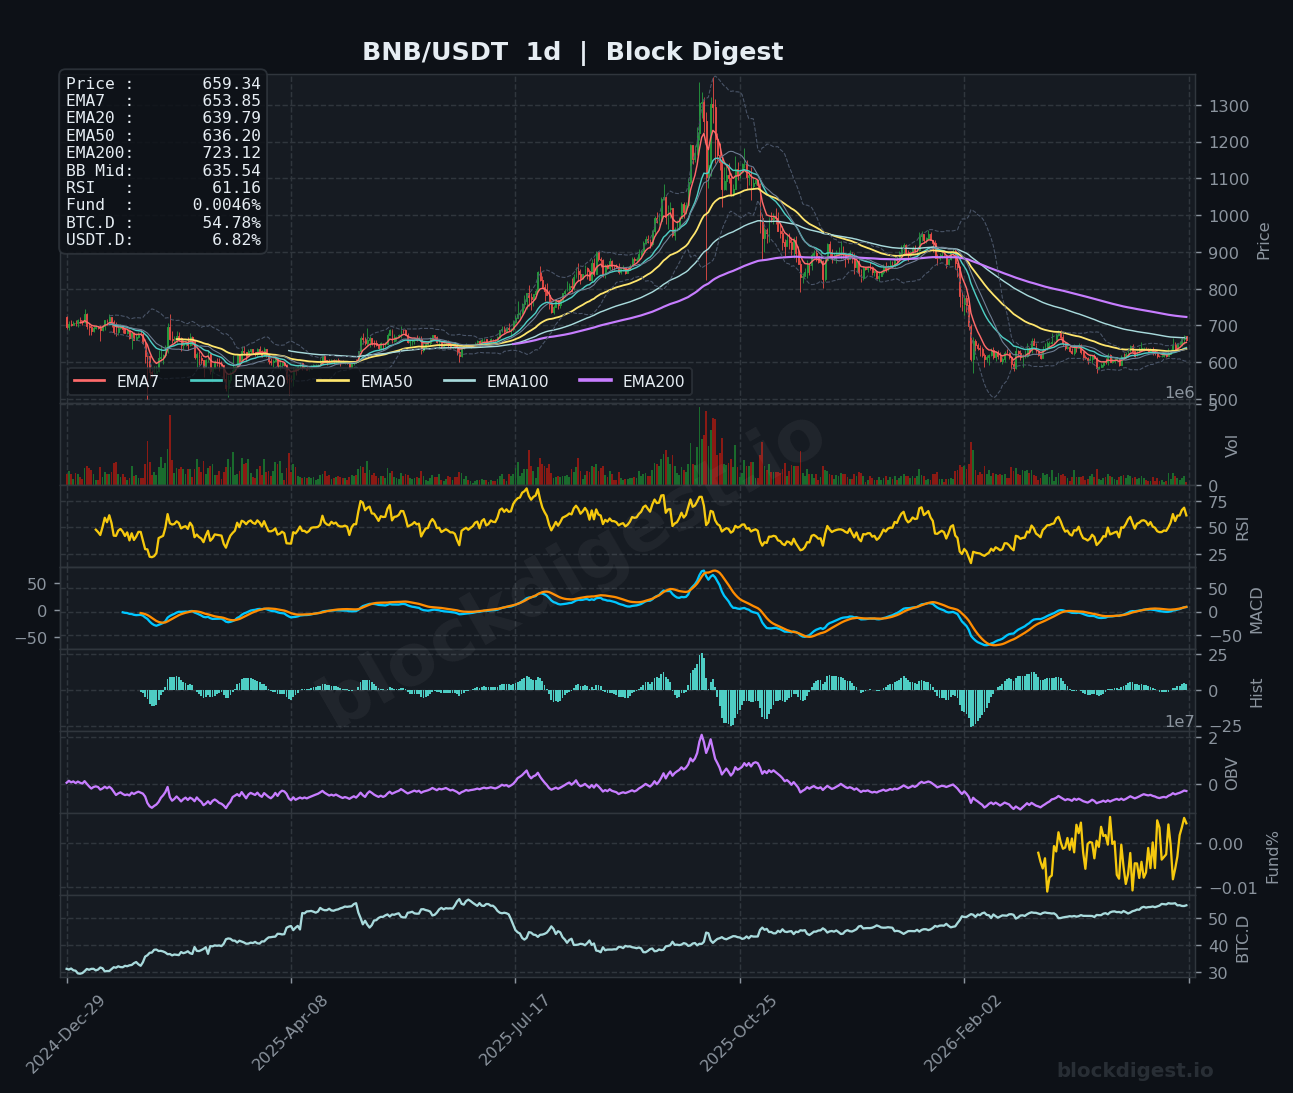
BNB (BNB)
Binance Coin is trading at $659.47 following a sharp rally that pushed price above the $670 resistance before experiencing profit-taking. The 1-hour chart shows RSI cooling to 46.63 after reaching overbought levels, while the 4-hour RSI at 55.45 suggests the correction is healthy within the broader uptrend. Price is testing support at the convergence of EMA20 ($661.81) and EMA50 ($658.26), a critical zone that has provided support during previous pullbacks. The daily structure remains bullish with price well above the $636-646 support zone, though momentum indicators suggest consolidation may persist before the next directional move, with $670-680 representing key resistance and $640 as downside support.
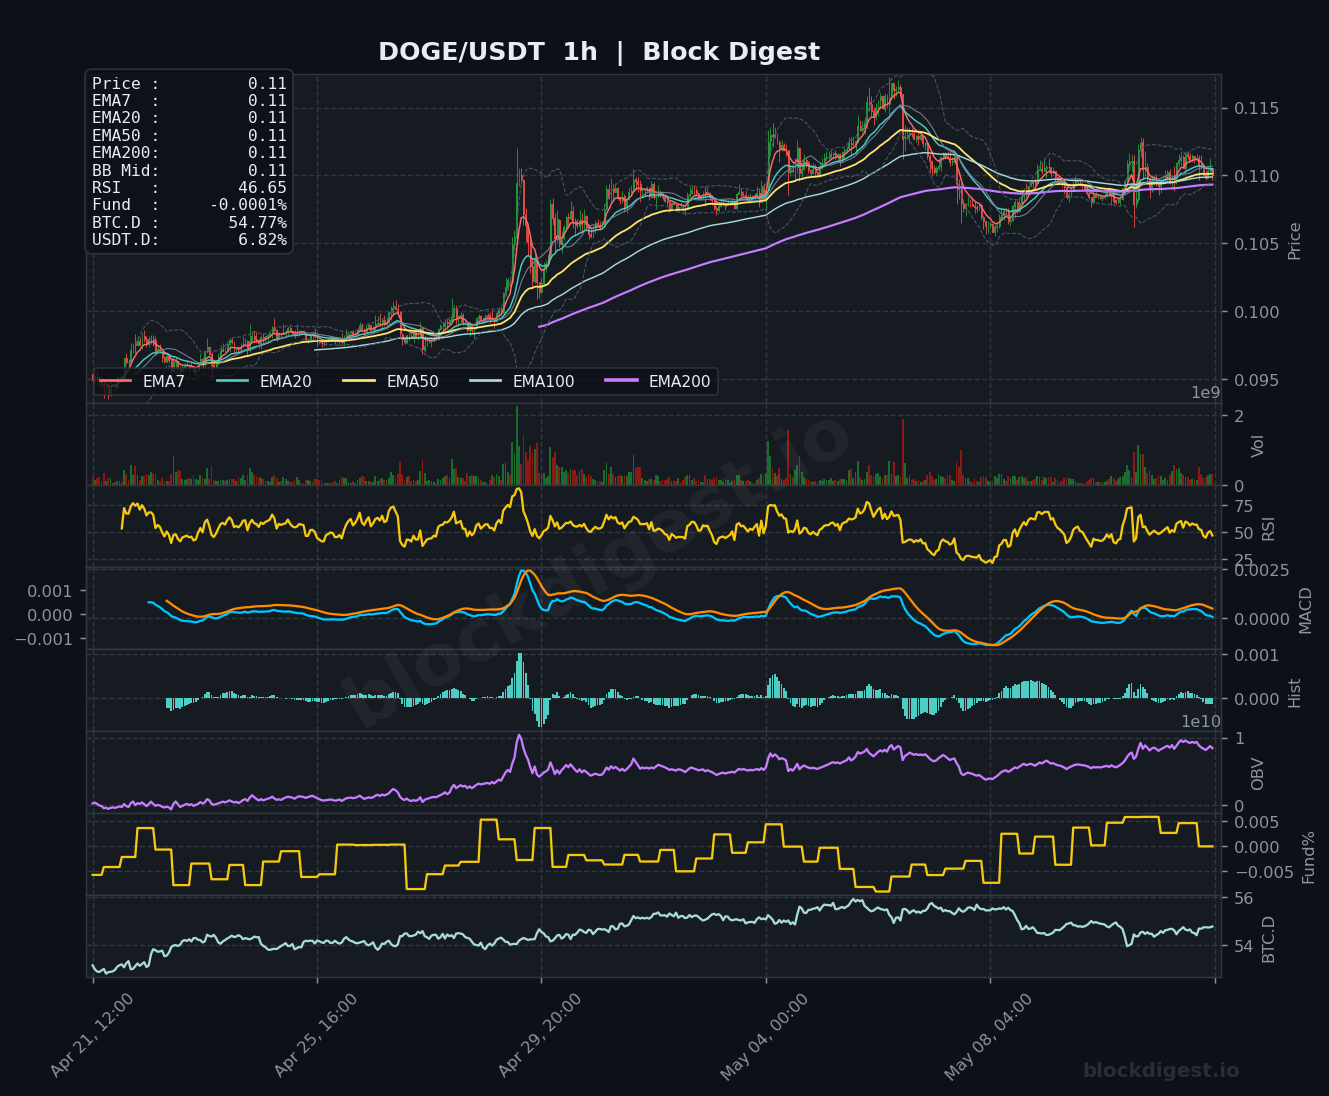
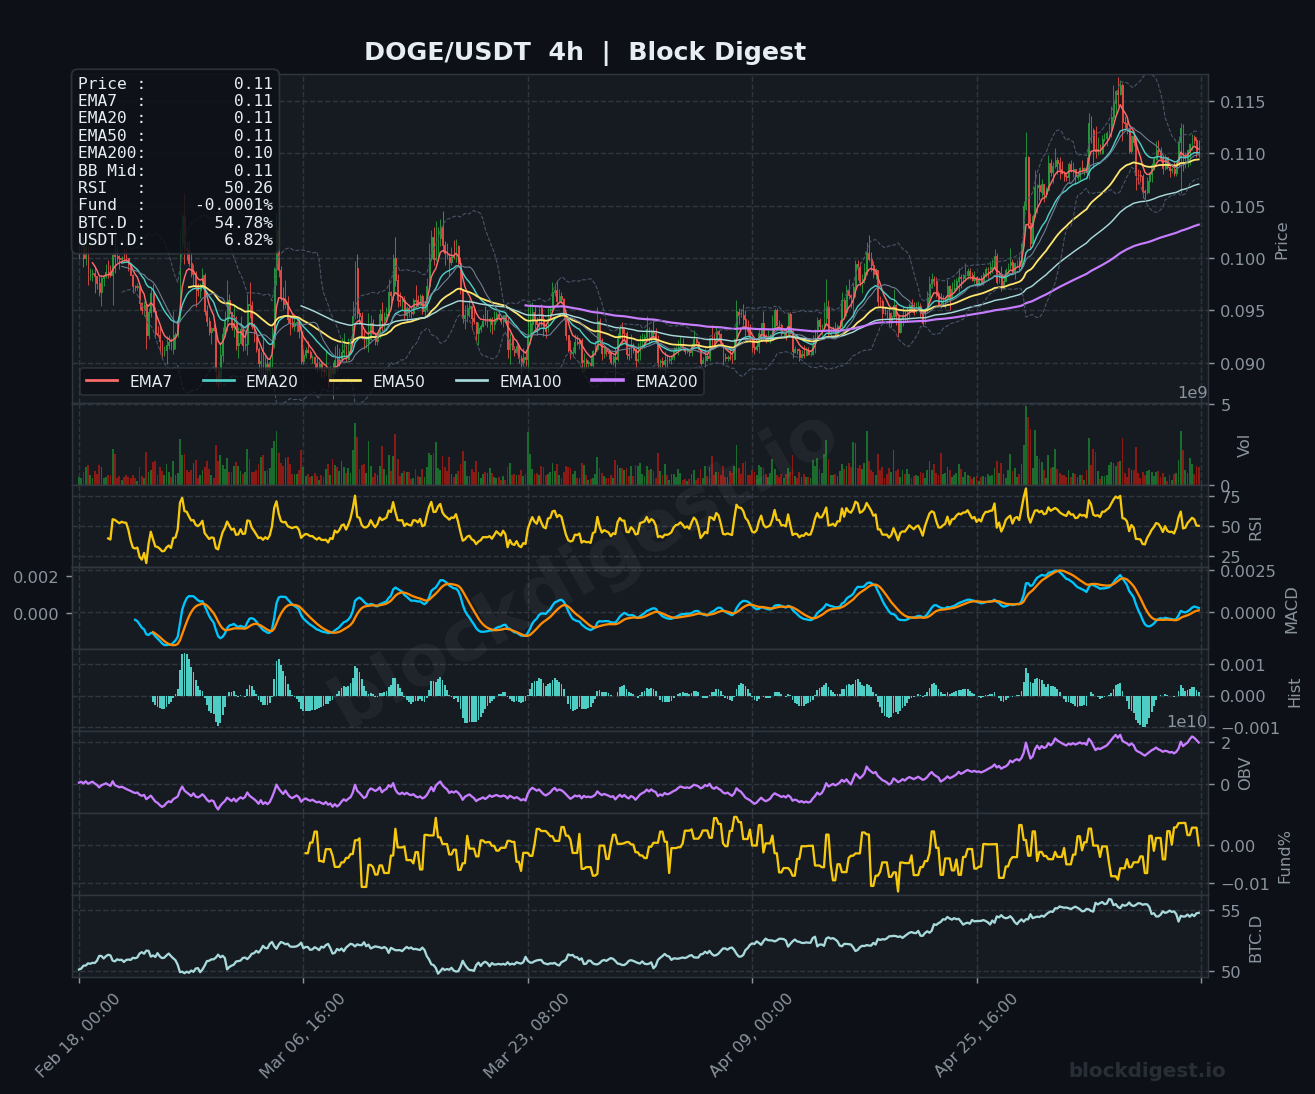
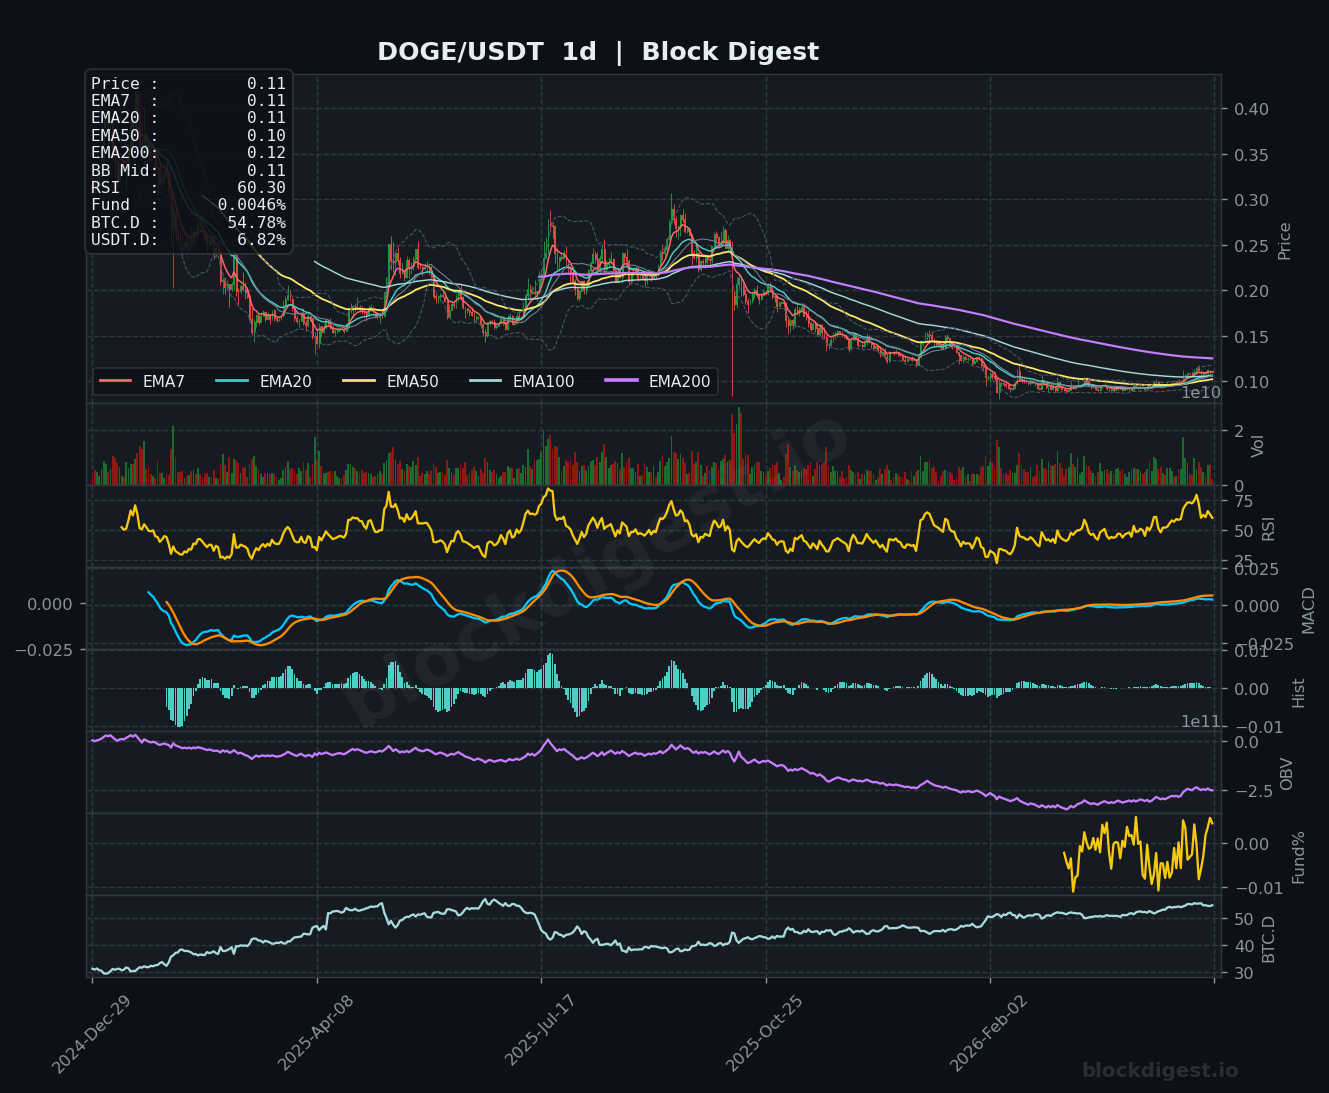
Dogecoin (DOGE)
Dogecoin is trading at $0.1100, locked in a tight range between $0.1085 and $0.1115 as bulls and bears battle for control. The RSI across all timeframes (46.65 on 1h, 50.26 on 4h, 60.30 on daily) indicates balanced conditions with slight bullish bias on higher timeframes. Price is consolidating at the convergence of all major EMAs on the 1-hour chart, creating a compression pattern that typically precedes a breakout. The MACD shows diminishing momentum on lower timeframes while remaining slightly positive on the daily, and the coin is holding above the critical psychological support at $0.1000, with immediate resistance at $0.1150 that needs to break for bulls to regain control.
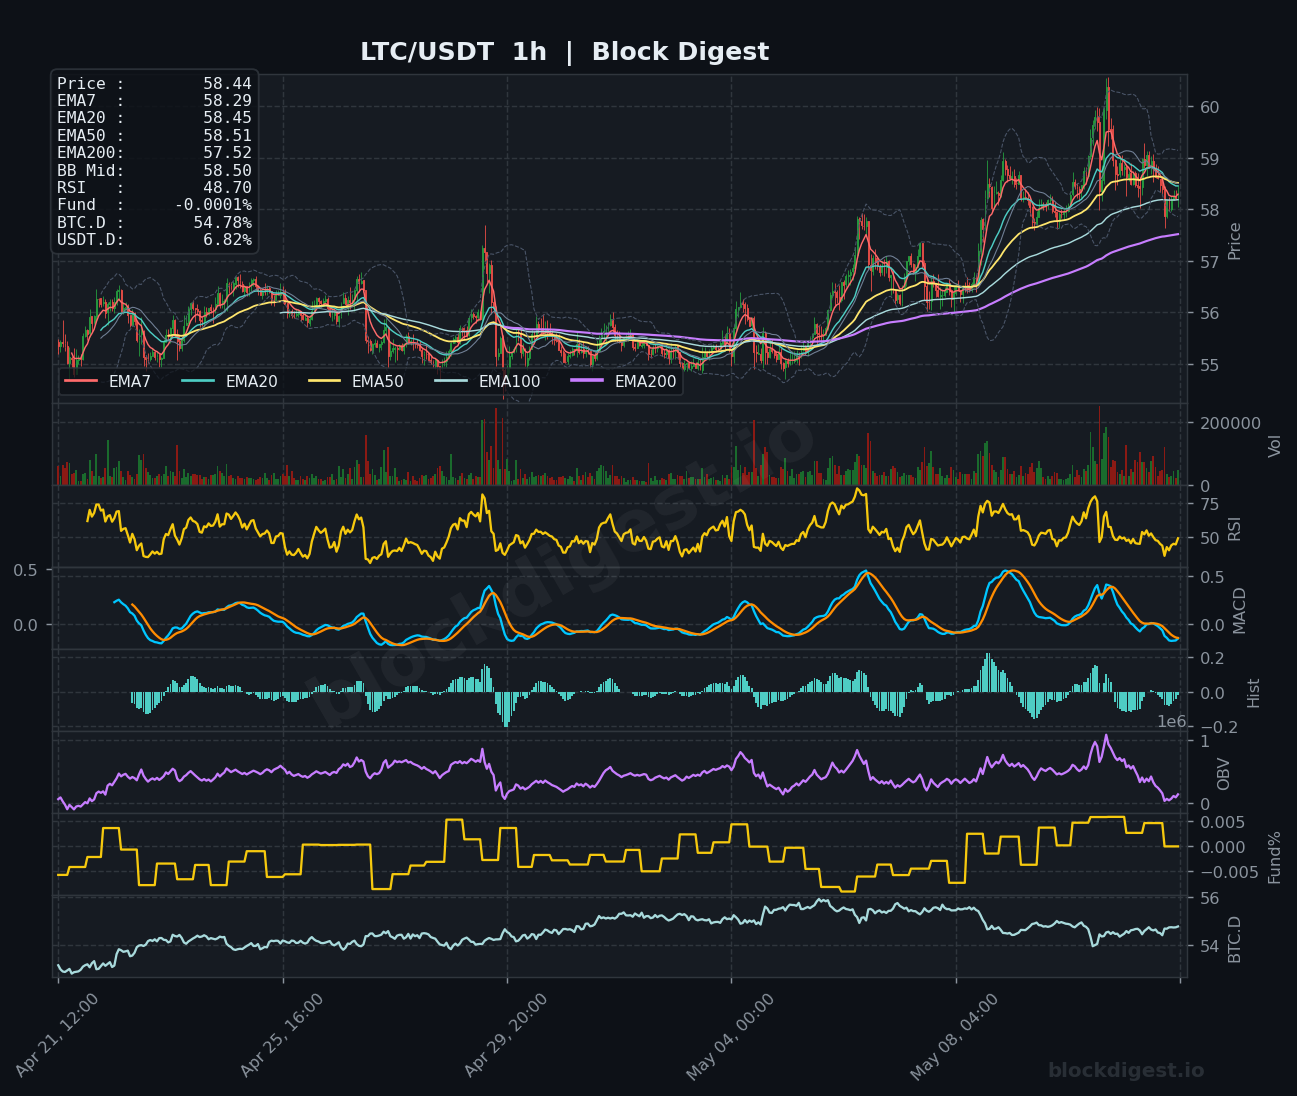
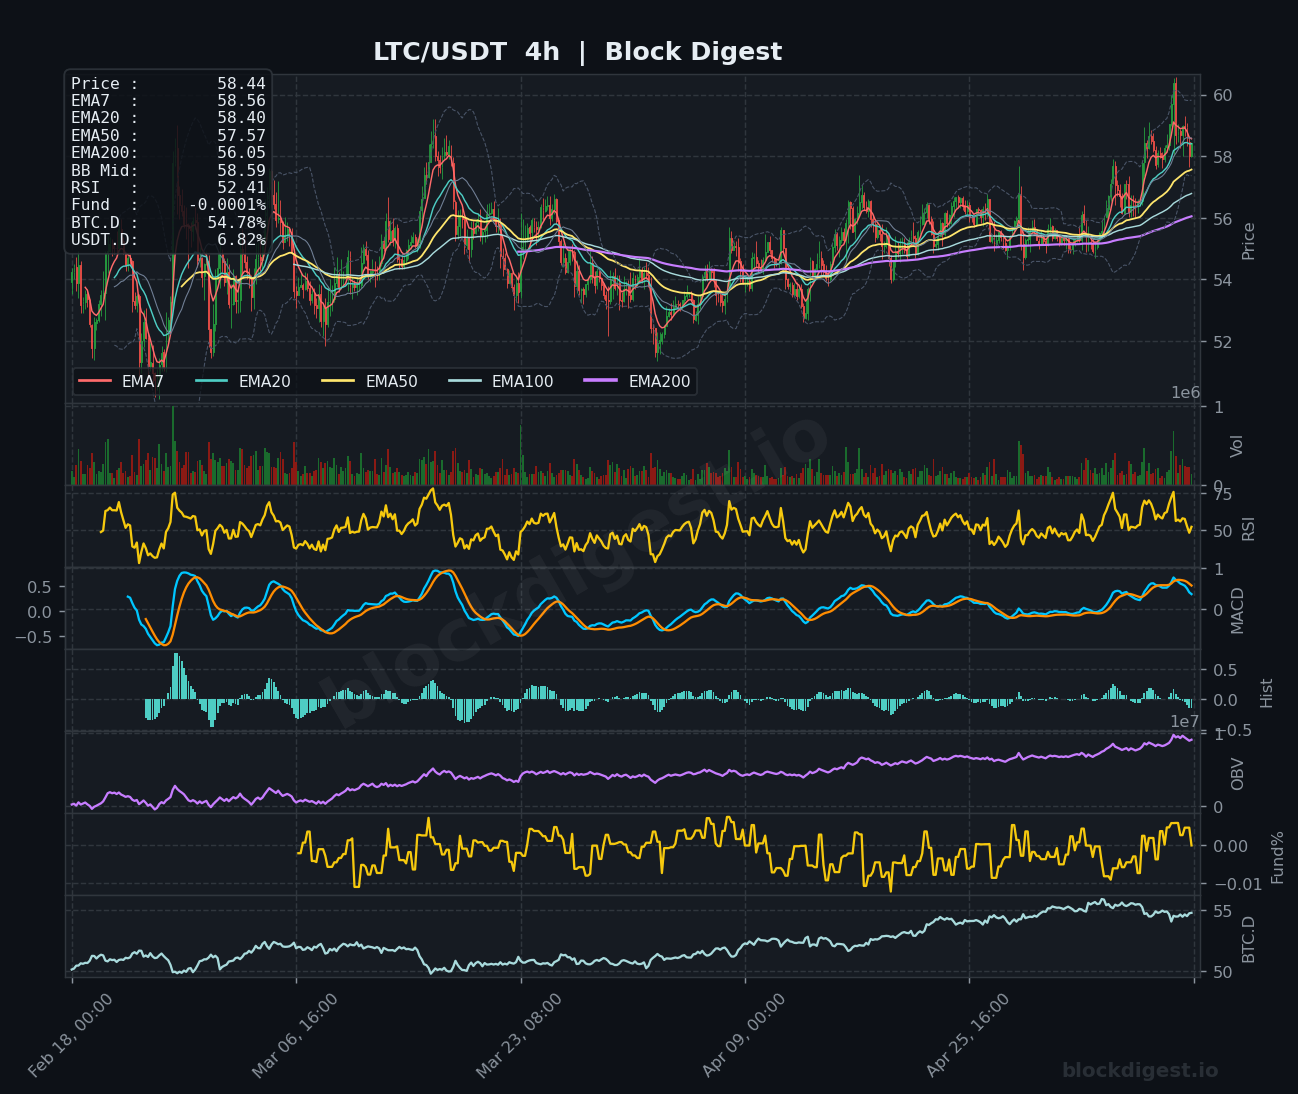
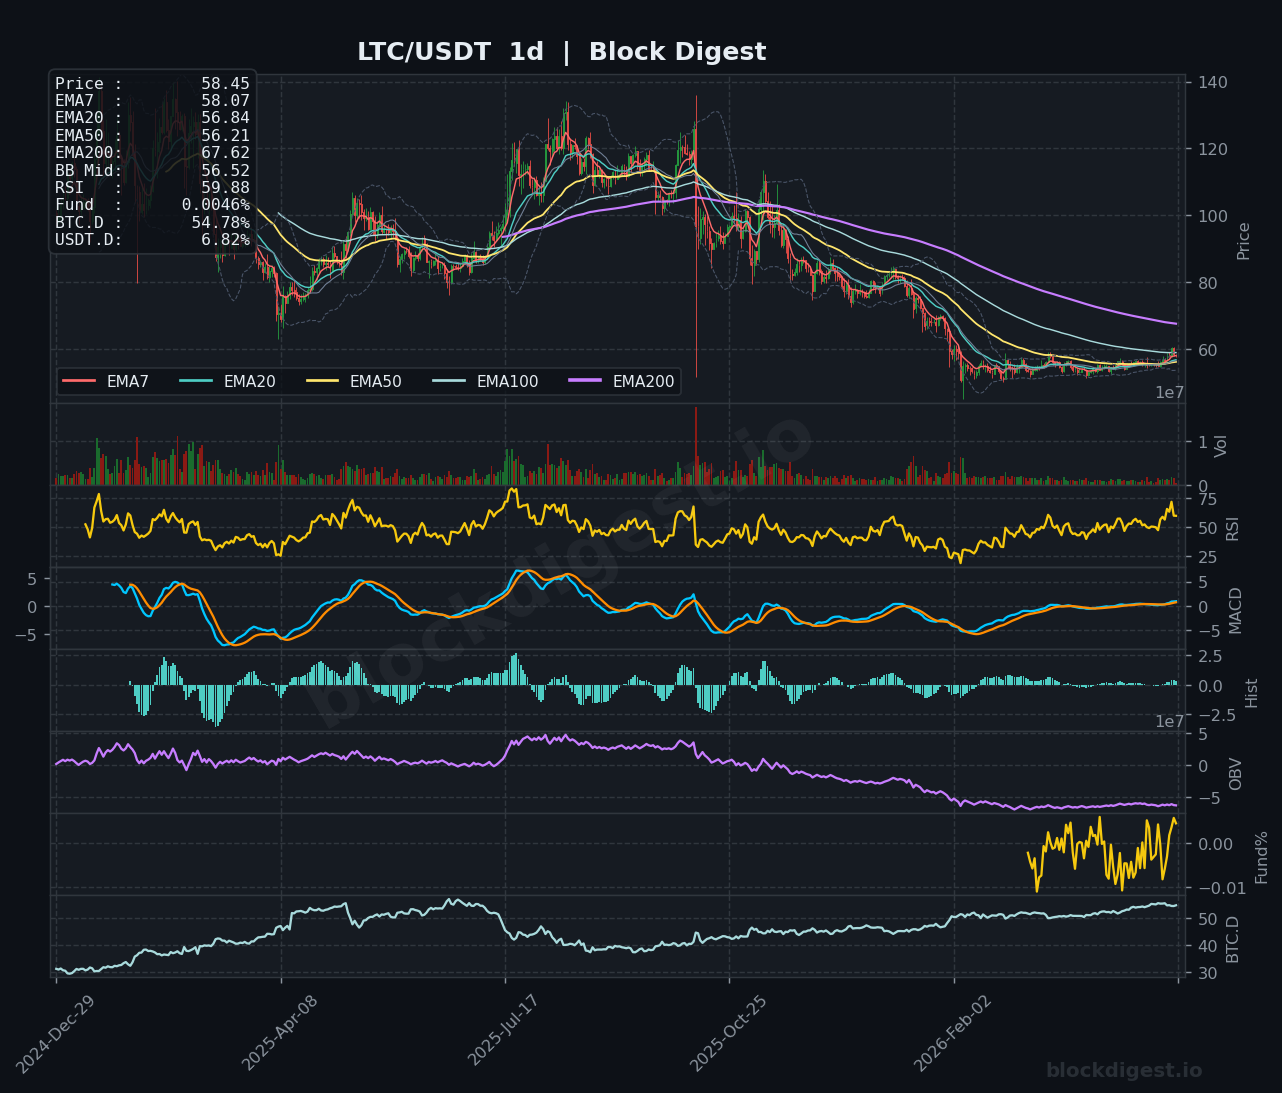
Litecoin (LTC)
Litecoin is trading at $58.44 after rejecting from the $60.50 resistance zone, now consolidating in a narrow range. The RSI at 48.70 (1h) and 52.41 (4h) reflects neutral momentum following the recent pullback from overbought conditions, while the daily RSI at 59.88 suggests the broader trend remains intact. Price is testing support at the EMA20 ($58.45) on the 4-hour chart, a level that has provided reliable support during the recent uptrend. The MACD histogram is turning negative on lower timeframes, indicating short-term bearish pressure, though the alignment of rising EMAs on the daily chart maintains the constructive outlook, with $57.00-57.50 representing key support and $60.50-61.00 as the level to reclaim for continuation.
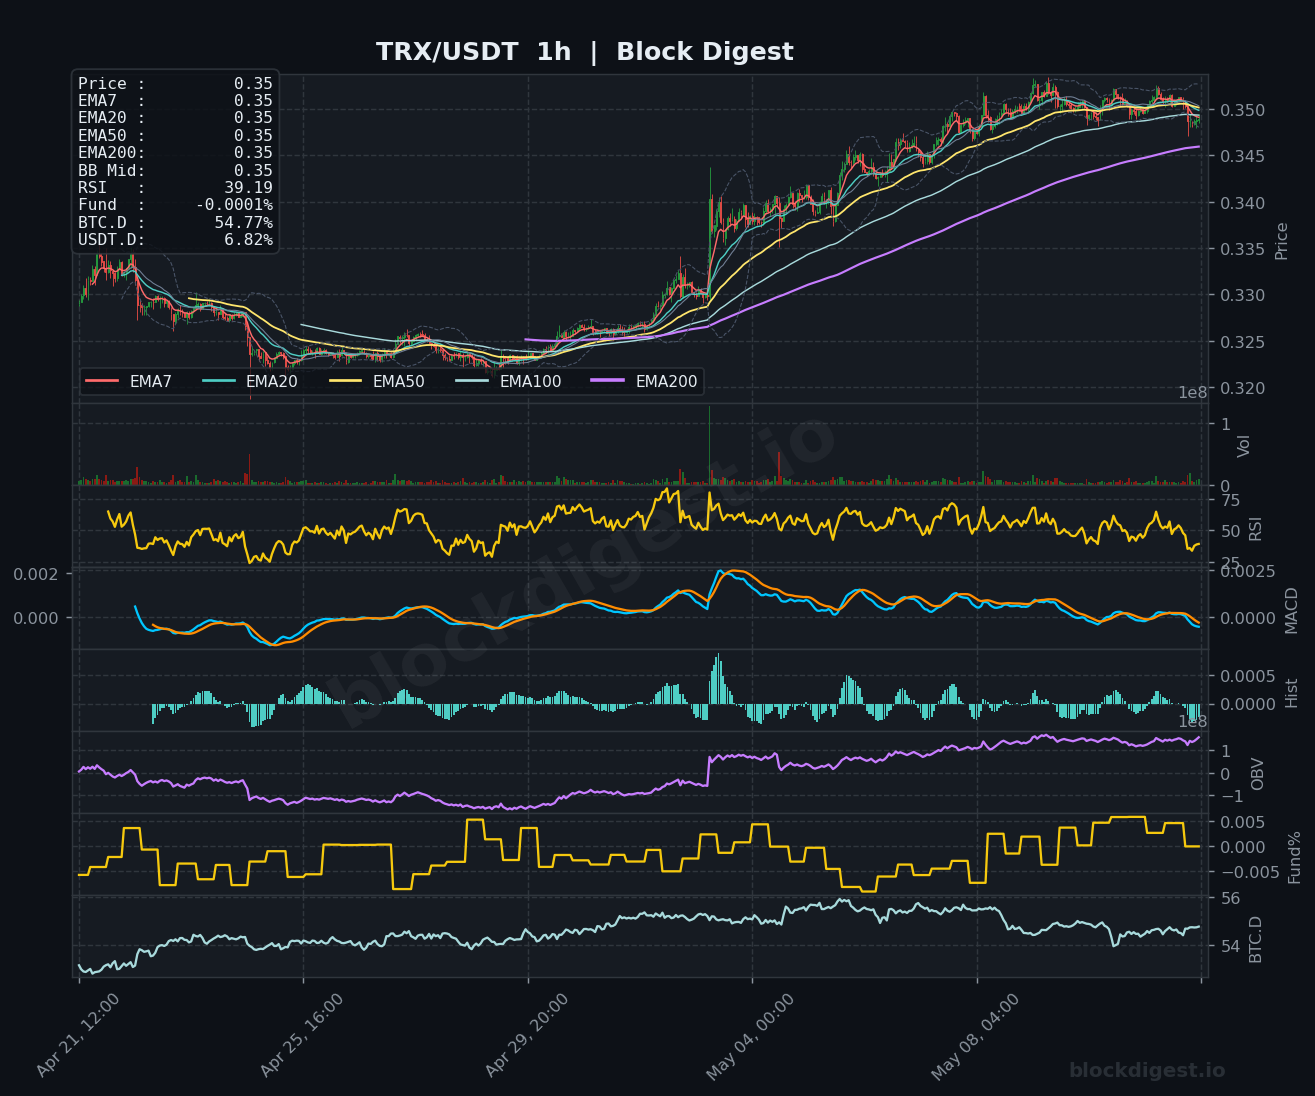
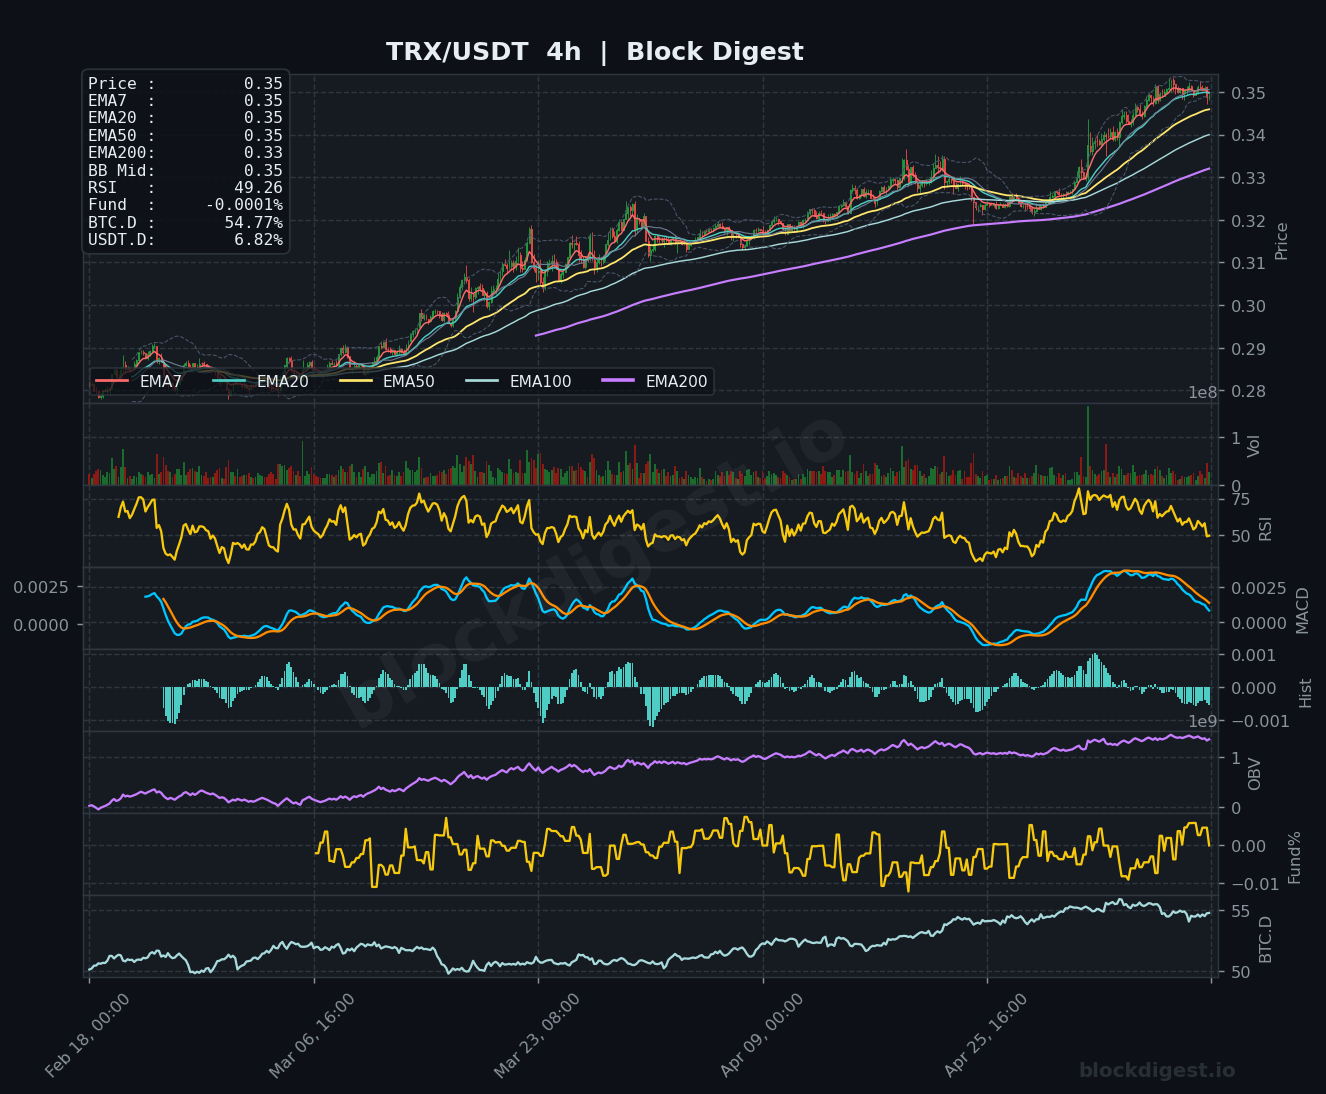
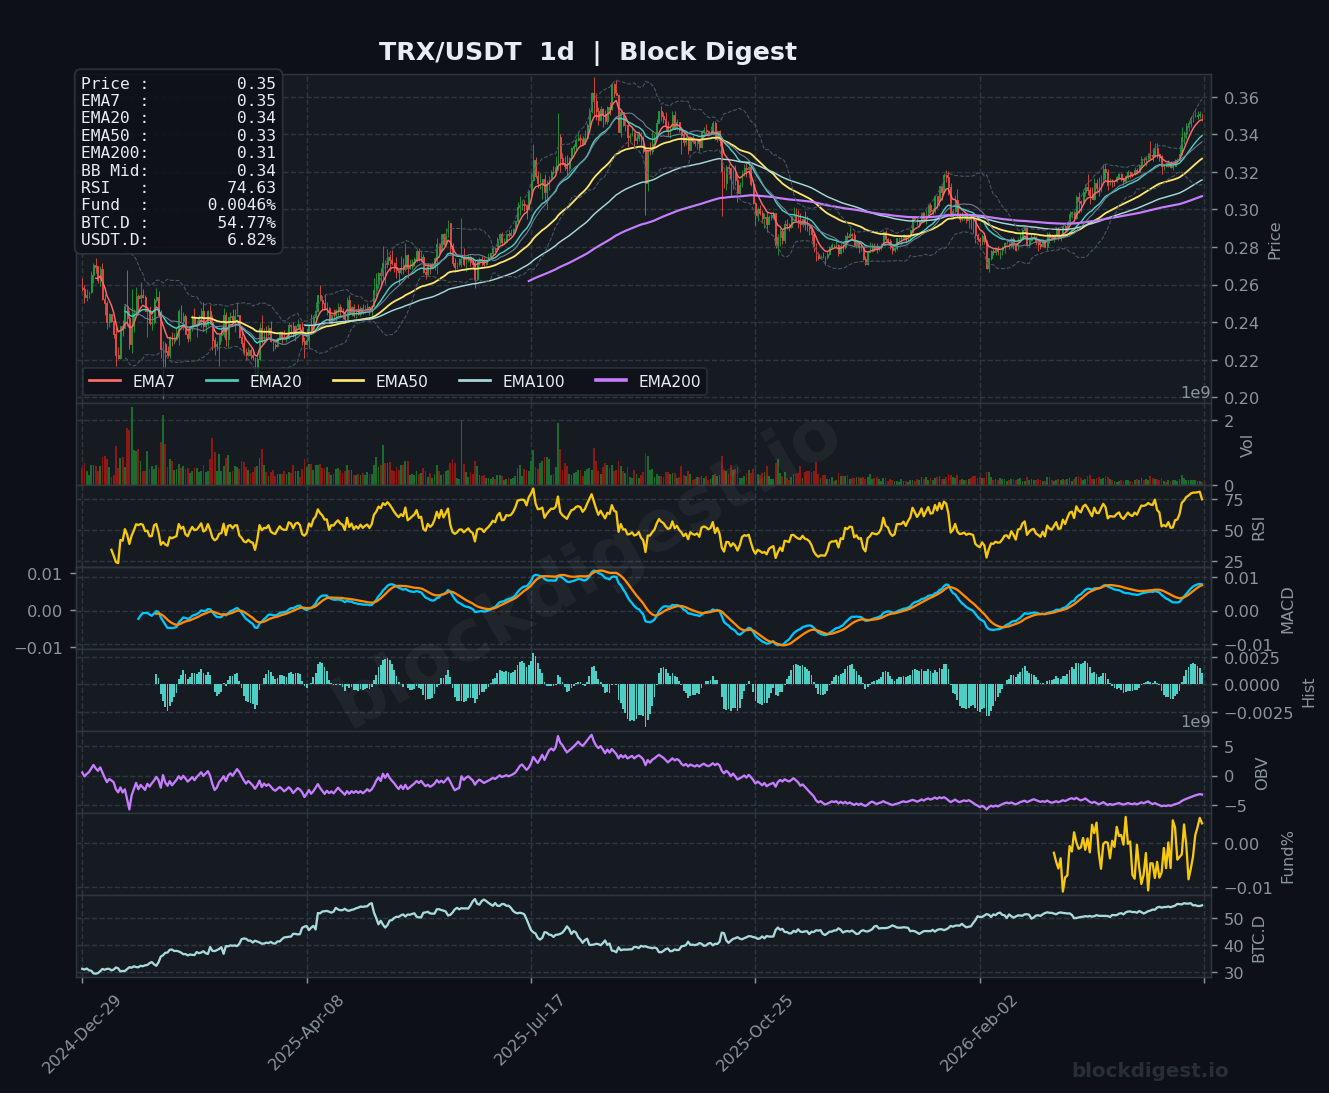
TRON (TRX)
TRON is trading at $0.3500, showing signs of exhaustion after a strong uptrend that carried price from $0.28 to the current levels. The RSI at 39.19 (1h) and 49.26 (4h) indicates cooling momentum, while the elevated daily RSI at 74.63 signals the asset has entered overbought territory and may require consolidation. Price is pulling back from the recent high near $0.3550 and testing the EMA7/EMA20 support cluster around $0.3500, with the MACD histogram turning negative on lower timeframes. The daily chart shows a well-established uptrend with rising moving averages providing support, but the overbought conditions suggest limited upside potential in the immediate term, with $0.3450-0.3500 as critical support and $0.3300 as a deeper retracement level if the correction extends.
Altcoin Outlook
The altcoin market is exhibiting consolidation characteristics after recent volatility, with most major assets testing key support levels following profit-taking. TRX and BNB show the strongest recent performance but are displaying signs of exhaustion with overbought daily RSI readings, while SOL and XRP maintain more balanced technical setups with room for upside. The stable Bitcoin dominance around 54.7% and moderate USDT dominance at 6.82% suggest a neutral macro backdrop where individual coin fundamentals and technical setups will drive performance. Key conditions to watch include whether altcoins can hold their respective EMA support clusters on pullbacks and whether BTC dominance begins trending in either direction—a declining BTC.D would signal renewed altcoin strength, while rising dominance could pressure alternative cryptocurrencies further.
Disclaimer: This analysis is for informational purposes only and does not constitute financial advice. Cryptocurrency markets are highly volatile and unpredictable. All trading decisions should be made based on your own research and risk tolerance. Block Digest is not responsible for any financial losses incurred as a result of acting on this content.