
Market Overview
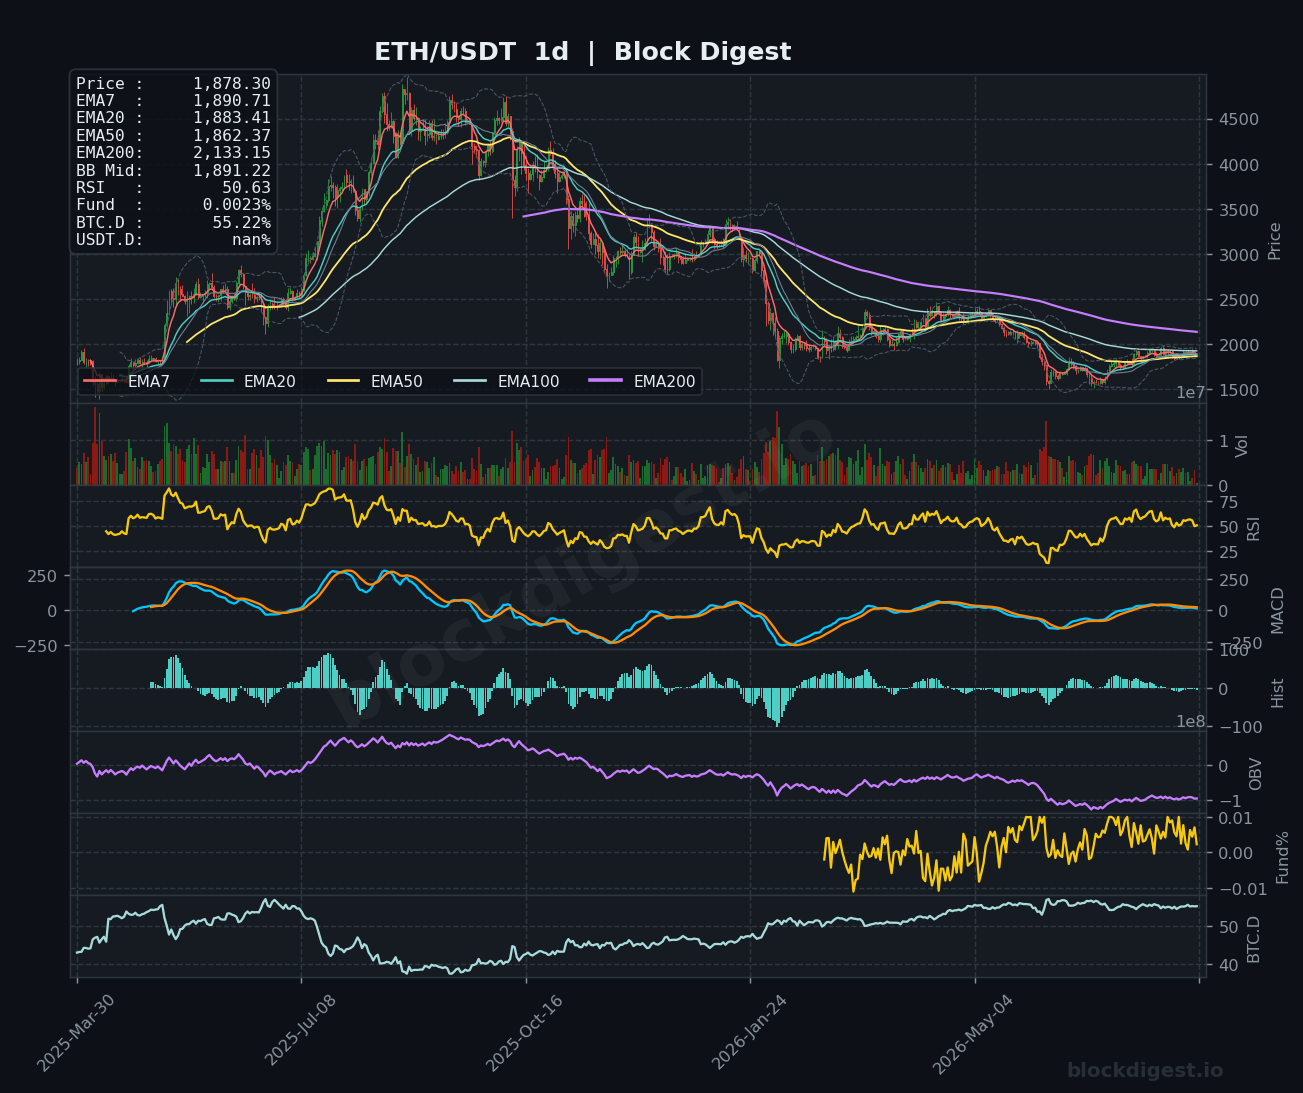
Ethereum is trading at $1,878.30 as of August 11, 2026, sitting in a technically precarious position after a prolonged downtrend from highs above $4,500. On the daily timeframe, price remains well beneath the EMA200 at $2,133.15 — a level that has acted as a formidable overhead ceiling throughout the broader bear structure — while hovering just below the EMA7 ($1,890.71) and EMA20 ($1,883.41), indicating that short-term momentum has softened after a modest recovery attempt. The Bollinger Band midline on the daily sits at $1,891.22, and ETH’s failure to reclaim that level on a closing basis keeps the structure leaning bearish. The dominant daily trend remains downward from the macro perspective, though price has stabilized above the EMA50 ($1,862.37), offering a thin but notable source of near-term support.
Multi-Timeframe Confluence
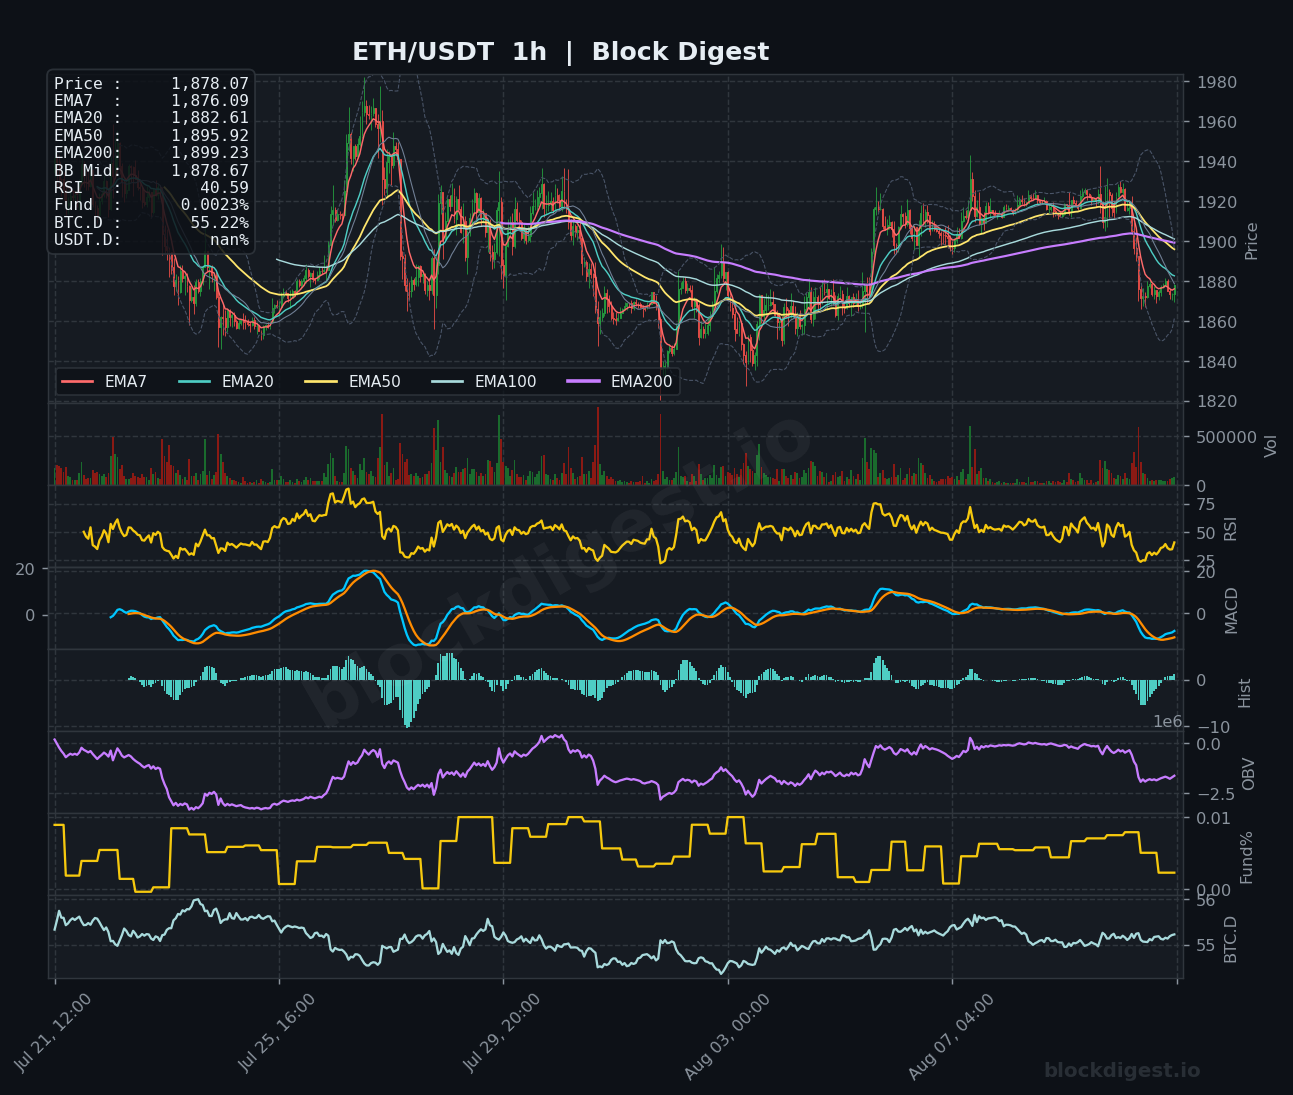
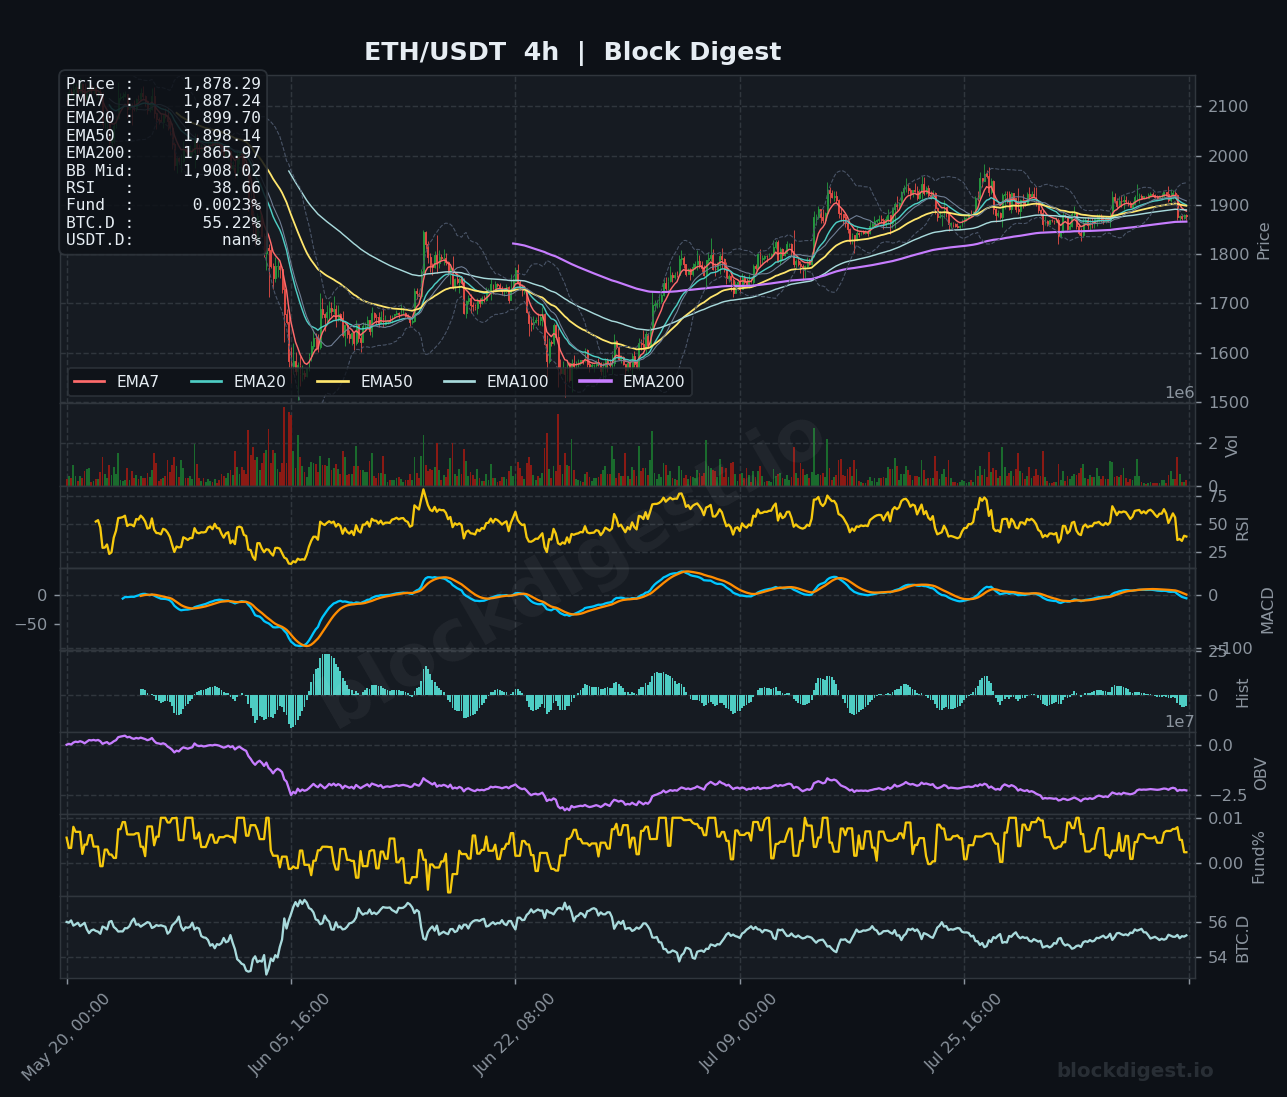
Across all three timeframes, the EMA stack is in a bearish configuration at the higher levels, but the picture is more nuanced on the shorter frames. On the 4-hour chart, price at $1,878.29 is trading beneath the EMA20 ($1,899.70) and EMA50 ($1,898.14), with both acting as converged resistance in the $1,898–$1,900 zone — a cluster that has repeatedly capped recovery attempts. The 1-hour chart reinforces this narrative: price is below the EMA50 ($1,895.92) and EMA200 ($1,899.23), and the short-term EMA7 ($1,876.09) has rolled over, suggesting near-term selling pressure. The one silver lining is that the daily EMA50 near $1,862 aligns closely with recent swing lows, creating a confluent support band between $1,860 and $1,865 that bulls need to defend.
Key Levels to Watch
- Resistance: $1,898–$1,900 — confluent zone where the 4h EMA20, EMA50, and 1h EMA200 converge; consistently rejected on recent bounces
- Resistance: $1,920–$1,930 — recent local high area and upper Bollinger Band region on the 1h chart; would need decisive volume to clear
- Resistance: $2,133 — the daily EMA200, the macro line in the sand separating a cyclical recovery from continued bearish dominance
- Support: $1,862–$1,865 — daily EMA50 and recent consolidation floor; a key structural level bulls must hold
- Support: $1,840–$1,845 — prior swing low and lower Bollinger Band region on the 4h chart; loss of this level would accelerate selling
- Support: $1,780–$1,800 — deeper demand zone and 4h EMA200 ($1,865.97 on the 4h) confluence area; last significant base before a retest of the $1,600s
Momentum & On-Chain Signals
Block Digest’s proprietary BD Pulse Score sits at 41/100 — firmly in bearish territory — and the RSI readings across timeframes confirm this sluggishness: 40.59 on the 1h, 38.66 on the 4h, and 50.63 on the daily. While the daily RSI near the midline suggests the longer-term structure is not yet oversold, the intraday timeframes are trending toward oversold conditions without showing meaningful bullish divergence, which limits the probability of a sharp short-term reversal. On the MACD front, the 4h histogram has flipped negative and the signal line is curling downward from near-zero, a classic early-stage bearish crossover signal. The OBV trend reading of +1 from BD Pulse hints at marginal accumulation on the daily scale, but the 4h and 1h OBV lines are visibly rolling over — a divergence worth monitoring closely, as it suggests volume is not yet supporting a sustained bid.
BTC Dominance & Market Sentiment
BTC dominance holds at 55.22%, a level that has been sustained and gradually rising over recent weeks, signaling continued capital rotation toward Bitcoin at the expense of altcoins including ETH. This dynamic is consistent with the macro context: with Bitcoin trading near $65,000 and drawing institutional attention via the BlackRock ETF narrative, ETH is struggling to attract proportional inflows. Elevated BTC dominance at these levels typically acts as a headwind for ETH outperformance, and until dominance shows a clear topping pattern, ETH/BTC cross strength will likely remain muted.
Risk Scenarios
- Bullish case: A clean reclaim and 4h close above the $1,898–$1,900 resistance cluster, accompanied by rising OBV and a funding rate uptick, would open a path toward $1,930 and potentially the $1,960–$1,980 range where the upper Bollinger Band on the daily sits. Cooler-than-expected CPI data on Wednesday could serve as the macro catalyst needed to ignite this move.
- Bearish case: Failure to hold the daily EMA50 at $1,862 on a closing basis would expose ETH to a retest of the $1,840–$1,845 demand zone, and a breakdown there with expanding volume could trigger a deeper flush toward the $1,780–$1,800 region. A hotter-than-expected CPI print reigniting Fed rate hike expectations would materially increase this probability.
Outlook
ETH is in a cautious, directionless consolidation phase within a broader bearish macro structure, and the near-term bias tilts modestly to the downside given the compressed EMA stack overhead, the sub-40 intraday RSI readings, and the BD Pulse Score of 41 signaling continued bearish conditions. The next 24–48 hours are heavily event-driven: Wednesday’s U.S. CPI report represents the single most important near-term catalyst, and its outcome will likely define whether ETH tests $1,900+ resistance or accelerates toward $1,840 support. The $1,862 daily EMA50 is the critical level to watch — bulls must defend it on daily closes to prevent further structural deterioration. Until ETH can reclaim and sustain above the $1,900 zone, the path of least resistance remains sideways to lower.
Disclaimer: This analysis is for informational purposes only and does not constitute financial advice. Cryptocurrency markets are highly volatile and unpredictable. All trading decisions should be made based on your own research and risk tolerance. Block Digest is not responsible for any financial losses incurred as a result of acting on this content.
Stay Ahead of the Market
Follow BlockDigest for crypto market intelligence, research and real-time updates.


