
Bitcoin
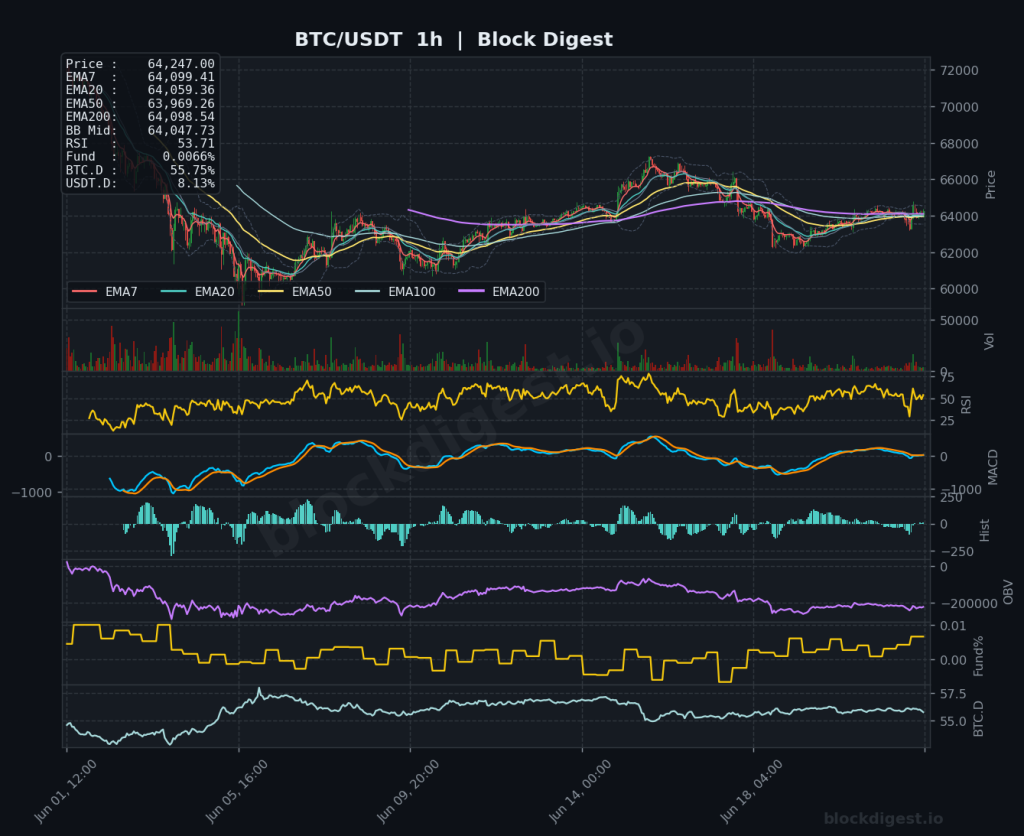
Bitcoin Daily Analysis: Bitcoin at $64K, Below Key EMA Levels
Market Overview Bitcoin is currently trading at $64,247, navigating a structurally challenging environment following a prolonged decline from cycle highs well above $100,000. On the daily timeframe, price remains firmly below the EMA50 ($69,061), EMA200 ($77,767), and EMA20 ($65,339), confirming that the dominant trend is bearish. The daily Bollinger Band midline sits at $63,563, and...

Here’s What Happened in Crypto Today
The crypto market faced a turbulent day on June 21, 2026, as Federal Reserve rate hike signals triggered sharp declines across major cryptocurrencies, while the sector grappled with mounting security concerns highlighted by a significant bridge exploit and a second major hack in weeks. Adding to the headwinds, the Ethereum Foundation disclosed an eighth senior...

Ethereum Daily Analysis: ETH Below EMA20 at $1,732 Amid Downtrend
Market Overview ETH/USDT is currently trading at $1,732.11, sitting in a structurally precarious position on the daily timeframe following a prolonged downtrend from highs above $4,000. Price is trading below the daily EMA20 ($1,768.96), EMA50 ($1,918.88), and far beneath the EMA200 ($2,348.52), confirming that the dominant macro trend remains firmly bearish. On the positive side,...
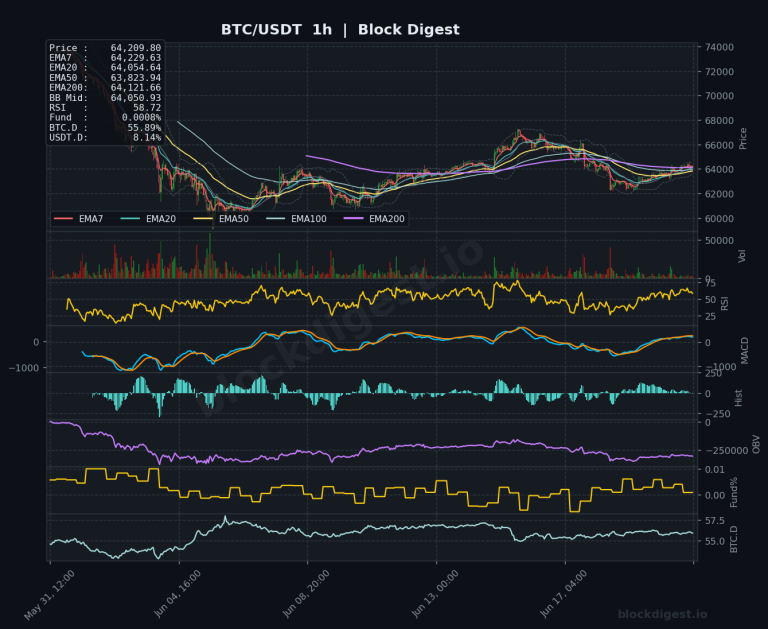
Bitcoin Daily Analysis: Below EMAs, Stabilizing Above Bollinger Midline
Market Overview Bitcoin is currently trading at $64,209.80, navigating a technically precarious zone following a significant multi-month correction from highs near $109,000. On the daily timeframe, price sits below all major EMAs — the EMA20 at $65,544, EMA50 at $69,294, EMA200 at $77,912 — confirming a dominant bearish structure. Price is trading slightly above the...

Fed Rate Hike Signals Send Bitcoin and Ethereum Sharply Lower
Bitcoin and Ethereum have declined sharply since the Federal Reserve concluded its Wednesday meeting with unchanged interest rates but hawkish forward guidance suggesting rate increases could materialize later in 2026. The sell-off underscores how sensitive digital assets have become to monetary policy expectations, with both major cryptocurrencies losing ground as traditional markets repriced the probability...

Here’s What Happened in Crypto Today
Bitcoin experienced significant downward pressure today as geopolitical tensions resurfaced with the collapse of Iran-Israel peace negotiations, while network activity metrics revealed resilience through record data storage adoption. Meanwhile, the digital asset ecosystem faced internal challenges, with XRP holders expressing frustration over Ripple’s strategic priorities and a major digital credit token suffering severe devaluation. Bitcoin...

Bitcoin Network Activity Hits 2026 High on Data Storage Surge
Bitcoin’s network activity has climbed to its highest level of 2026, breaking a seven-month trend despite the cryptocurrency trading under sustained bearish pressure. The surge marks a significant inflection point in on-chain behavior, driven primarily by small-value transactions and protocol-based data storage rather than traditional financial activity. The On-Chain Data Surge CryptoQuant reported that Bitcoin’s...
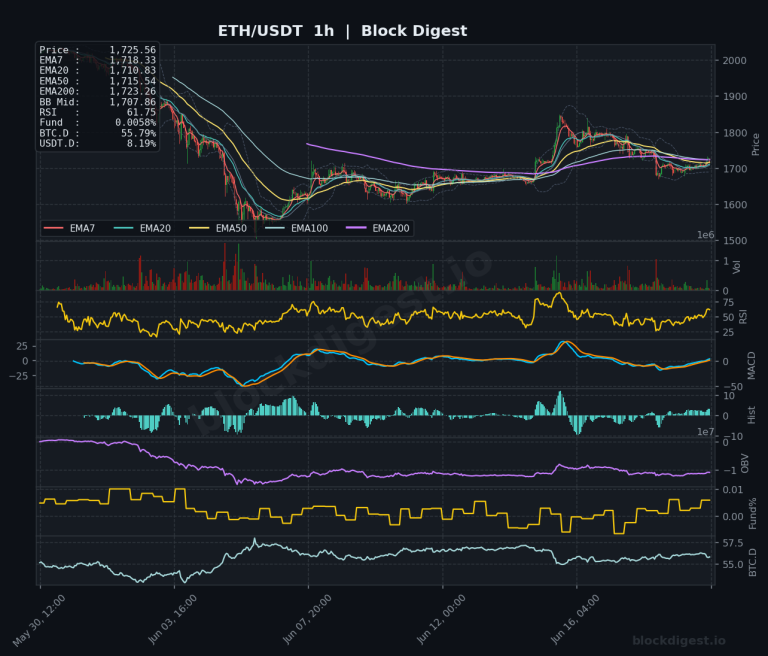
Ethereum Daily Analysis: ETH Trades Below EMA50 Amid Downtrend
Market Overview ETH/USDT is currently trading at $1,725.66, sitting in a precarious position within a prolonged macro downtrend that has erased significant value from the late-2025 highs above $4,000. On the daily timeframe, price is trading well beneath the EMA50 ($1,925.94), EMA200 ($2,355.01), and even the EMA20 ($1,771.48), confirming that the dominant structure remains bearish....

Bitcoin Daily Analysis: Bitcoin Below EMA7 in Bearish Technical Setup
Market Overview Bitcoin is currently trading at $63,699.40, navigating a technically precarious position as price sits below its daily EMA7 ($64,017.91), EMA20 ($65,630.81), EMA50 ($69,480.07), and EMA200 ($78,045.12) — a full bearish EMA stack on the daily timeframe. Price is hugging the lower Bollinger Band region on the daily chart, with the BB Midline at...
Here’s What Happened in Crypto Today
Crypto markets entered a severe downturn on Thursday as the Federal Reserve signaled an unexpectedly hawkish stance that eliminated hopes for interest rate cuts, sending Bitcoin plummeting below $64,000 amid concurrent geopolitical tensions following the collapse of Iran peace negotiations. The sell-off erased weeks of gains across digital assets, while Washington lawmakers intensified efforts to...

Bitcoin Crashes Below $64K as Iran Peace Deal Collapses Amid Geopolitics
Bitcoin plummeted below $64,000 on June 19, 2026, as a scheduled U.S.-Iran peace memorandum signing collapsed following renewed Israeli airstrikes across southern Lebanon. The geopolitical breakdown, once positioned as a major risk-off catalyst that could have supported crypto markets, instead triggered widespread liquidations across digital assets amid a confluence of hawkish Federal Reserve signals and...

Ethereum Daily Analysis: ETH trades below all key moving averages
Market Overview ETH/USDT is currently trading at $1,696.83, positioned well beneath every key moving average across all timeframes — a structurally bearish configuration. On the daily chart, price sits below the EMA7 ($1,722.92), EMA20 ($1,775.02), EMA50 ($1,933.59), and the distant EMA200 ($2,361.90), confirming that the dominant trend remains firmly to the downside. The Bollinger Band...