Bitcoin Daily Analysis: Bitcoin Below All EMAs at $62,690
Market Overview
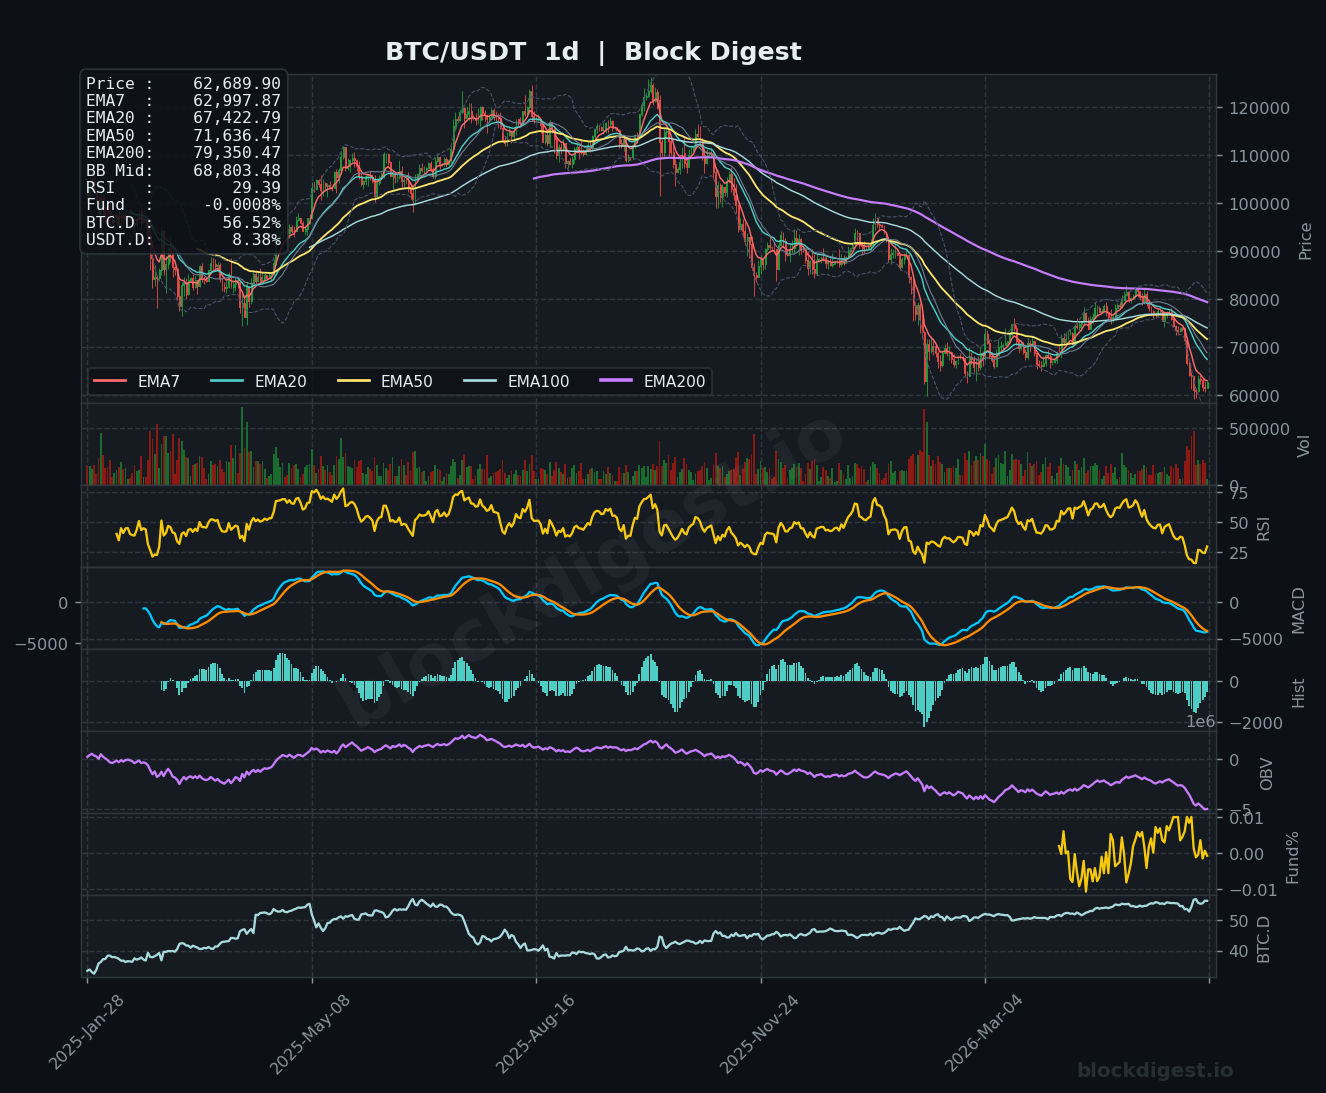
Bitcoin is trading at $62,690 as of June 11, 2026, sitting in deeply bearish macro territory following a prolonged decline from its all-time high above $123,000 reached in mid-2025. On the daily timeframe, price is trading well below all major EMAs — the EMA7 at $62,998, EMA20 at $67,423, EMA50 at $71,636, and EMA200 at $79,350 — confirming a fully bearish EMA stack with no near-term reclamation in sight. Price is also far below the daily Bollinger Band midline at $68,803, indicating sustained downside pressure. The current level represents a loss of nearly 50% from the 2025 peak, and multiple valuation gauges are signaling a deep bear-market zone consistent with historical capitulation ranges.
Multi-Timeframe Confluence
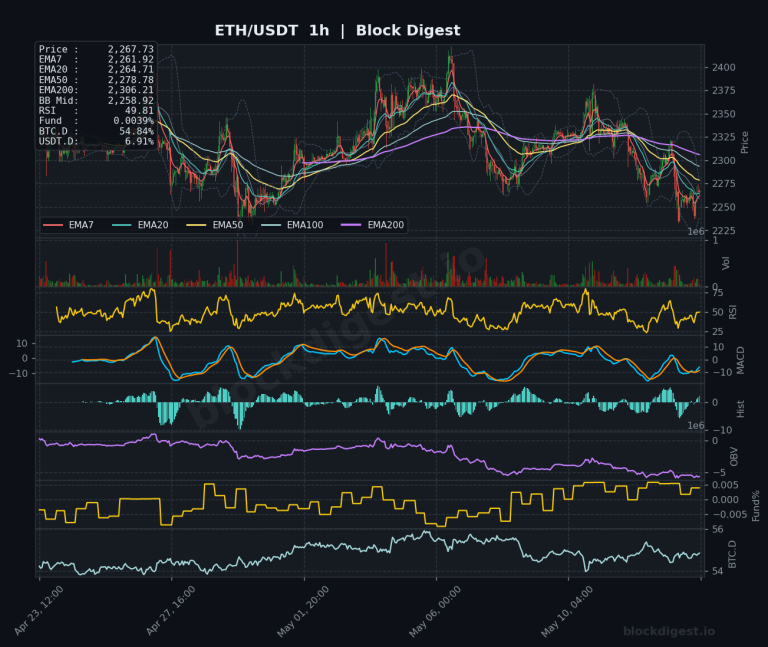
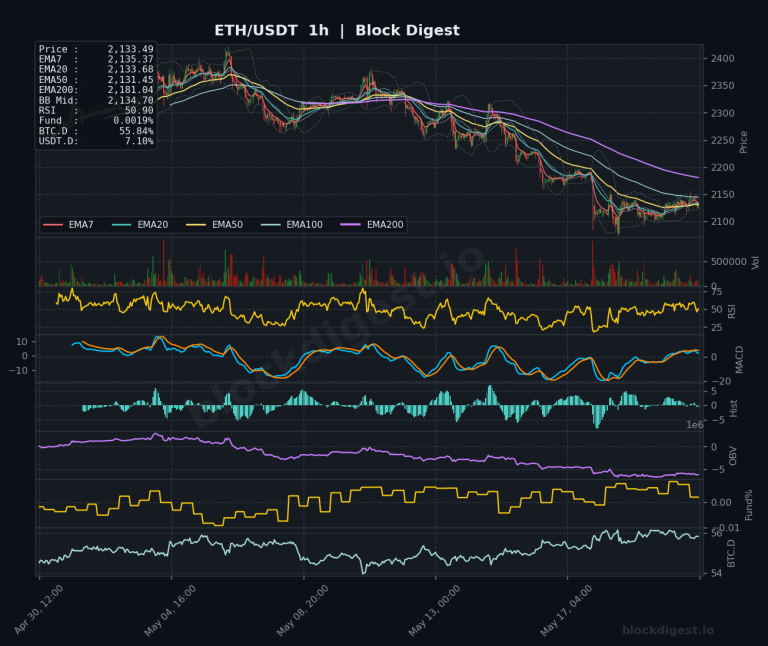
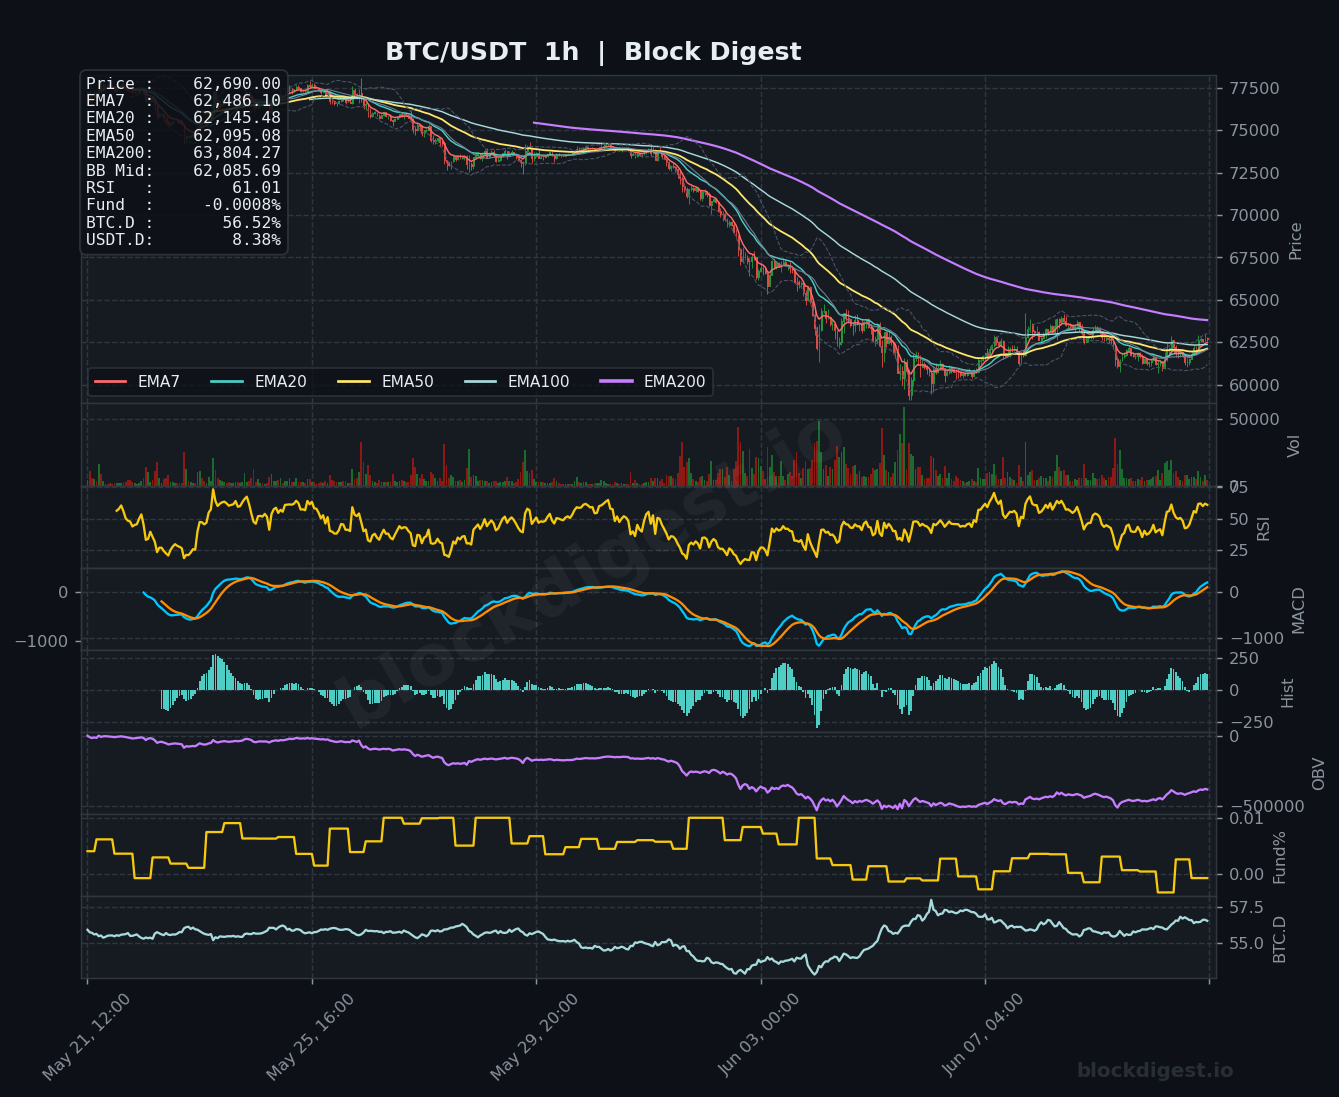
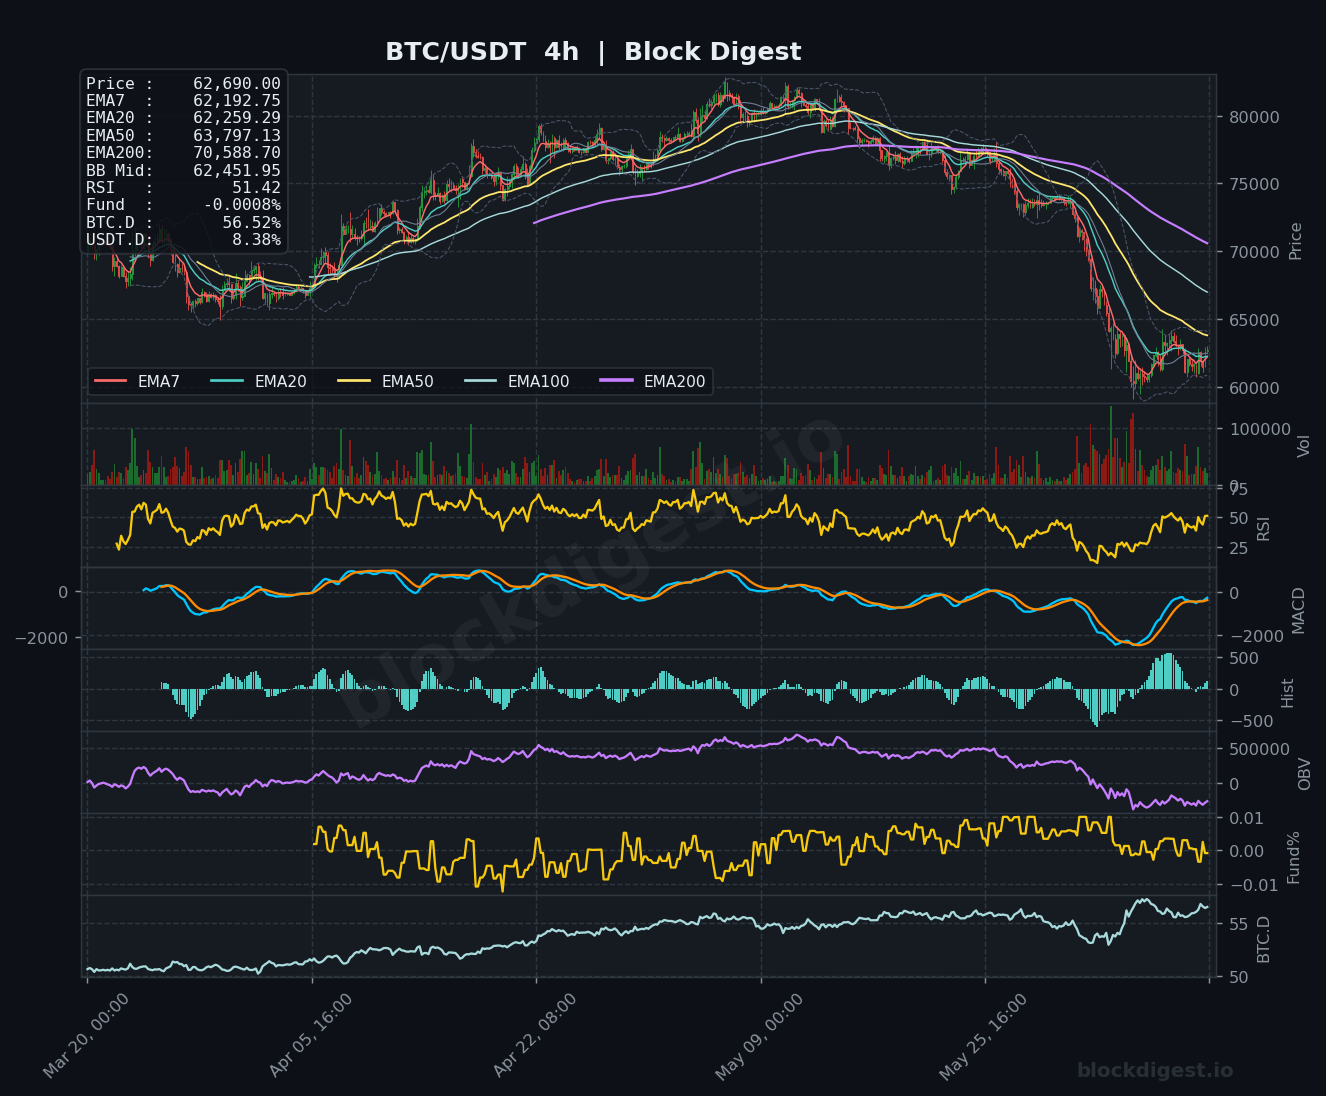
On the 1-hour chart, price has stabilized slightly above its short-term EMAs (EMA7: $62,486, EMA20: $62,145, EMA50: $62,095), suggesting tentative near-term stabilization after the sharp multi-week decline. However, the 1-hour EMA200 at $63,804 is acting as immediate overhead resistance, and any recovery attempt must first clear that level convincingly. The 4-hour chart tells a more concerning story — price remains below the EMA50 at $63,797 and dramatically below the EMA200 at $70,589, with the EMA structure in a full bearish cascade. All three timeframes align on the same conclusion: this is a bear market bounce environment, not a structural reversal, and short-term relief should be treated with caution against the dominant downtrend.
Key Levels to Watch
- Resistance: $63,804 — the 1-hour EMA200, which has been acting as a dynamic ceiling during the recent consolidation and represents the first meaningful overhead barrier
- Resistance: $65,000–$65,500 — a prior structural support zone that has now flipped to resistance, coinciding with the descending 4-hour Bollinger Band upper band region
- Resistance: $67,422 — the daily EMA20, which would need to be reclaimed before any medium-term bullish thesis becomes credible
- Support: $61,500–$62,000 — near-term horizontal support cluster where price found a bottom in recent sessions, reinforced by the 1-hour BB midline at $62,086
- Support: $60,000 — major psychological level and a potential demand zone that aligns with the recent swing low visible on the 4-hour chart
- Support: $58,000–$58,500 — deeper structural support, representing an area of prior consolidation and a potential target if $60,000 fails on high volume
Momentum & On-Chain Signals
The daily RSI at 29.39 is firmly in oversold territory, a level historically associated with either near-term bounces or prolonged bear-market grinding — a pattern warned about in current analyst commentary. The 1-hour RSI has recovered to 61.01, suggesting short-term momentum has shifted modestly to the upside, while the 4-hour RSI at 51.42 reflects a neutral-to-slightly-positive reading, indicating the immediate selling pressure has eased. The daily MACD remains deeply negative with both lines below zero and the histogram printing sustained red bars, confirming macro bearish momentum has not reversed. OBV on both the 4-hour and daily charts is trending firmly downward, reflecting consistent distribution rather than accumulation — a bearish divergence against the slight price stabilization seen on the 1-hour chart. The funding rate at -0.0008% is mildly negative, suggesting a slight lean toward short positioning, which could fuel a short squeeze if positive catalysts emerge.
BTC Dominance & Market Sentiment
BTC dominance sits at 56.52%, a historically elevated reading that indicates capital is remaining concentrated in Bitcoin rather than rotating into altcoins — a classic bear-market flight-to-relative-safety dynamic within crypto. USDT dominance at 8.38% reflects ongoing risk-off sentiment with a notable portion of market participants sitting in stablecoins, further compressing liquidity available for BTC price support. The combination of high BTC.D and elevated USDT.D confirms the broader market remains in a defensive posture, consistent with the bearish macro backdrop amplified by weakening ETF flows and dormant corporate treasury buying.
Risk Scenarios
- Bullish case: A decisive hourly close above the EMA200 at $63,804, followed by reclamation of the $65,000–$65,500 resistance zone on above-average volume, could trigger a short-squeeze rally targeting $67,422 (daily EMA20). Sustained improvement in ETF inflow data or a softer-than-expected U.S. CPI print could serve as the macro catalyst needed to flip short-term sentiment.
- Bearish case: Failure to hold the $61,500 support cluster, particularly on a daily close below $60,000, would signal a resumption of the primary downtrend and open a path toward the $58,000–$58,500 demand zone. Continued ETF outflows combined with deteriorating macro conditions would reinforce this scenario, with the daily RSI potentially entering a prolonged oversold grind rather than a sharp reversal.
Outlook
The overall directional bias remains bearish on the macro timeframe, with Bitcoin deeply entrenched below all major daily EMAs and OBV confirming sustained distribution since the 2025 peak. The near-term picture offers a sliver of cautious optimism — the 1-hour structure has stabilized, the daily RSI is oversold, and mildly negative funding rates reduce aggressive long liquidation risk. The critical triggers to watch over the next 24–48 hours are the U.S. inflation data release, which could meaningfully shift risk appetite, and whether price can reclaim and hold the $63,804 level (1-hour EMA200). A failure at that level keeps the path of least resistance pointed toward $60,000 and below, while a clean breakout above $65,000 would begin to challenge the bearish thesis — though meaningful structural repair would require reclaiming the daily EMA20 at $67,422 at minimum.
Disclaimer: This analysis is for informational purposes only and does not constitute financial advice. Cryptocurrency markets are highly volatile and unpredictable. All trading decisions should be made based on your own research and risk tolerance. Block Digest is not responsible for any financial losses incurred as a result of acting on this content.