Weekly Market Overview
Bitcoin enters the week of August 10, 2026 trading around $65,173, consolidating within a compressed range after a prolonged corrective phase from the all-time high territory above $100,000. The current weekly candle structure reflects indecision, with price squeezed between short-term EMAs and struggling to establish directional conviction. After a sharp multi-month decline from peak levels, BTC has been attempting to stabilize in the low-to-mid $60,000s, forming what appears to be a base-building phase rather than an impulsive recovery. The broader weekly context remains corrective, and bulls have yet to produce the kind of volume-backed breakout needed to shift the macro narrative.
Higher Timeframe Structure
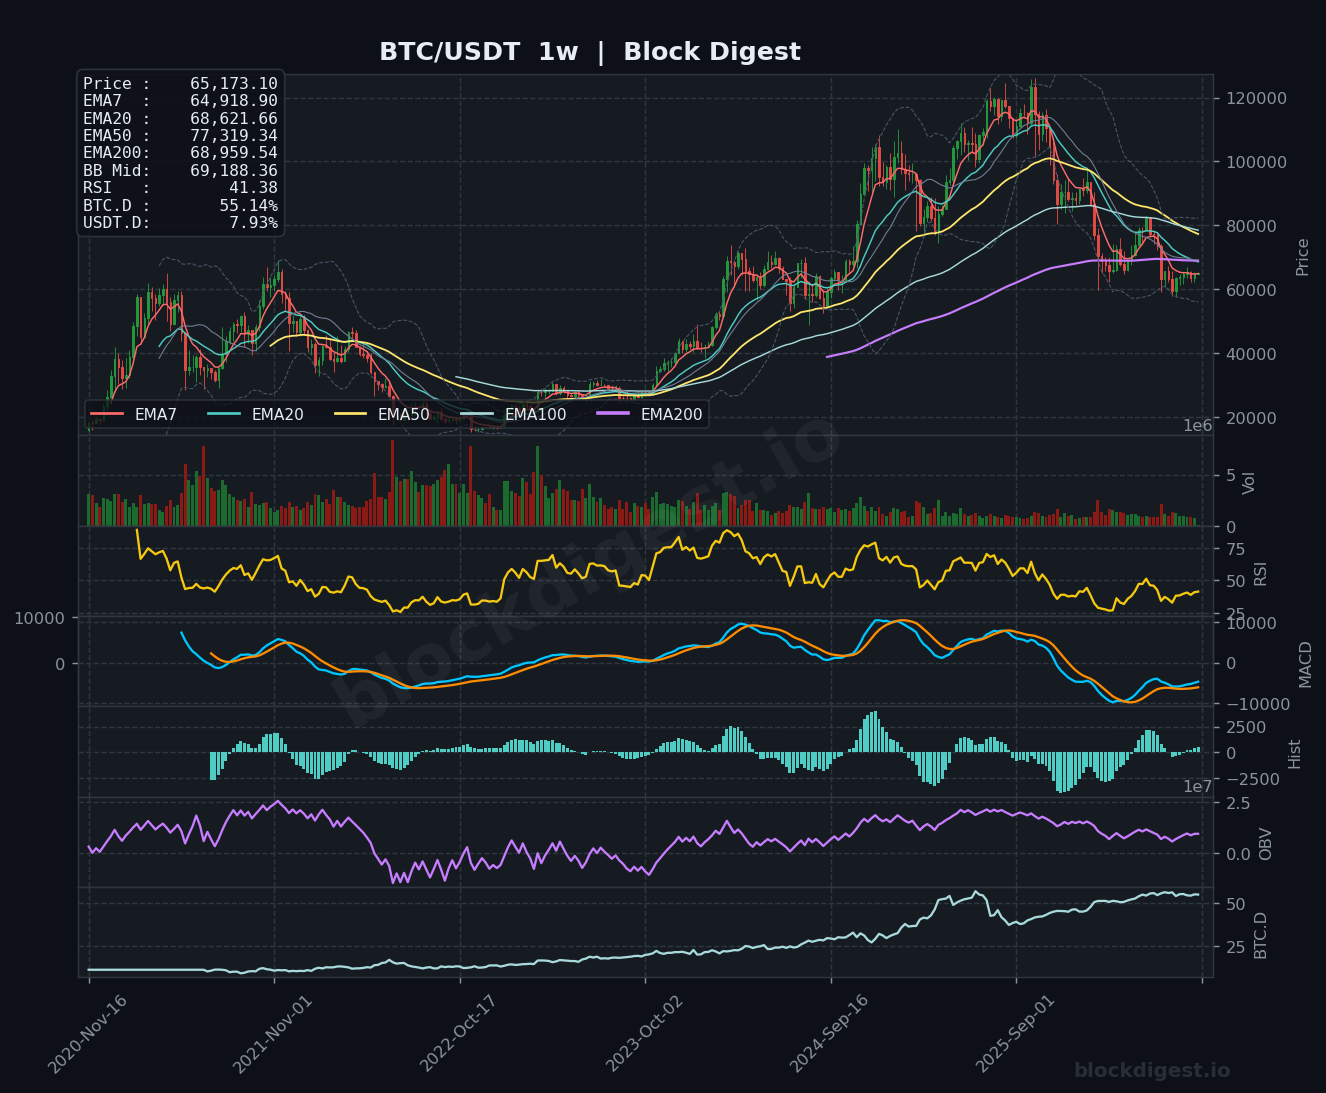
On the weekly chart, the EMA alignment remains overtly bearish — price is trading well below the EMA20 ($68,621), EMA50 ($77,319), and EMA200 ($68,959), with only the EMA7 ($64,918) in close proximity to spot price. The weekly Bollinger Band midline sits at $69,188, acting as overhead resistance that BTC has repeatedly failed to reclaim. This configuration mirrors the 2022 bear market structure, where price spent months consolidating beneath stacked EMA resistance before a meaningful directional move materialized. The weekly RSI of 41.58, as tracked by our BD Pulse indicator, sits in bearish-neutral territory — not yet at capitulation lows, but firmly below the 50 midline that has capped every recovery attempt in this phase.
Multi-Timeframe Confluence
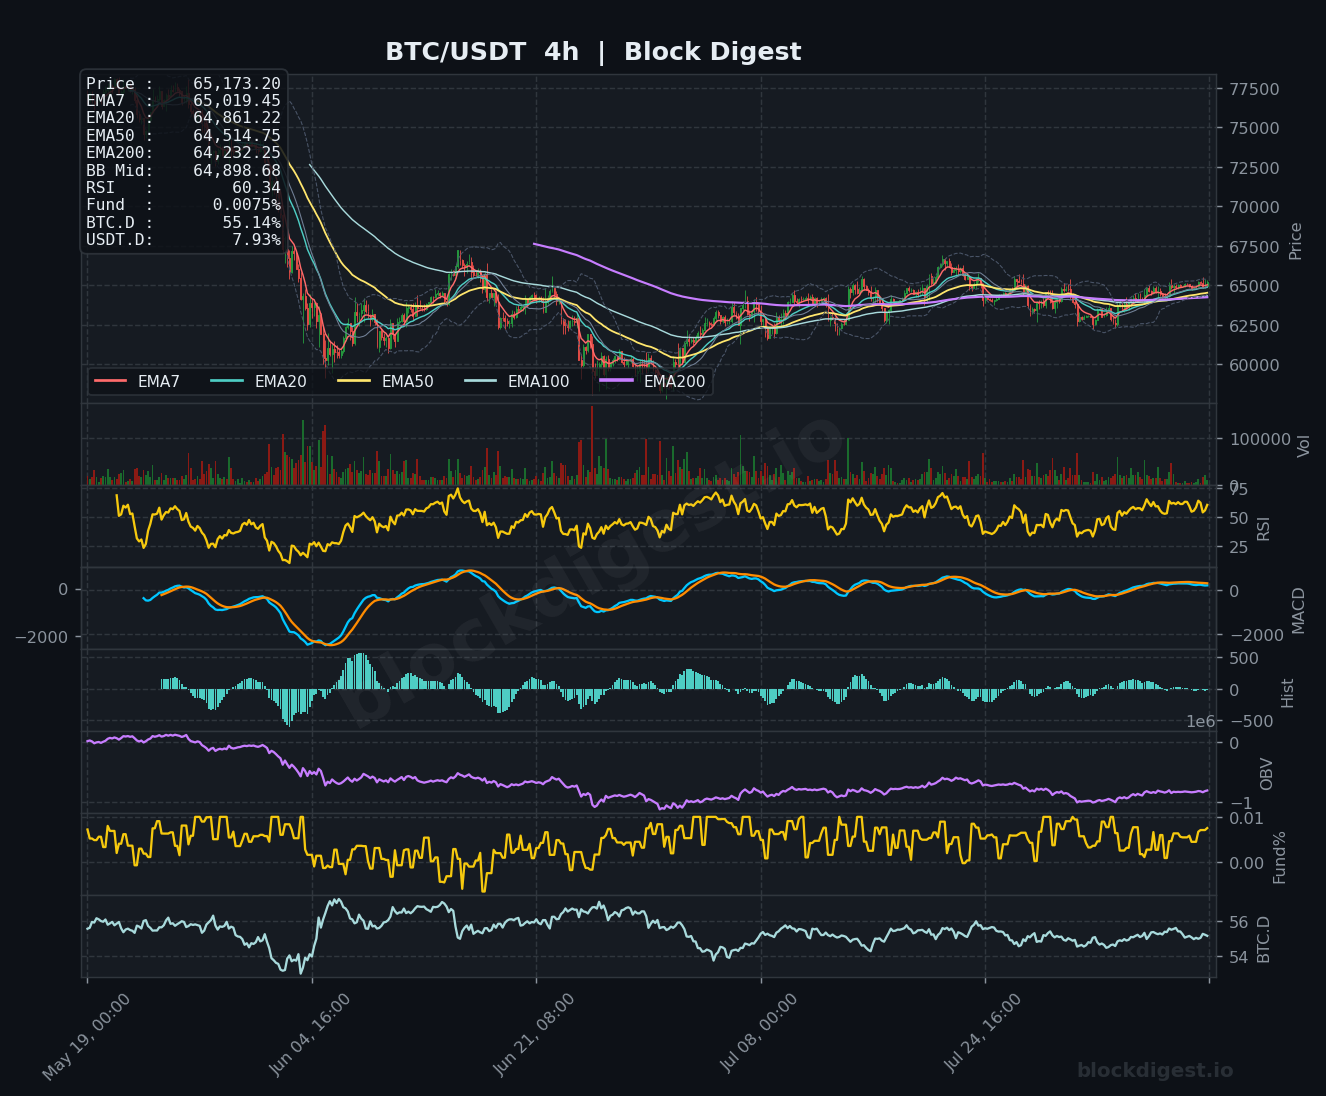
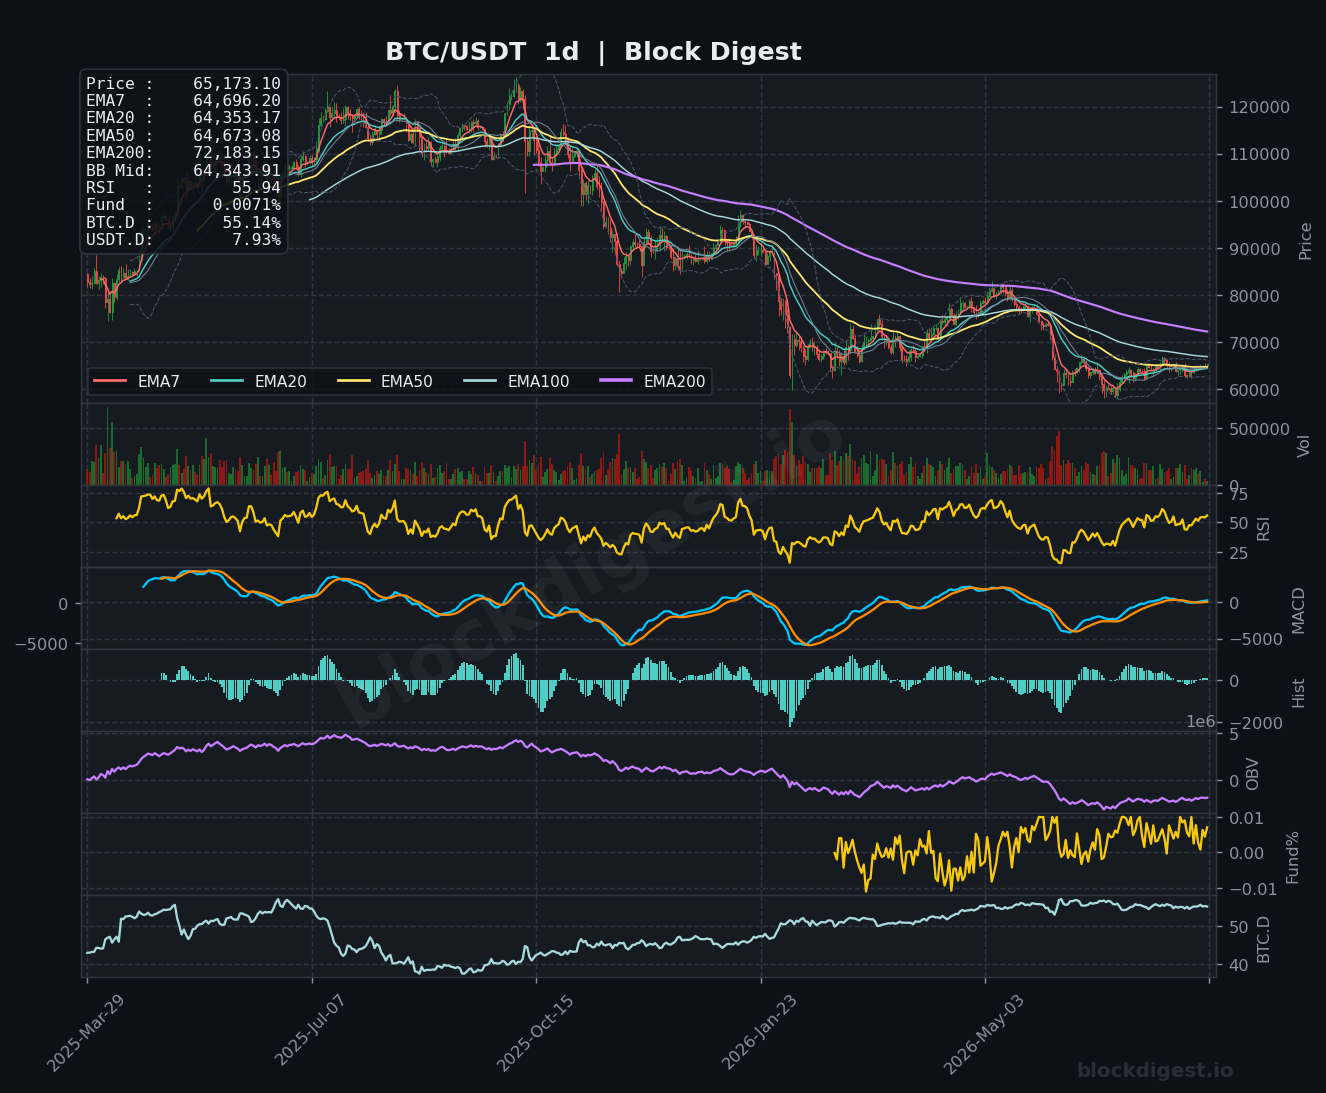
Across timeframes, the picture is one of compressed, low-conviction ranging rather than trend establishment in either direction. On the daily chart, price has been coiling between approximately $62,000 and $67,500, with EMAs tightly bunched near $64,000–$64,700 — a setup that historically precedes an expansion move. The 4-hour timeframe shows a marginally more constructive short-term picture, with price above all key 4h EMAs and RSI holding near 60, suggesting intraweek momentum has leaned bullish, but this has not yet translated into a meaningful daily or weekly trend shift. The $64,800–$65,000 zone represents strong multi-timeframe confluence, serving as both the 4h BB midline and a critical daily support/resistance pivot.
Key Weekly Levels
- Weekly Resistance: $67,500 — recent swing high and daily EMA200 rejection zone; $68,621 — weekly EMA20, a level bulls must reclaim to signal trend recovery; $69,188 — weekly Bollinger Band midline, macro decision point
- Weekly Support: $63,000–$63,500 — near-term demand cluster and lower consolidation boundary; $60,000–$60,500 — psychological level and prior capitulation low tested multiple times; $57,000–$58,000 — structural weekly support from the 2024 accumulation range
Momentum & Volume Analysis
Our BD Pulse Score sits at 39/100, firmly in bearish territory, underscoring that momentum has not meaningfully recovered despite the short-term stabilization in price. Weekly MACD remains in negative territory with the signal line and MACD line both below zero, though the histogram compression suggests the bearish impulse is losing steam — a potential early sign of exhaustion rather than reversal. The OBV trend on the weekly timeframe has been declining since the all-time high, and while the 4h OBV shows marginal stabilization recently, there is no confirmed accumulation signal at macro scale. Funding rates remain low and slightly positive at +0.0048%, consistent with a market that is neither aggressively long nor in panic — a neutral-to-cautious positioning that leaves room for a squeeze in either direction without the overhang of excessive leverage.
BTC Dominance & Altcoin Implications
BTC dominance at 55.17% continues to hold elevated ground, reflecting ongoing capital rotation out of altcoins and into Bitcoin as the relative safe haven within the crypto ecosystem. USDT dominance at 7.93% suggests a meaningful portion of market participants remain in stablecoins, which could provide dry powder for a BTC recovery but equally signals persistent risk-off sentiment. Until BTC dominance shows a decisive rollover — typically a signal that capital is rotating back into altcoins — the broader altcoin market is unlikely to see sustained outperformance, and BTC will remain the market’s center of gravity.
Risk Scenarios
- Bull case: A weekly close above $67,500 with expanding volume would open a path toward the weekly EMA20 at $68,621 and the BB midline at $69,188. Sustained reclaim of the $68,000–$69,000 zone could trigger a short squeeze given the Long/Short account ratio of 1.12, where marginal shorts become vulnerable. Weekly target on a confirmed breakout extends toward $72,000–$75,000.
- Bear case: Failure to hold $63,000 on a weekly closing basis would signal that the current consolidation is distribution rather than accumulation. A breakdown below $60,000 would likely accelerate selling pressure toward the $57,000–$58,000 structural support zone, potentially retesting the cycle lows seen earlier in 2026.
Weekly Outlook
The directional bias for the week of August 10 is cautiously neutral with a slight bearish lean, driven by the weight of the macro EMA structure and the BD Pulse Score of 39 signaling that underlying momentum has not yet turned constructive. The $65,000–$65,500 zone is the immediate battleground — bulls need to defend this level on any pullback while building toward a test of $67,500. Key catalysts to watch include any macro risk-on/risk-off triggers from traditional markets, as BTC has shown increased sensitivity to equity sentiment in this phase. The Long/Short ratio of 1.12 suggests the market is modestly leaning long, meaning a surprise flush to $63,000 could trigger meaningful liquidations and reset the setup more cleanly for bulls. Overall, this week shapes up as a pivotal inflection point — the range must eventually resolve, and the quality of any breakout or breakdown candle will be critical in defining whether BTC is entering a recovery phase or heading into another leg lower.
Disclaimer: This analysis is for informational purposes only and does not constitute financial advice. Cryptocurrency markets are highly volatile and unpredictable. All trading decisions should be made based on your own research and risk tolerance. Block Digest is not responsible for any financial losses incurred as a result of acting on this content.
Stay Ahead of the Market
Follow BlockDigest for crypto market intelligence, research and real-time updates.