Altcoin Daily Analysis: BTC Dominance 56.55%, Altcoin Distribution Pressure
Market Context
The broader altcoin market is showing clear signs of sustained distribution pressure as BTC dominance holds elevated at 56.55%, continuing to absorb liquidity away from the alt complex. USDT dominance at 8.32% reflects a meaningful degree of risk-off positioning that has yet to fully unwind, suggesting that capital has rotated to the sidelines rather than rotating between assets. Across the six coins analyzed today, daily RSI readings are uniformly depressed — several approaching or breaching oversold territory — pointing to a market that remains in a corrective phase with no decisive macro catalyst for a broad reversal in sight.
Solana (SOL)
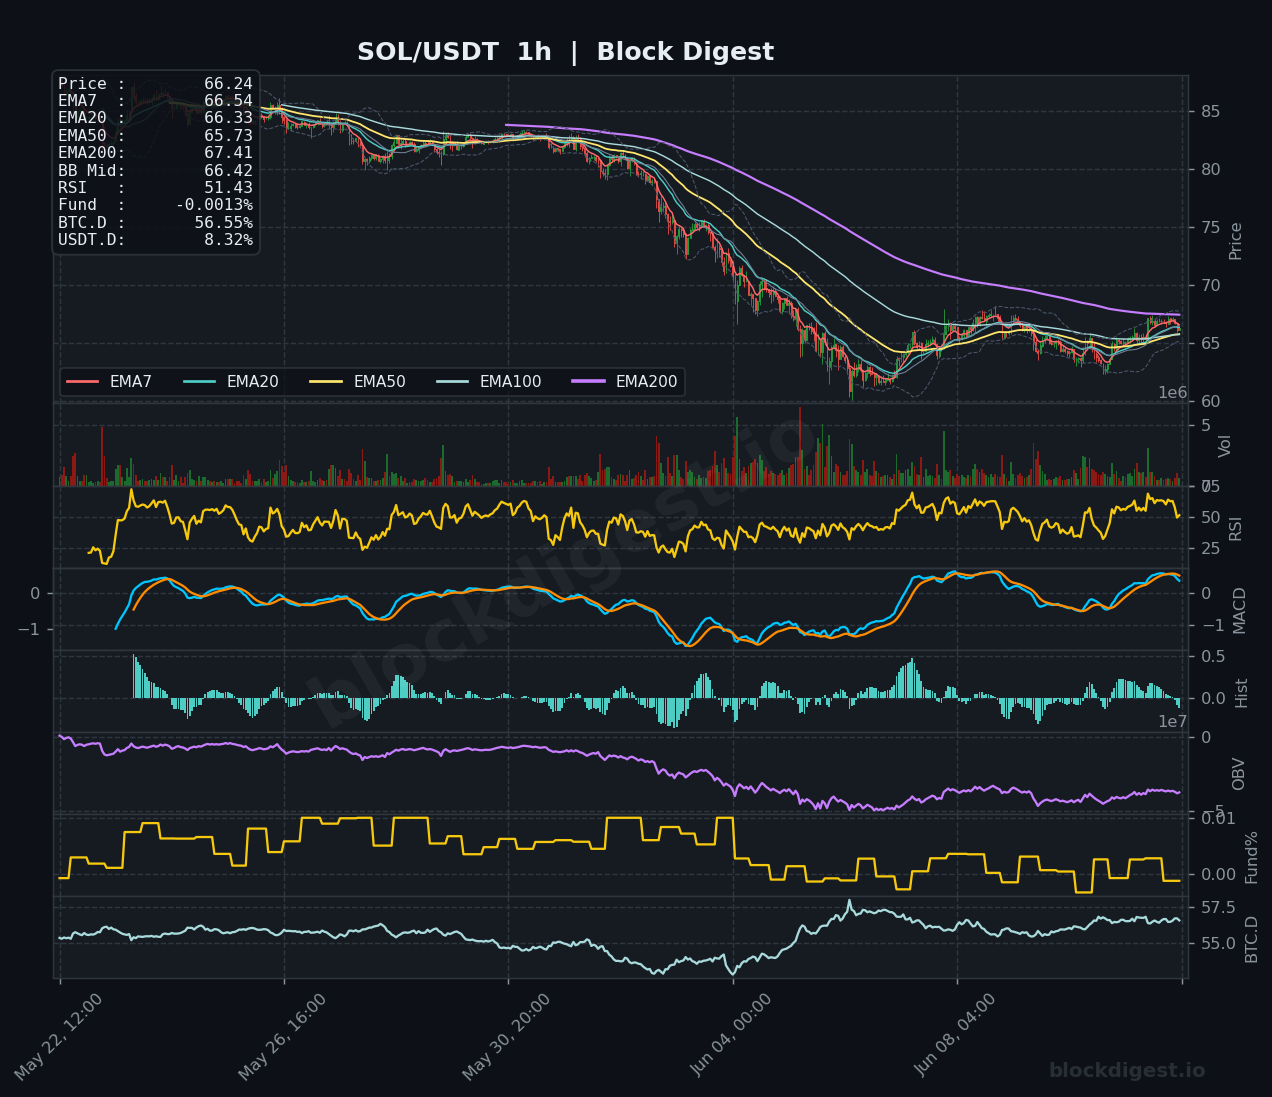
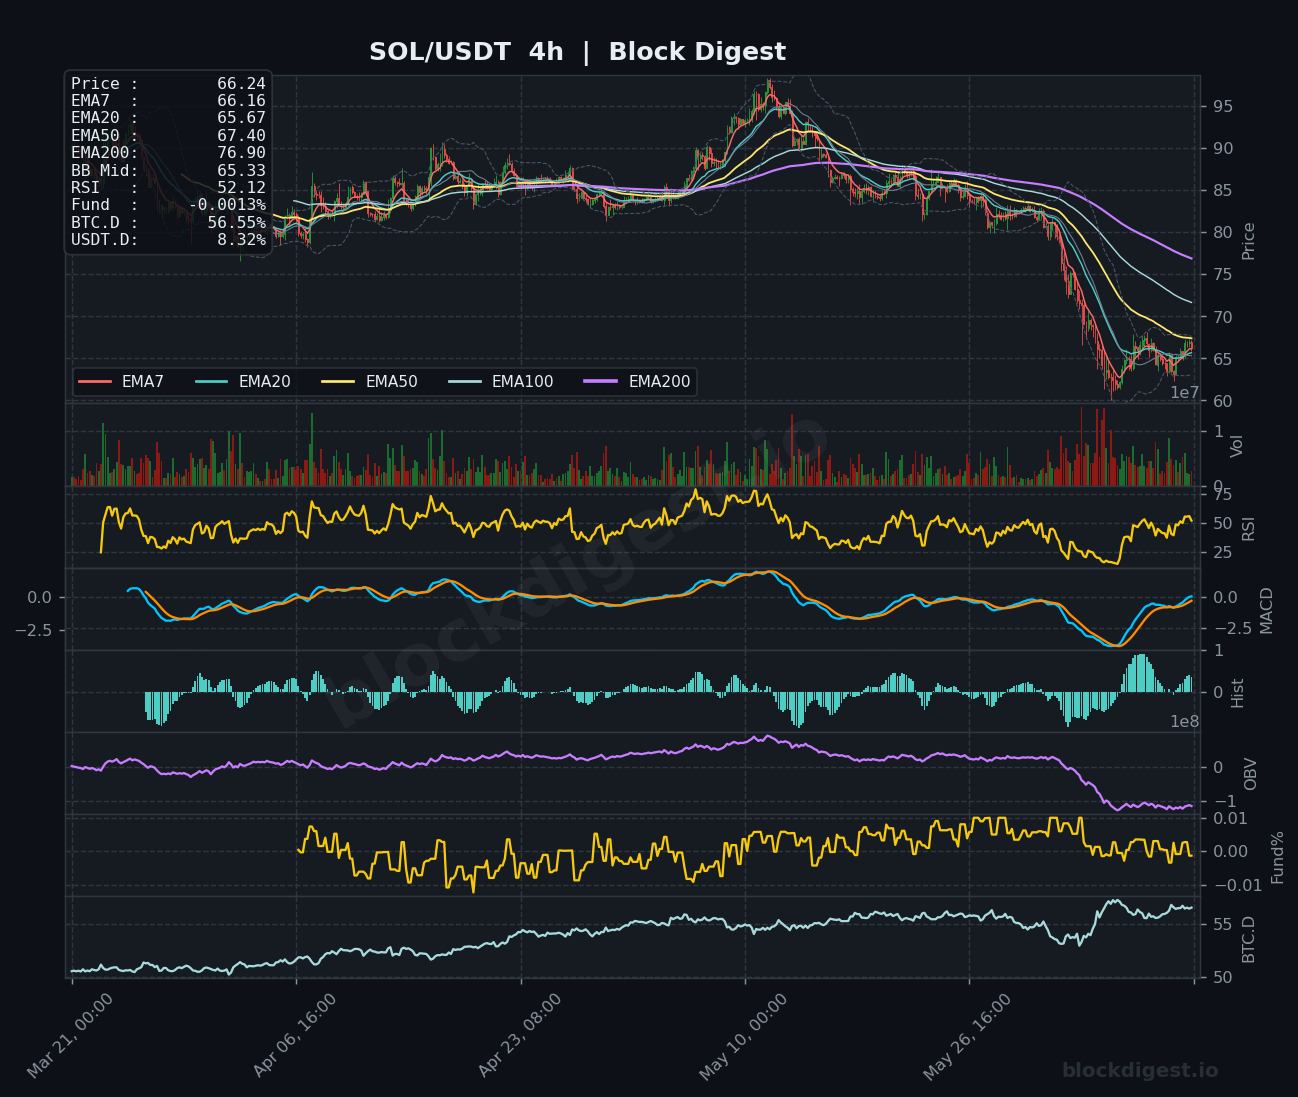
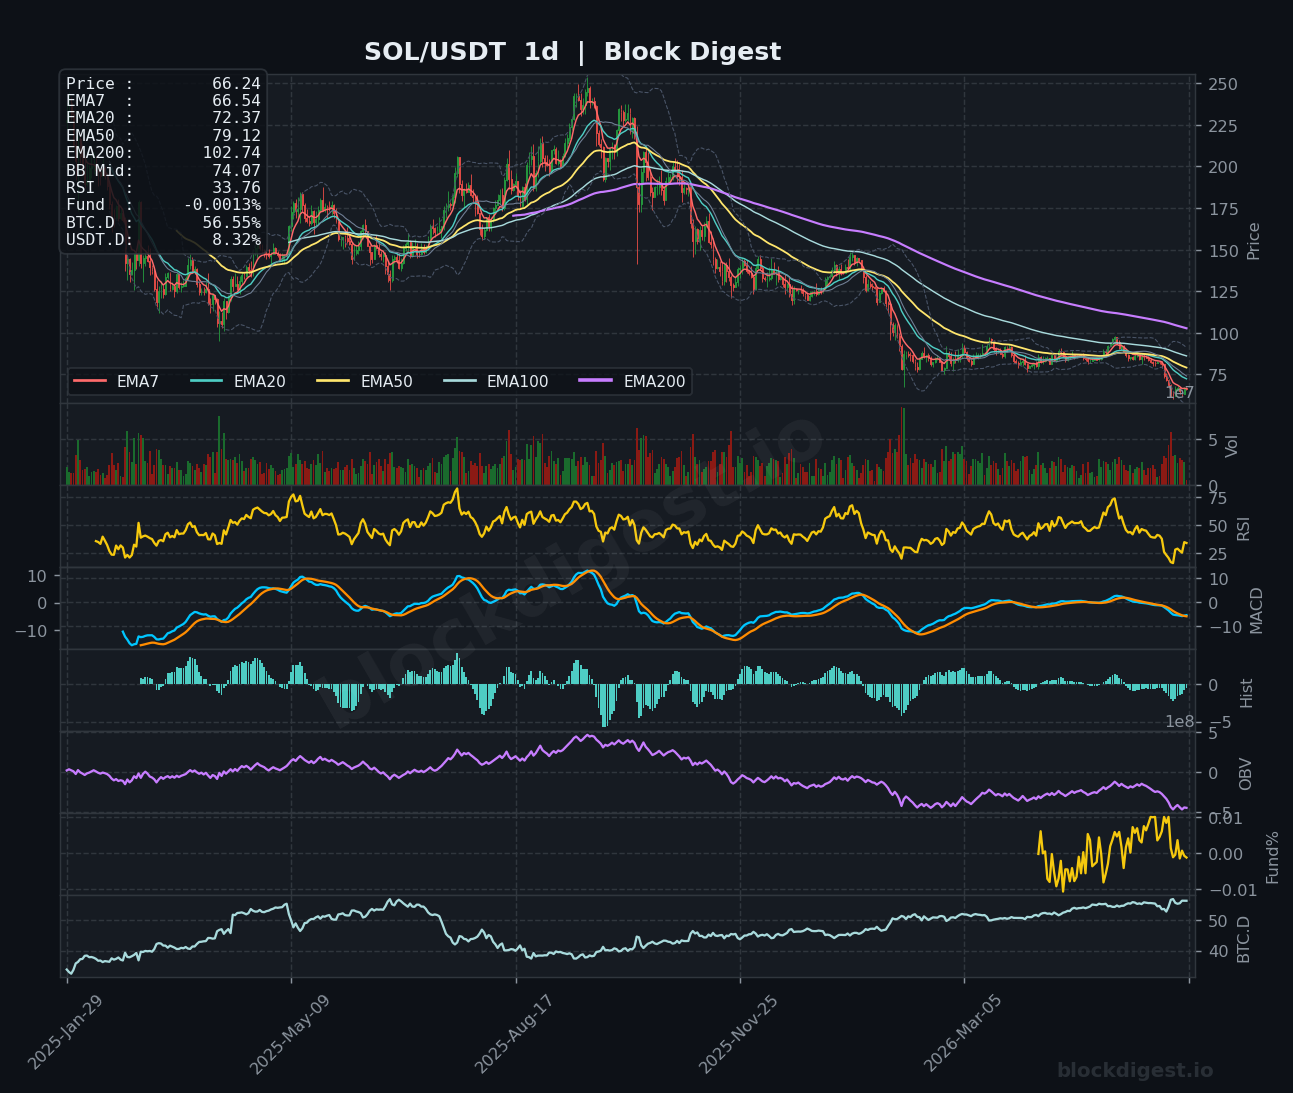
SOL is trading at $66.24, firmly below its 1h EMA200 at $67.41 and the daily EMA20 at $72.37, with all major moving averages stacked bearishly on the daily chart from price all the way up through the EMA200 at $102.74. The daily RSI has deteriorated to 33.76, approaching oversold levels, while the MACD on the 4h frame remains in negative territory though showing early signs of a potential convergence attempt. OBV on both the 1h and daily remains in a persistent downtrend, confirming that volume is not yet supporting any recovery thesis. Short-term bias is cautiously bearish to neutral; bulls need a clean reclaim of the $67.50–$68.00 zone to shift intraday momentum, while the $63–$64 range represents the next meaningful demand area on a breakdown.
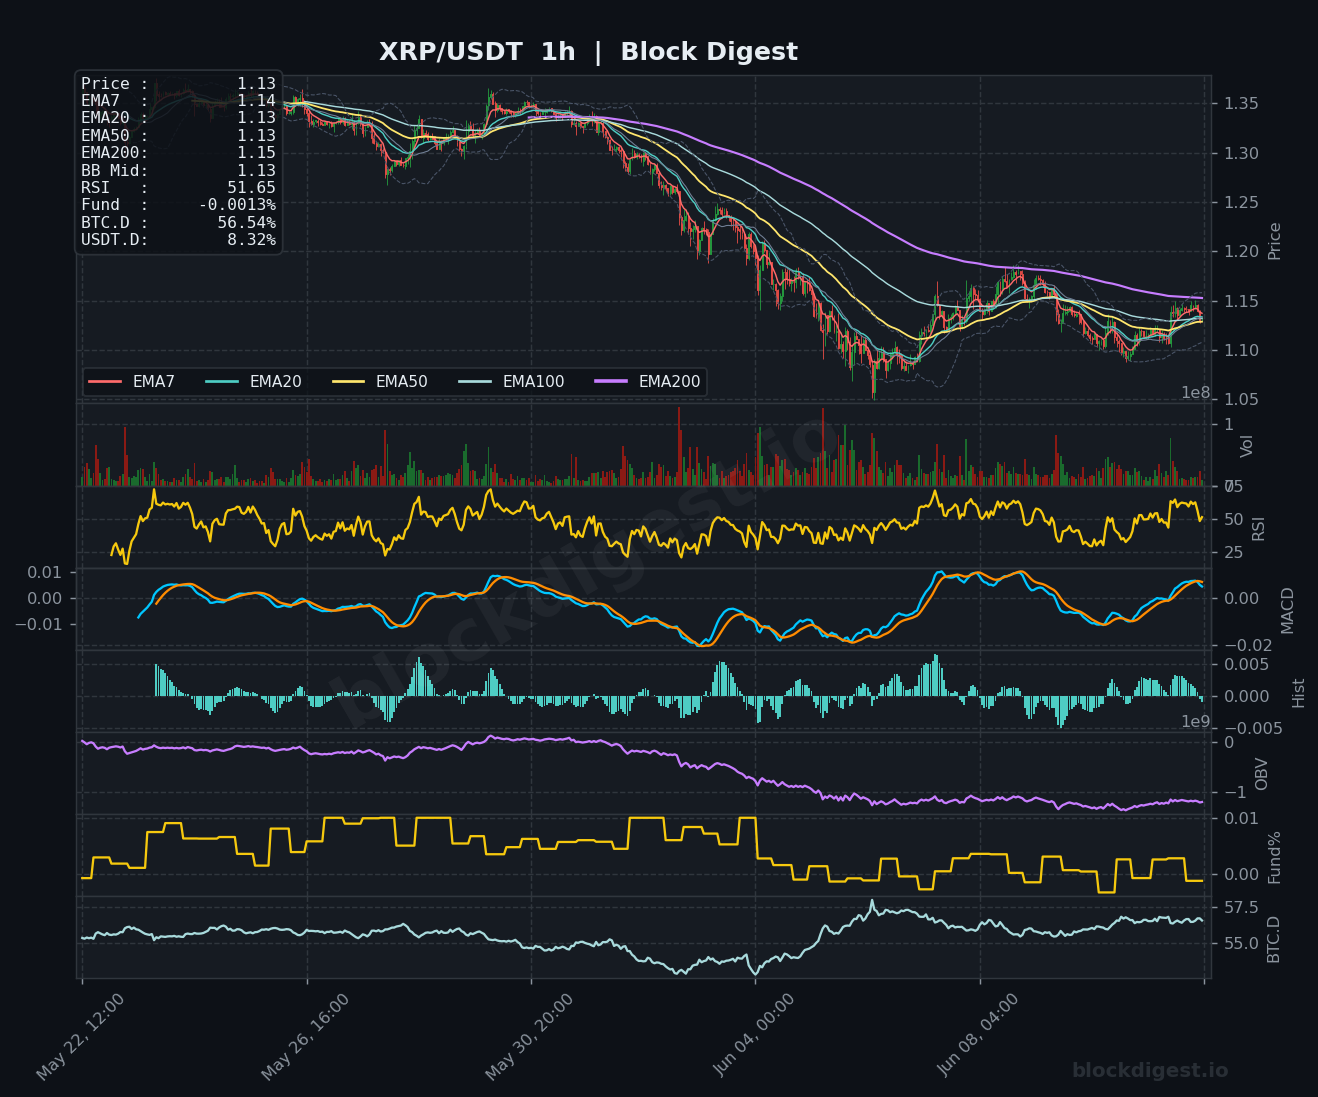
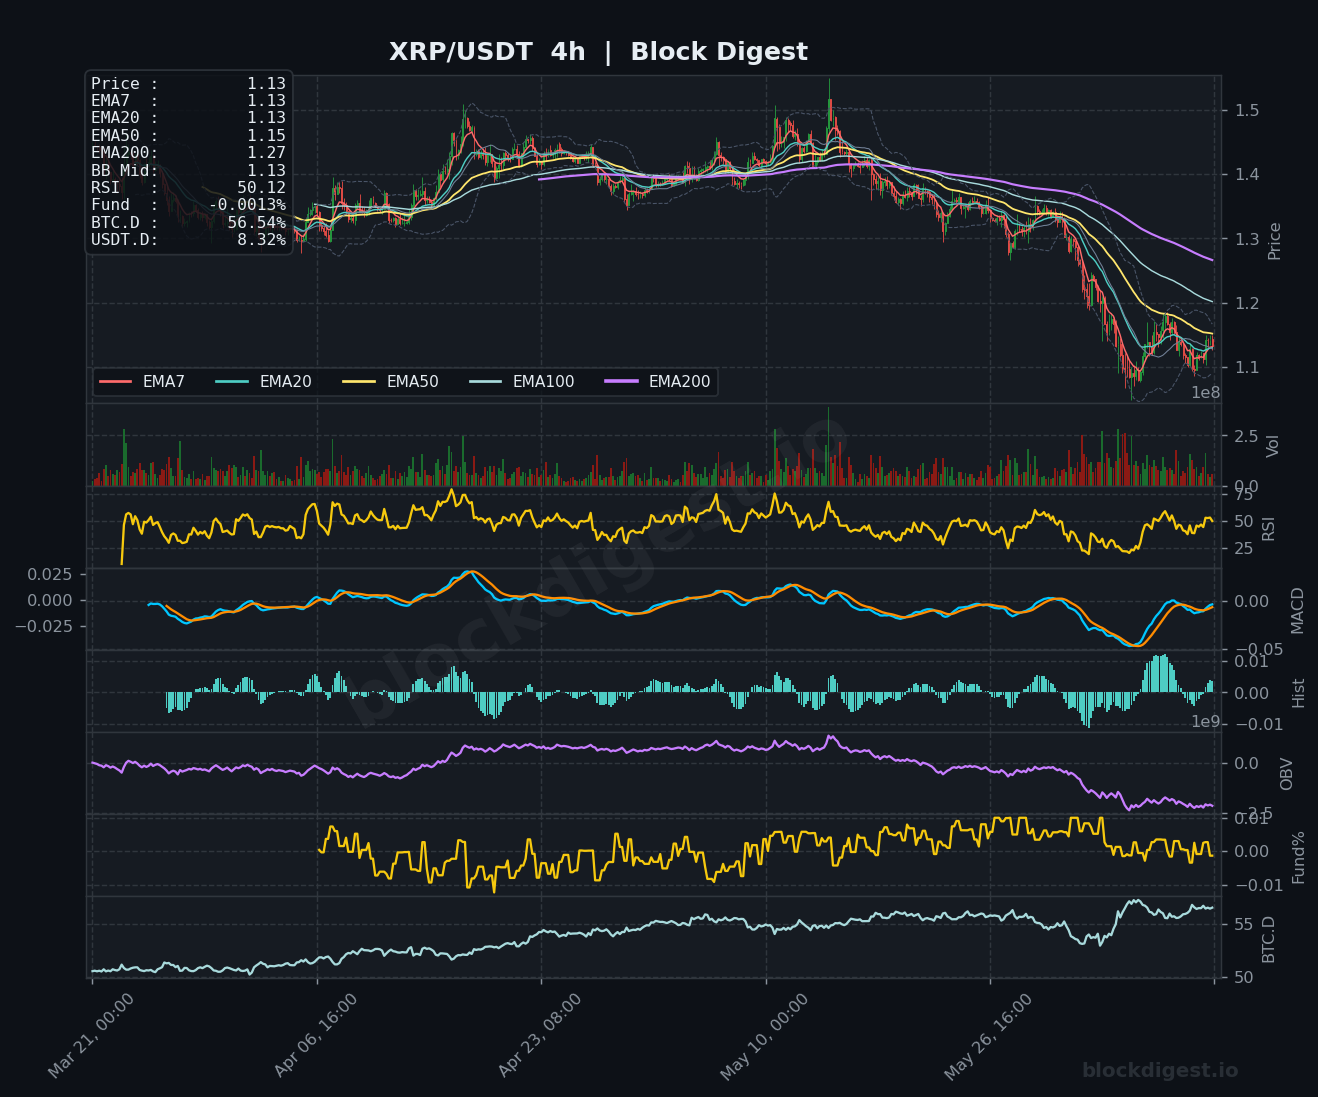
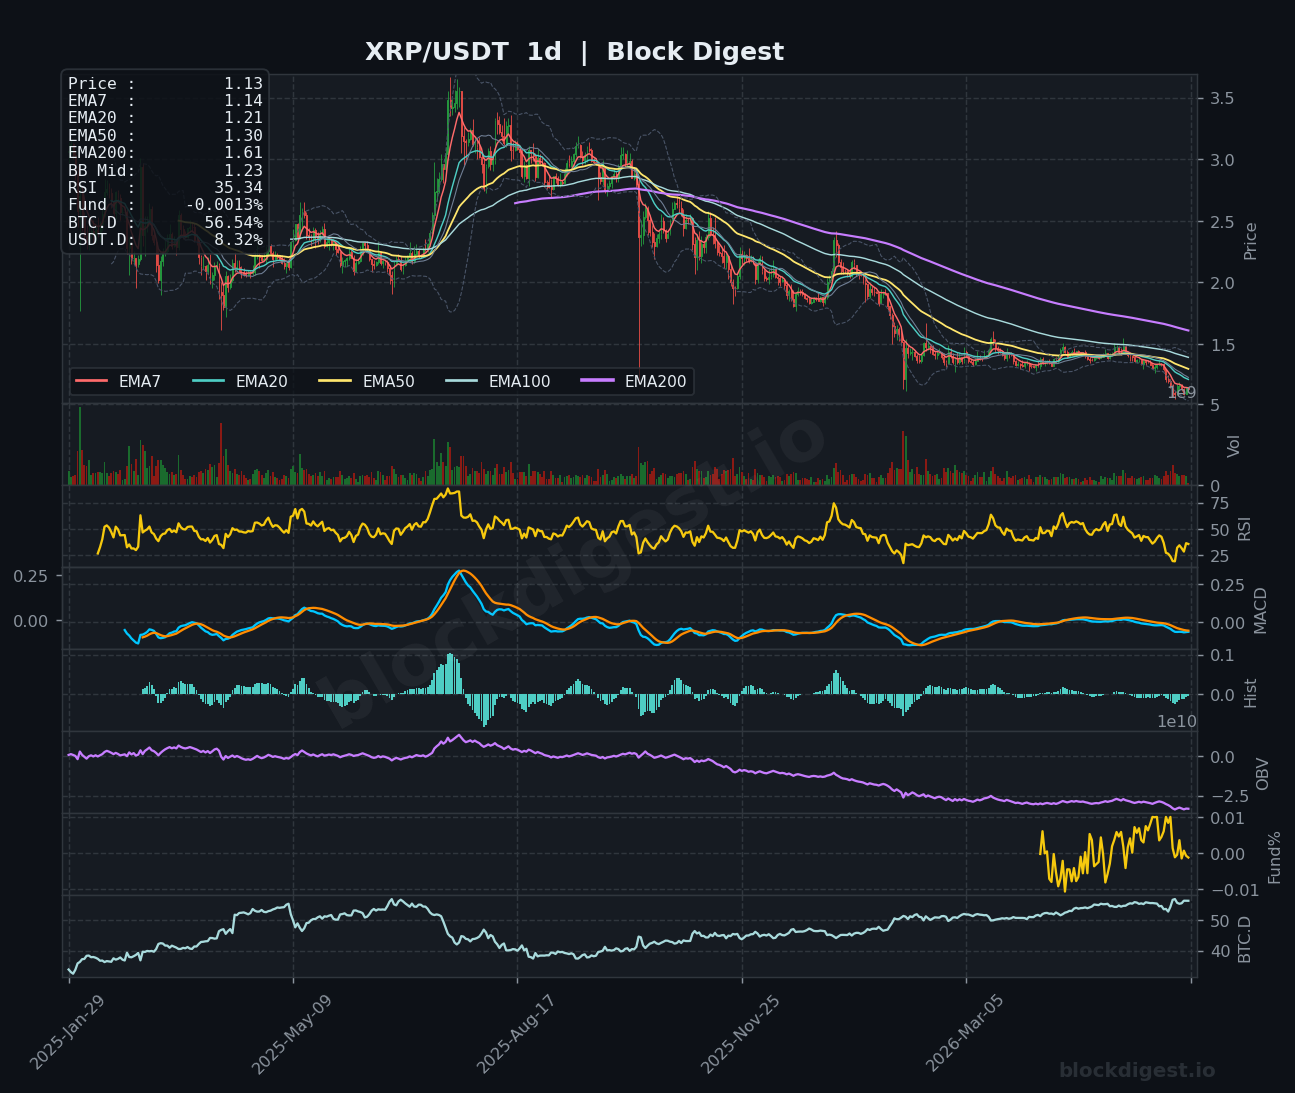
XRP (XRP)
XRP is currently priced at $1.13, trading in a tight cluster just below its 1h EMA200 at $1.15 and well beneath the daily EMA20 at $1.21 and EMA50 at $1.30. The daily RSI has dropped to 35.34, sitting near the edge of oversold territory, while the 4h MACD shows some tentative histogram improvement but has not yet produced a confirmed bullish cross. OBV across all timeframes remains in a steady decline, echoing the persistent selling pressure seen since prices peaked closer to the $1.50 region. The short-term bias leans bearish with the $1.10 level serving as near-term support; only a sustained close above $1.20 would begin to neutralize the current downtrend structure.
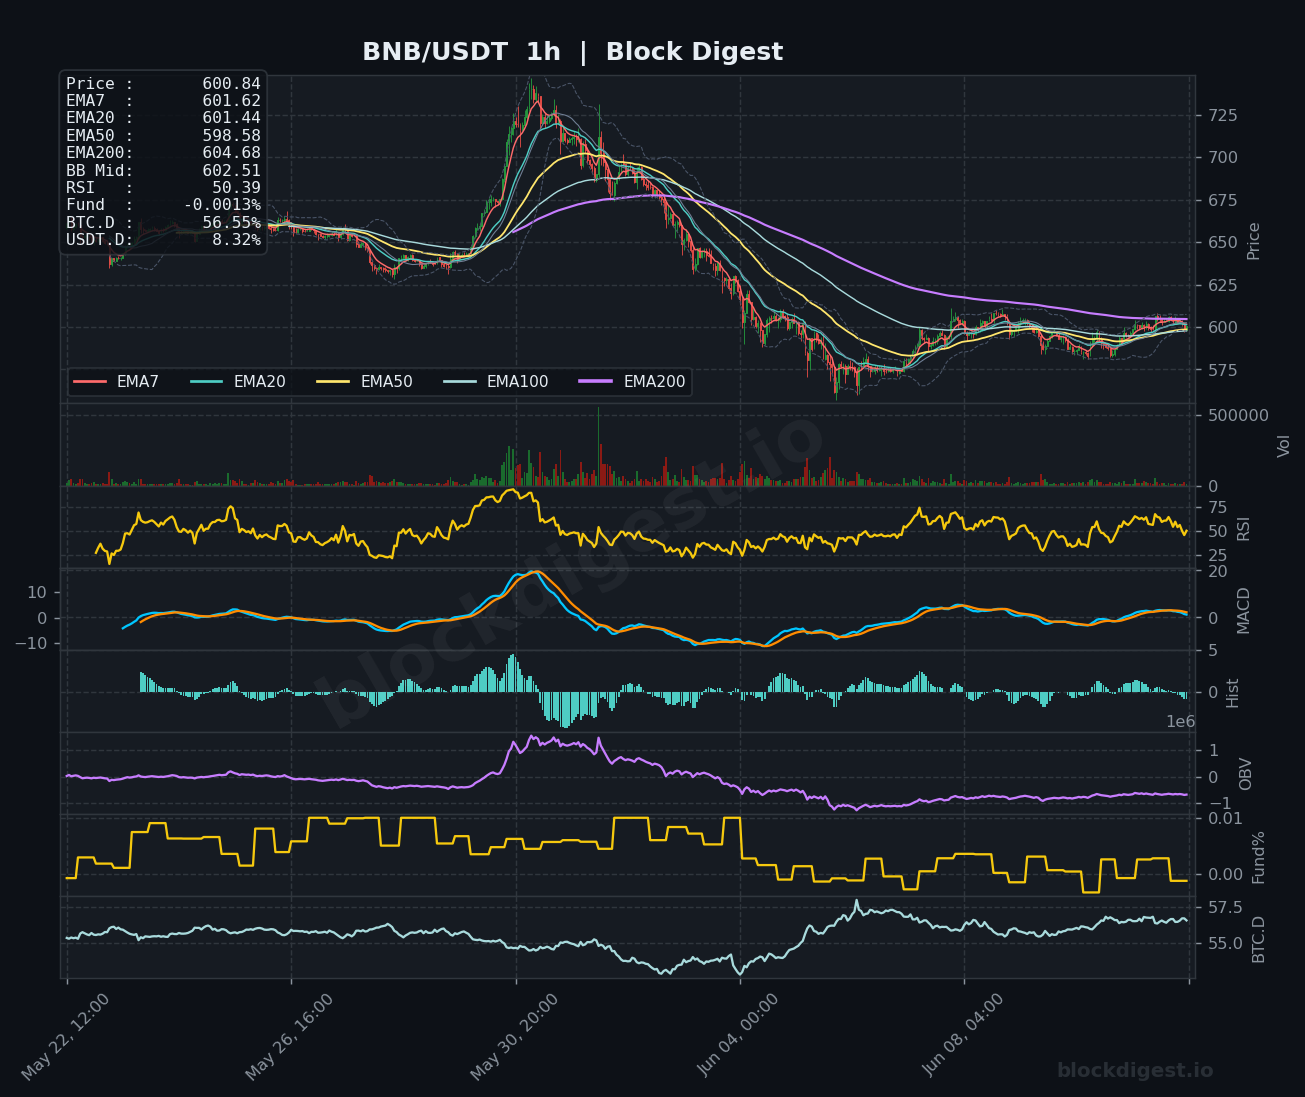
BNB (BNB)
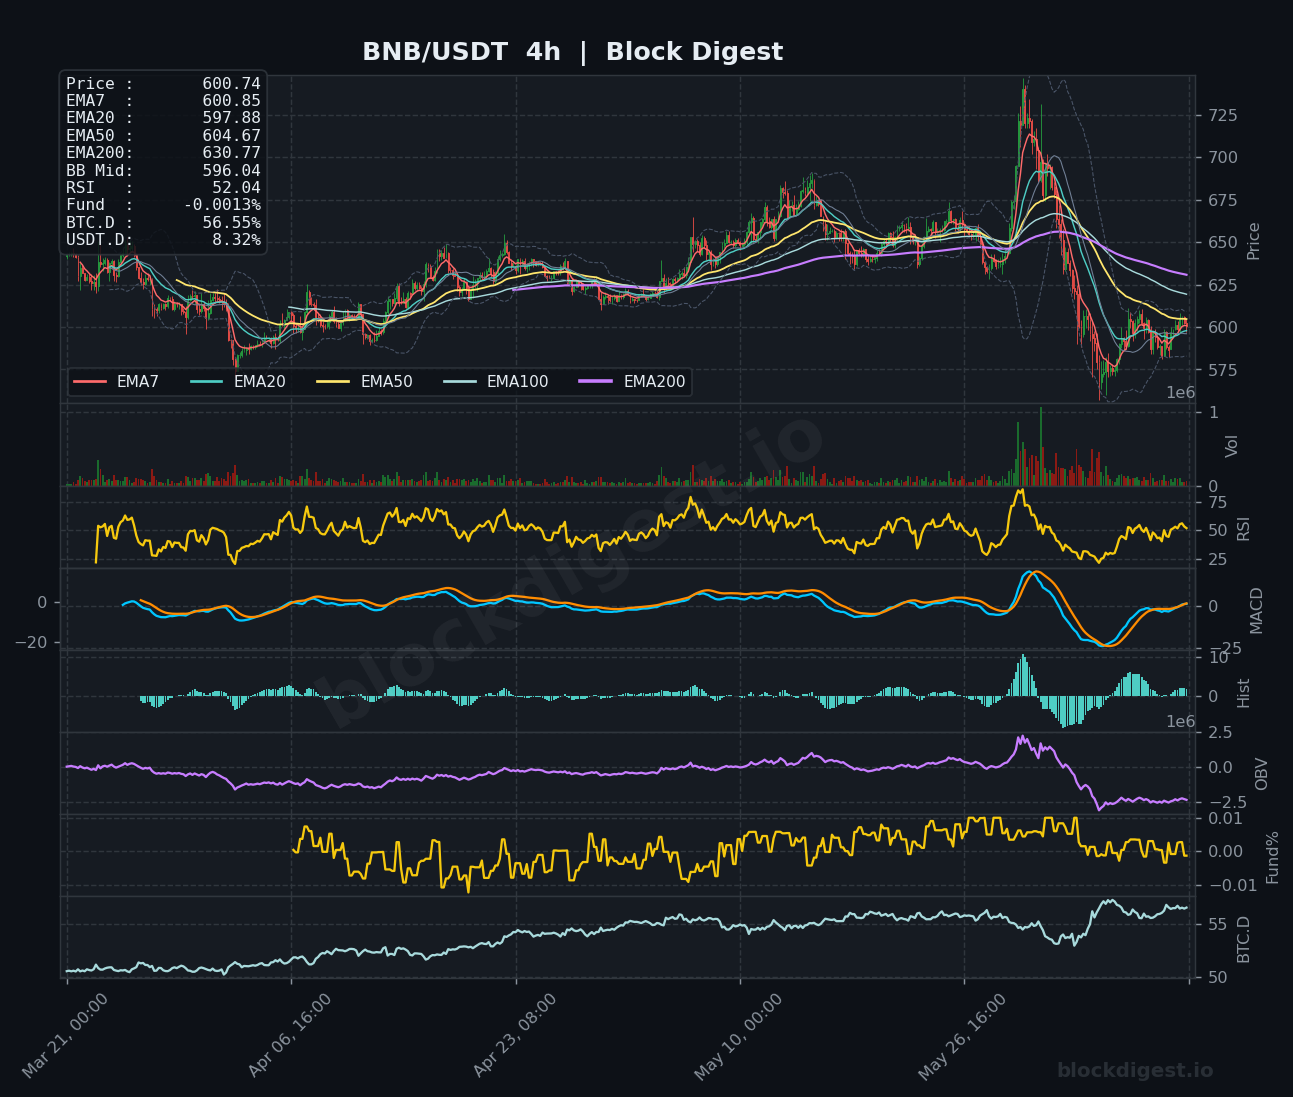
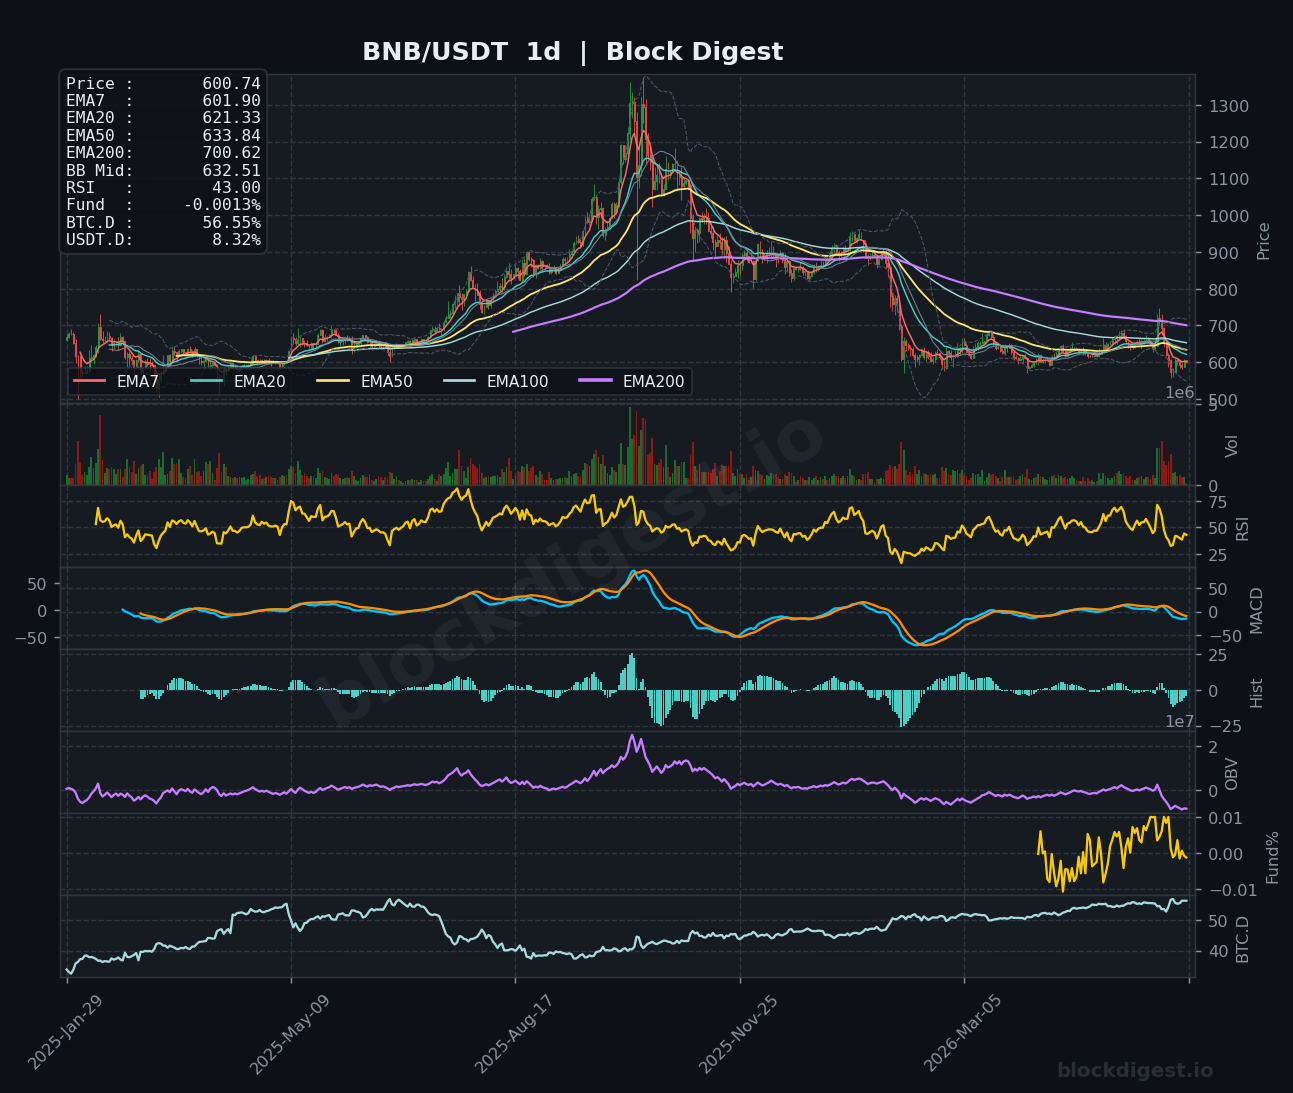
BNB is holding at $600.84, currently sandwiched between its 1h EMA50 at $598.58 and the EMA200 at $604.68, reflecting a brief consolidation after a sharp multi-week decline from highs near $730. The daily RSI reads 43.00, still in bearish territory but showing less deterioration than peers, and the 4h MACD is beginning to curl upward following a deep trough — one of the more constructive momentum setups among today’s surveyed coins. Resistance overhead is significant, with the daily EMA20 at $621.33 and EMA50 at $633.84 representing major hurdles, while the $575–$580 zone provides near-term downside support. Short-term bias is cautiously neutral; BNB appears to be the relative outperformer in this group, but a confirmed bounce requires holding above the $595 handle.
Dogecoin (DOGE)
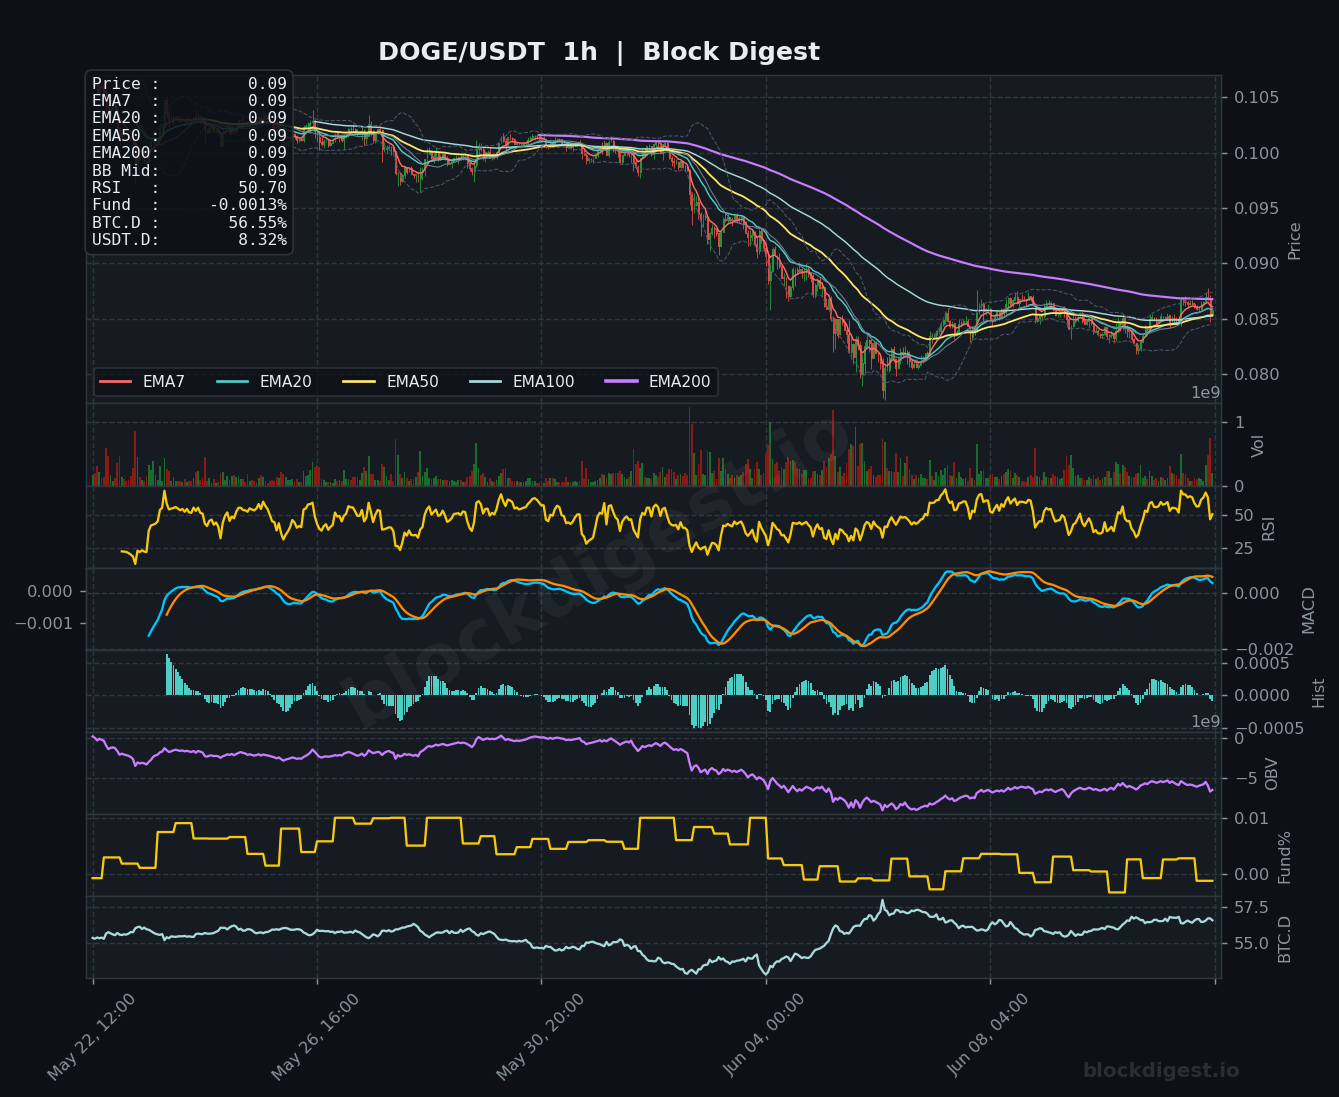
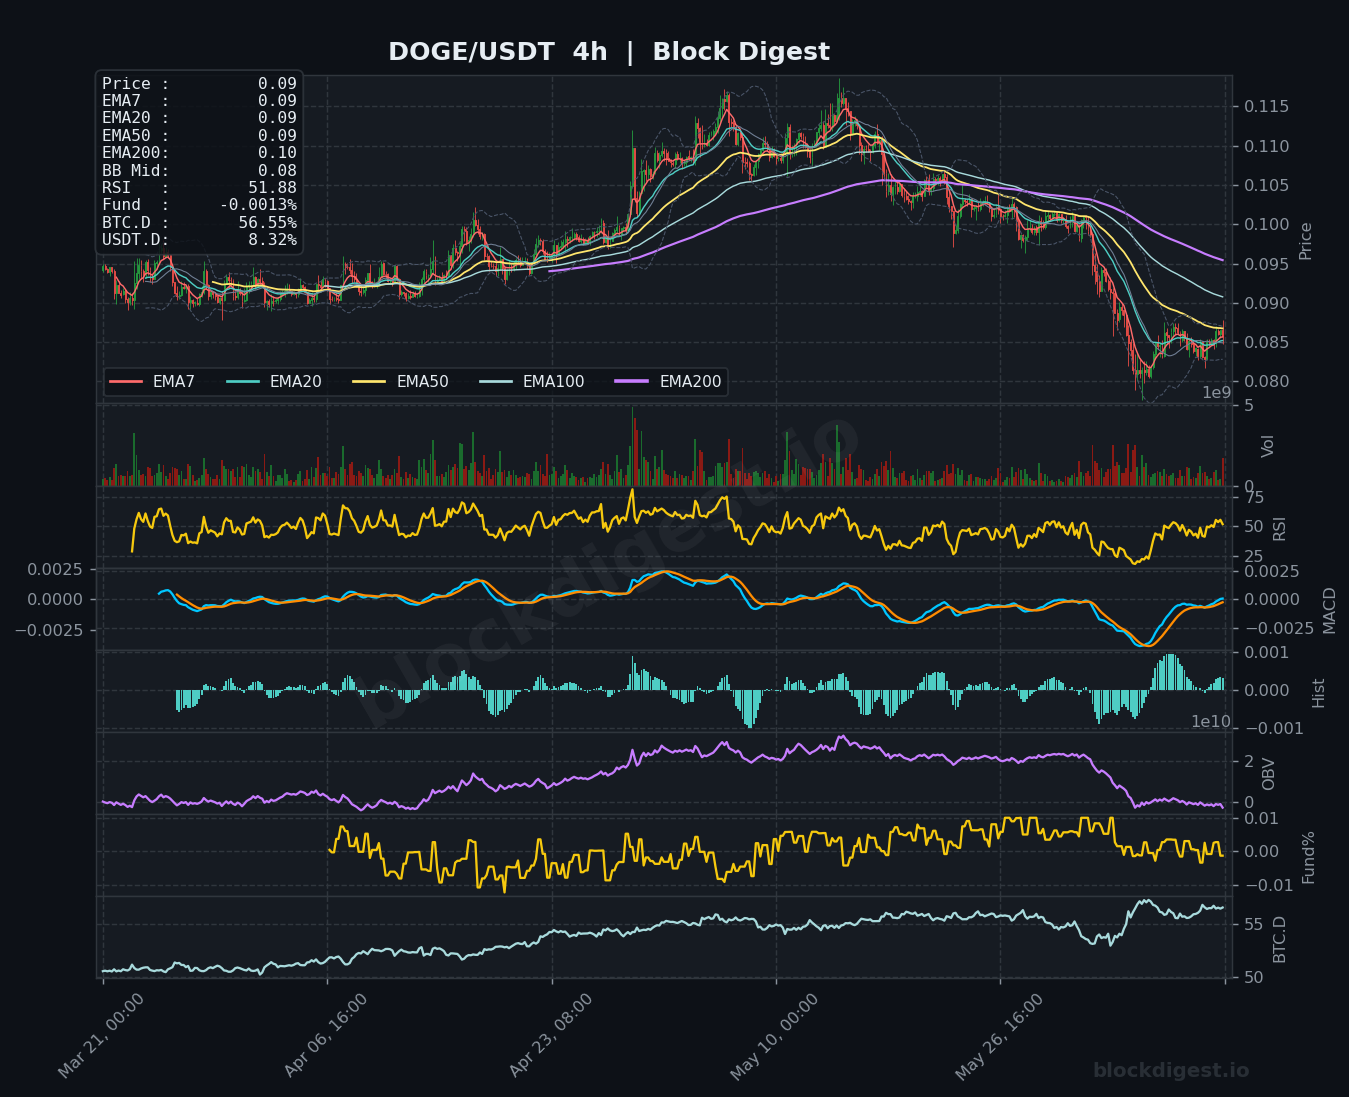
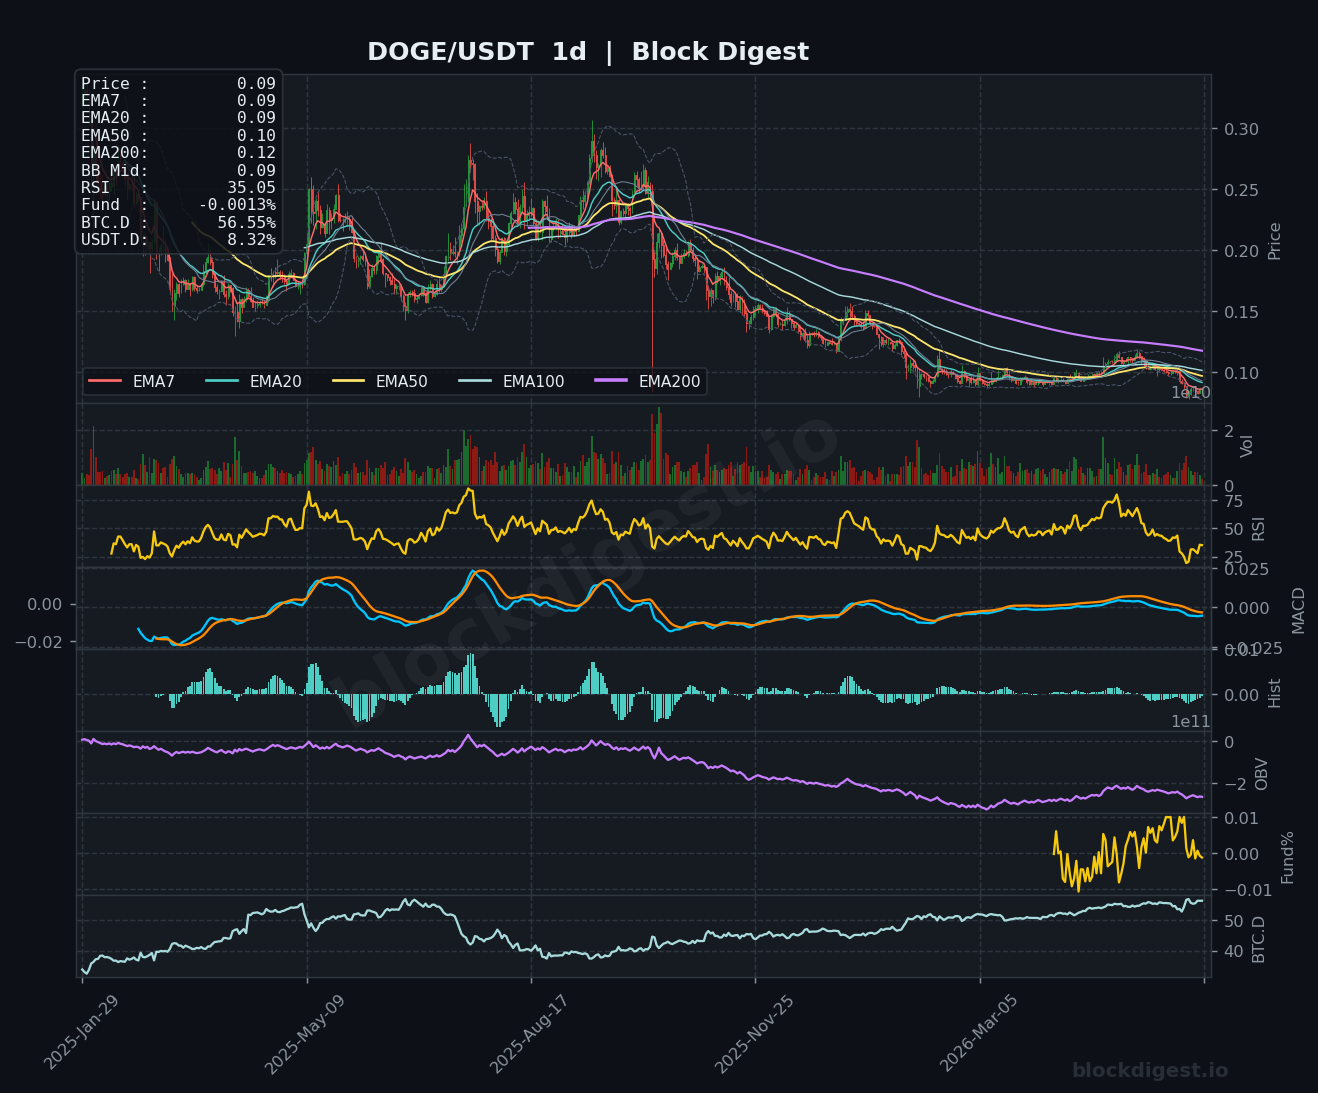
DOGE is trading at $0.09, with all short-term EMAs (7, 20, 50) essentially flat and clustered together on the 1h chart — a sign of directionless consolidation after a prolonged slide from the $0.115 area. The daily RSI has fallen to 35.05, approaching oversold, while the 4h MACD remains negative but histogram bars are showing early signs of compression, hinting at fading downside momentum. The OBV on the daily continues to deteriorate, and the EMA200 on the daily at $0.12 sits far overhead as a structural resistance level. Short-term bias is bearish to neutral; the $0.083–$0.085 range acted as a recent low-volume support zone, and a failure to reclaim $0.090–$0.092 on a closing basis keeps the path of least resistance pointed lower.
Litecoin (LTC)
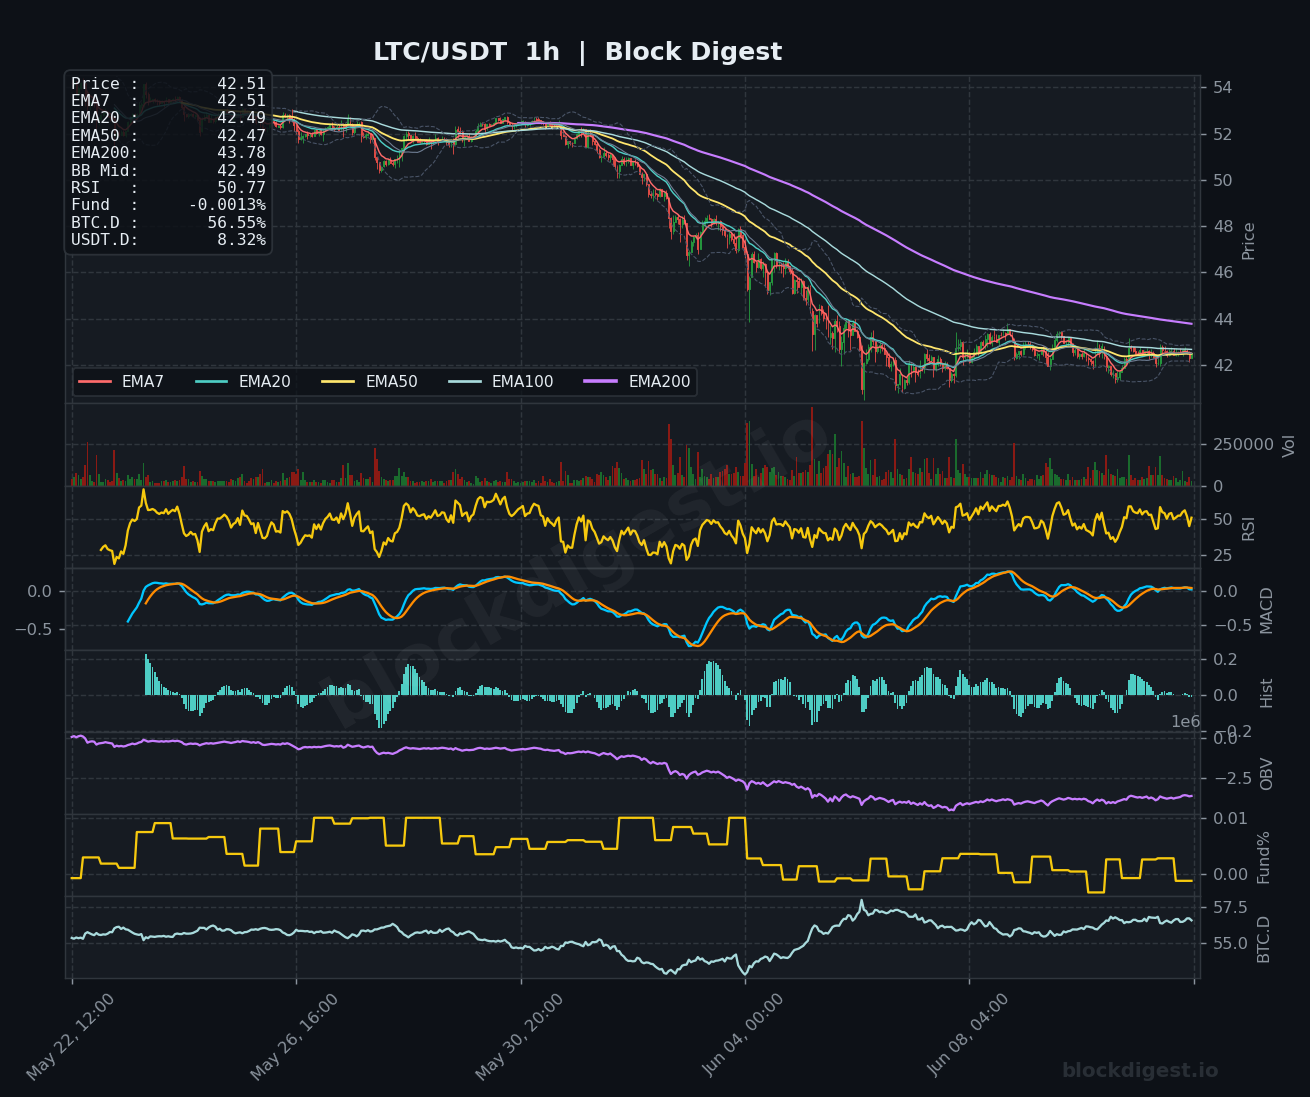
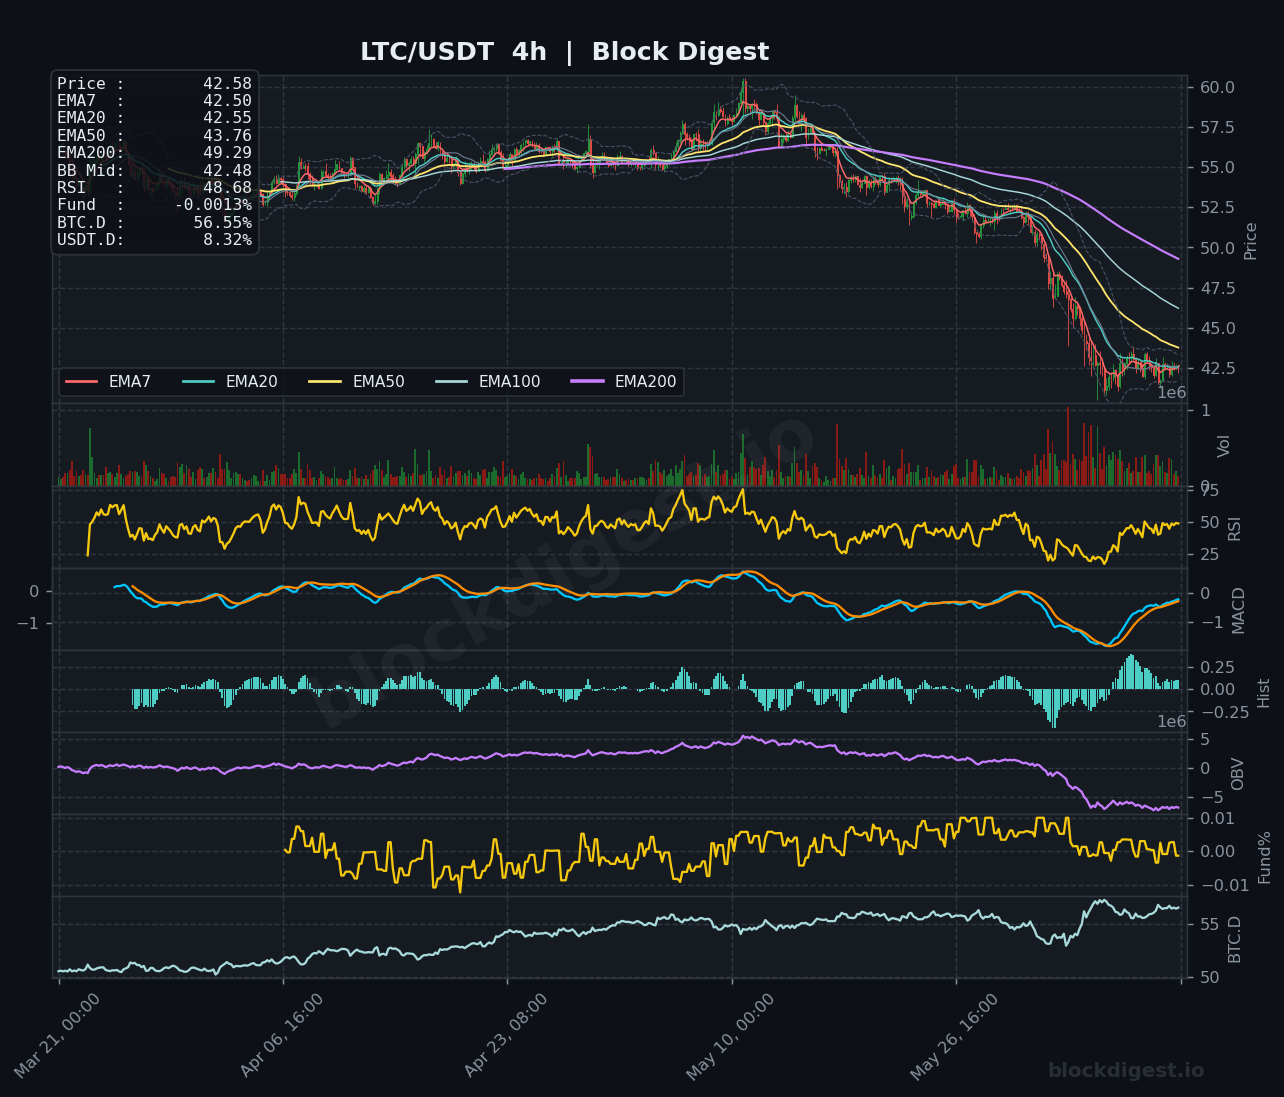
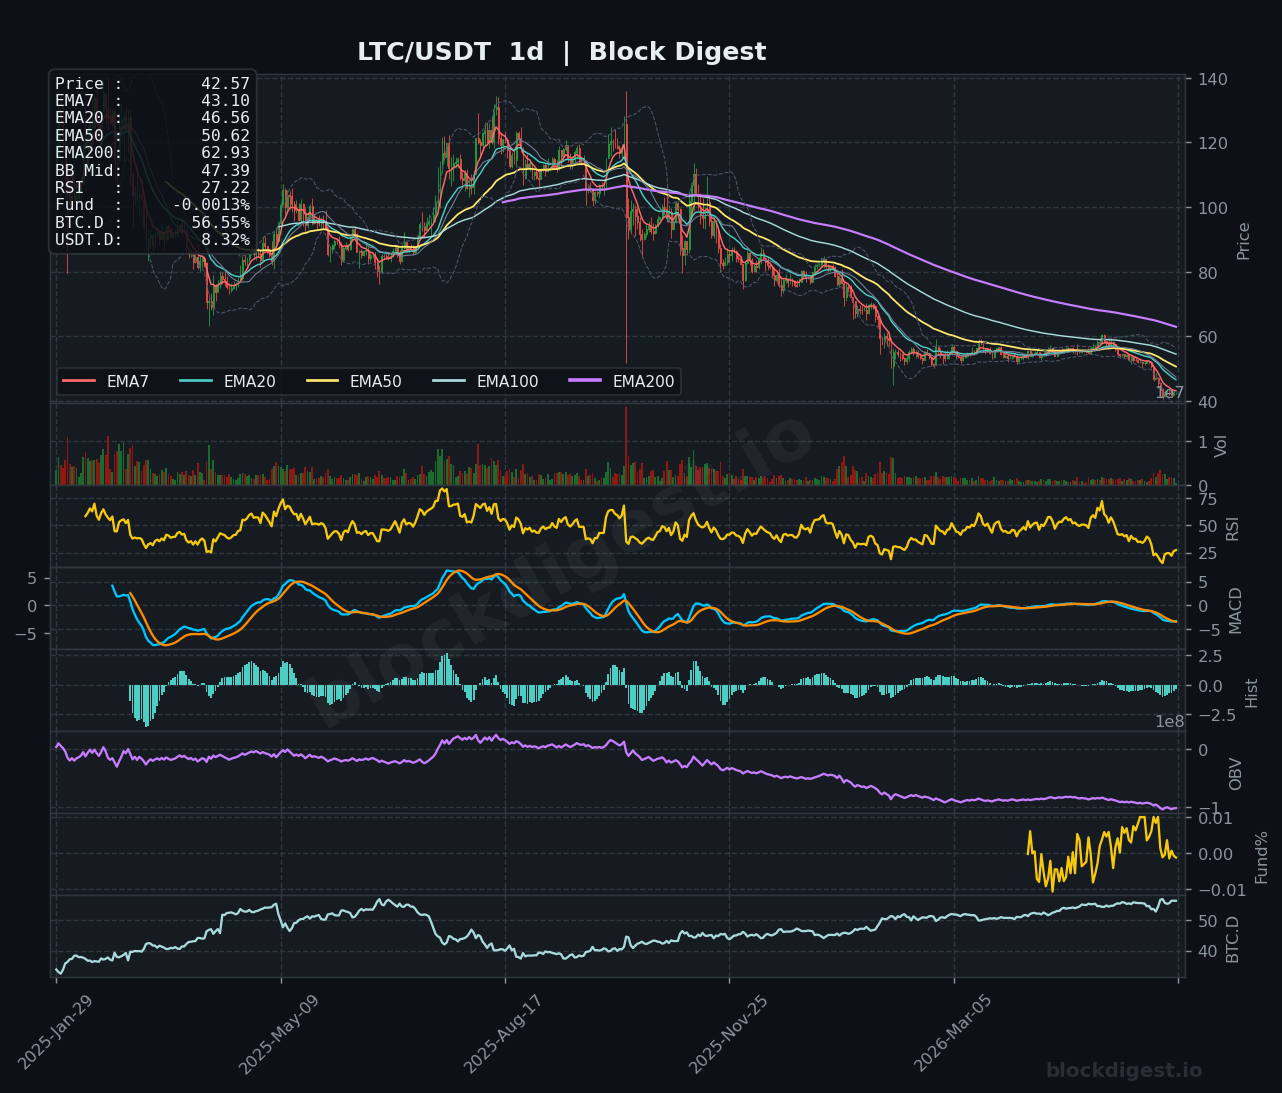
LTC is the weakest performer among today’s cohort on a structural basis, trading at $42.51–$42.57 with a daily RSI that has collapsed to just 27.22 — firmly in oversold territory. Price is trading well below all major daily EMAs, with the EMA20 at $46.56 and EMA50 at $50.62 acting as immediate overhead barriers, and the EMA200 at $62.93 representing a distant macro resistance level. The 4h MACD is deeply negative, though the histogram is beginning to shrink modestly, which could signal the exhaustion of the current selling wave rather than an imminent reversal. A bounce is statistically plausible given RSI extremes, but OBV remains in a firm downtrend; bulls would need to see a reclaim of the $44.00–$45.00 zone to suggest any meaningful stabilization is underway.
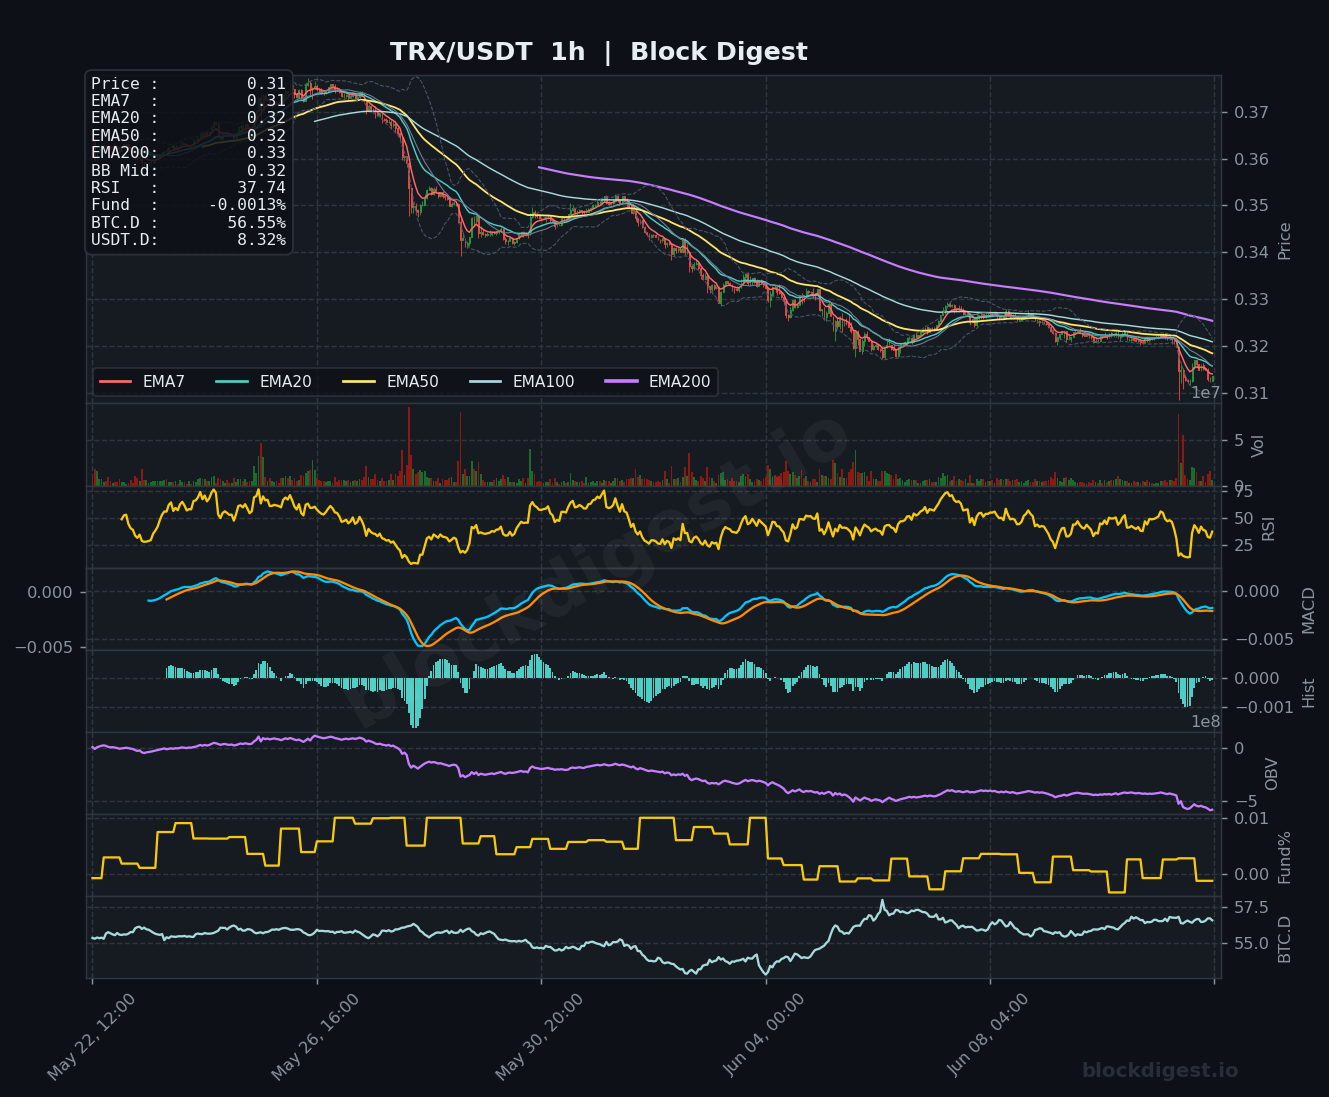
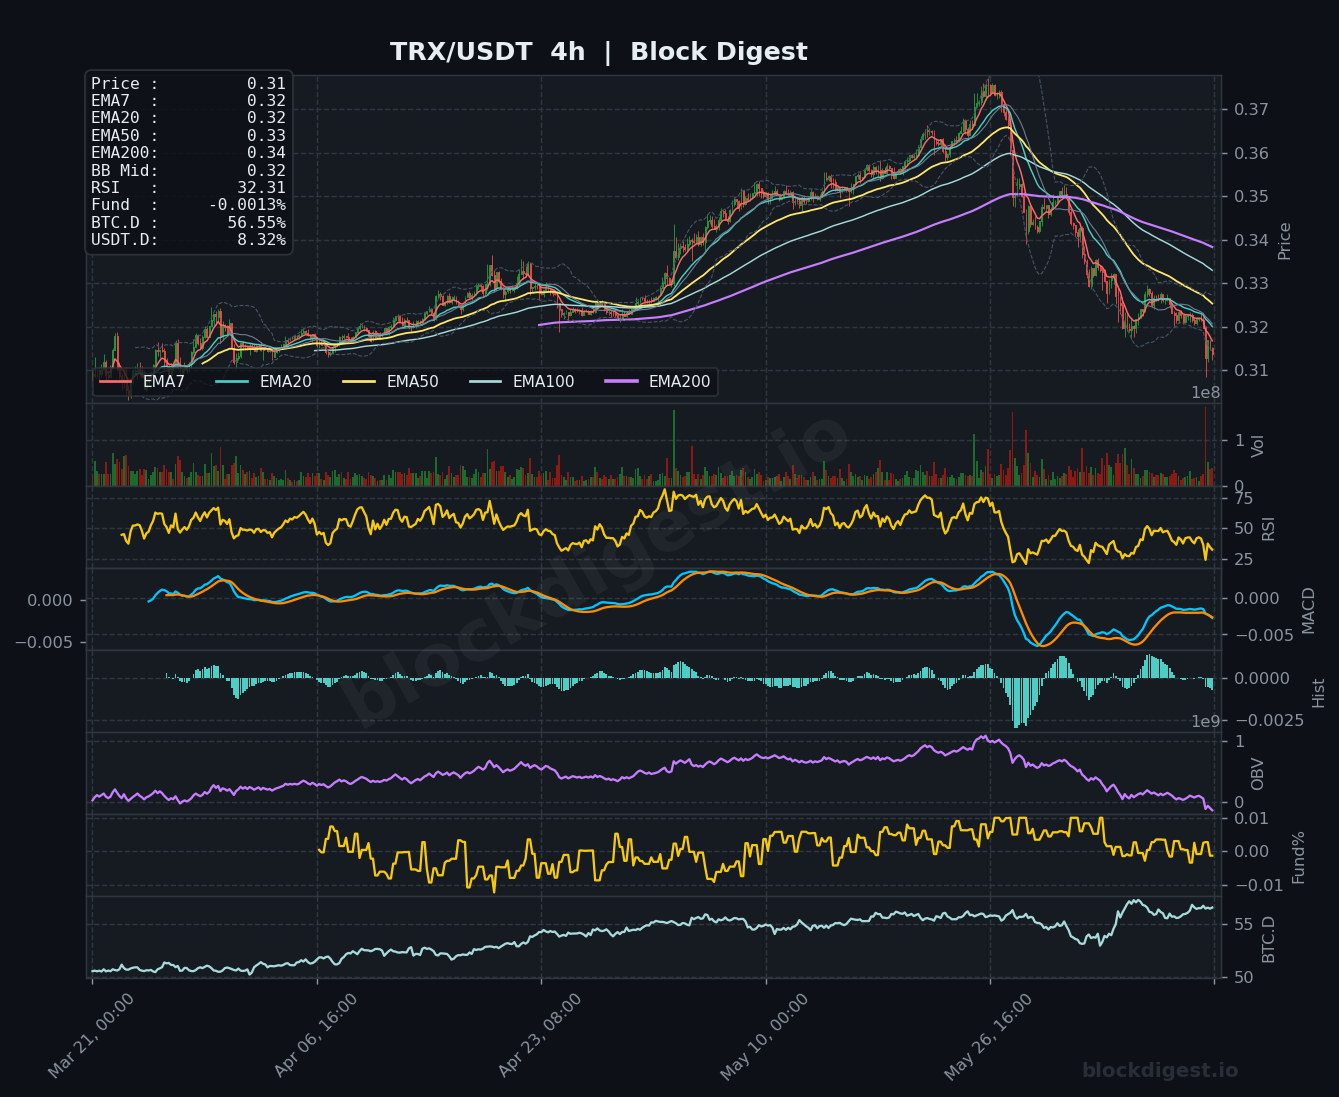
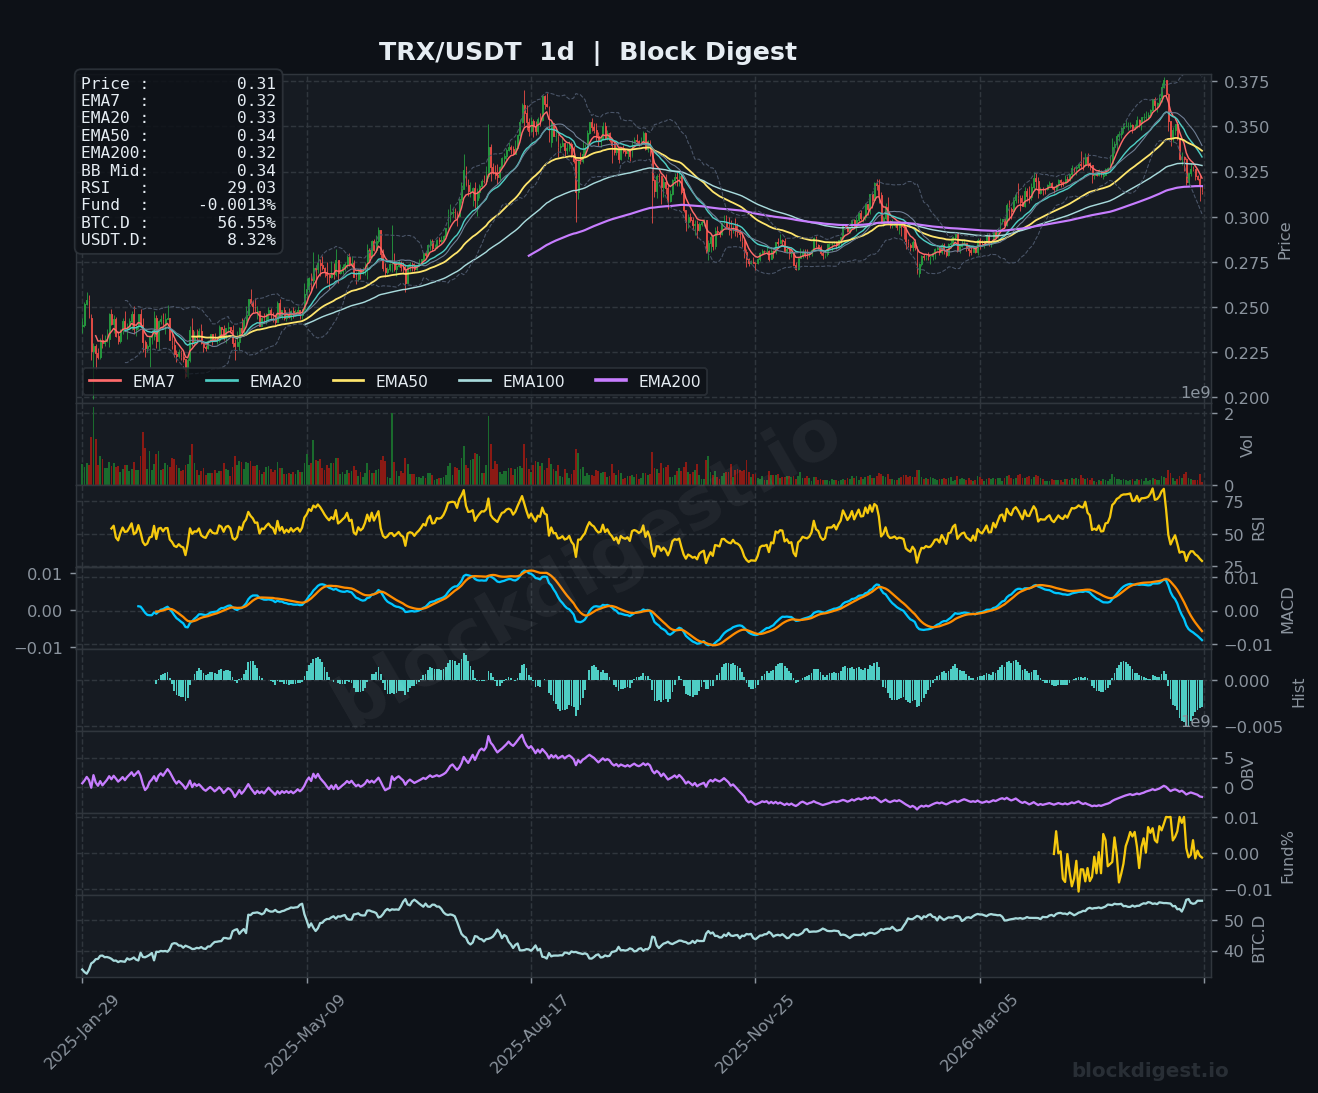
TRON (TRX)
TRX is among the most technically damaged assets in today’s roundup, with the price at $0.31 and RSI readings that are deeply depressed across all timeframes — daily at 29.03 and 4h at 32.31, both in or near oversold territory. The 1h MACD recently turned sharply negative, with histogram bars expanding to the downside, pointing to an acceleration in short-term selling pressure. TRX had the most pronounced peak-to-trough decline in context, having rallied strongly into the $0.375 area before undergoing a near-vertical reversal, with OBV on the daily now trending sharply lower. Support at the $0.30–$0.31 psychological level is being tested; a breakdown below $0.30 would open a significantly deeper corrective leg, while resistance at $0.32–$0.33 must first be overcome for any short-term stabilization.
Altcoin Outlook
The June 12 altcoin landscape is dominated by broad structural weakness, with most major coins trading beneath key daily moving averages and RSI readings across the board indicating that the corrective phase that began weeks ago remains intact. BNB presents the most relatively constructive short-term setup, with its 4h momentum showing early recovery signals and price holding above critical support around $595–$600, while LTC and TRX display the most technically distressed profiles with oversold daily RSIs and deteriorating OBV. The key conditions to watch across the space include any meaningful decline in BTC dominance below the 55.5% threshold, which would signal the beginning of altcoin capital rotation, and a drop in USDT dominance from its current 8.32% level, which would indicate sidelined capital re-entering the risk market. Until those macro signals shift, traders should approach intraday setups with caution and size positions accordingly, treating bounces as potential relief rallies within a broader corrective structure rather than confirmed trend reversals.
Disclaimer: This analysis is for informational purposes only and does not constitute financial advice. Cryptocurrency markets are highly volatile and unpredictable. All trading decisions should be made based on your own research and risk tolerance. Block Digest is not responsible for any financial losses incurred as a result of acting on this content.