
Market Context
Bitcoin dominance sits at 55.47% as of July 11, 2026, a level that continues to suppress broad altcoin outperformance and signals that capital remains concentrated in BTC rather than rotating aggressively into the broader market. USDT dominance at 8.06% reflects a meaningful pool of sidelined capital that has not yet committed to risk assets, keeping overall altcoin momentum restrained. The global crypto market cap holding near $2.28 trillion with only modest 24-hour movement suggests a consolidation phase rather than a directional breakout, with select ecosystems — notably XRP Ledger and Polkadot — showing relative strength within an otherwise cautious environment.
Solana (SOL)
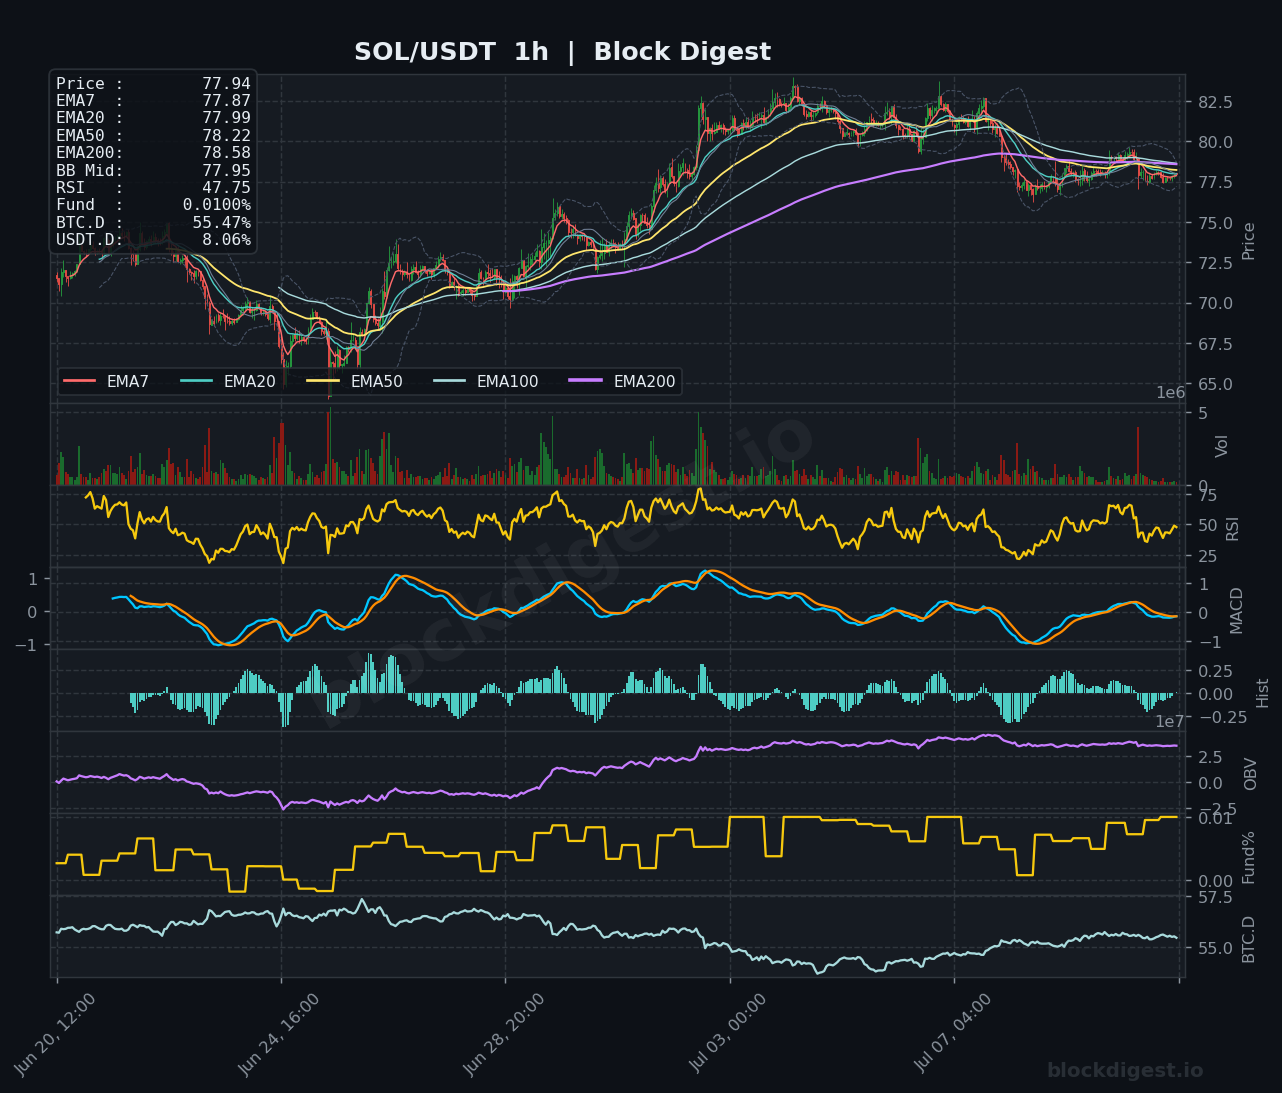
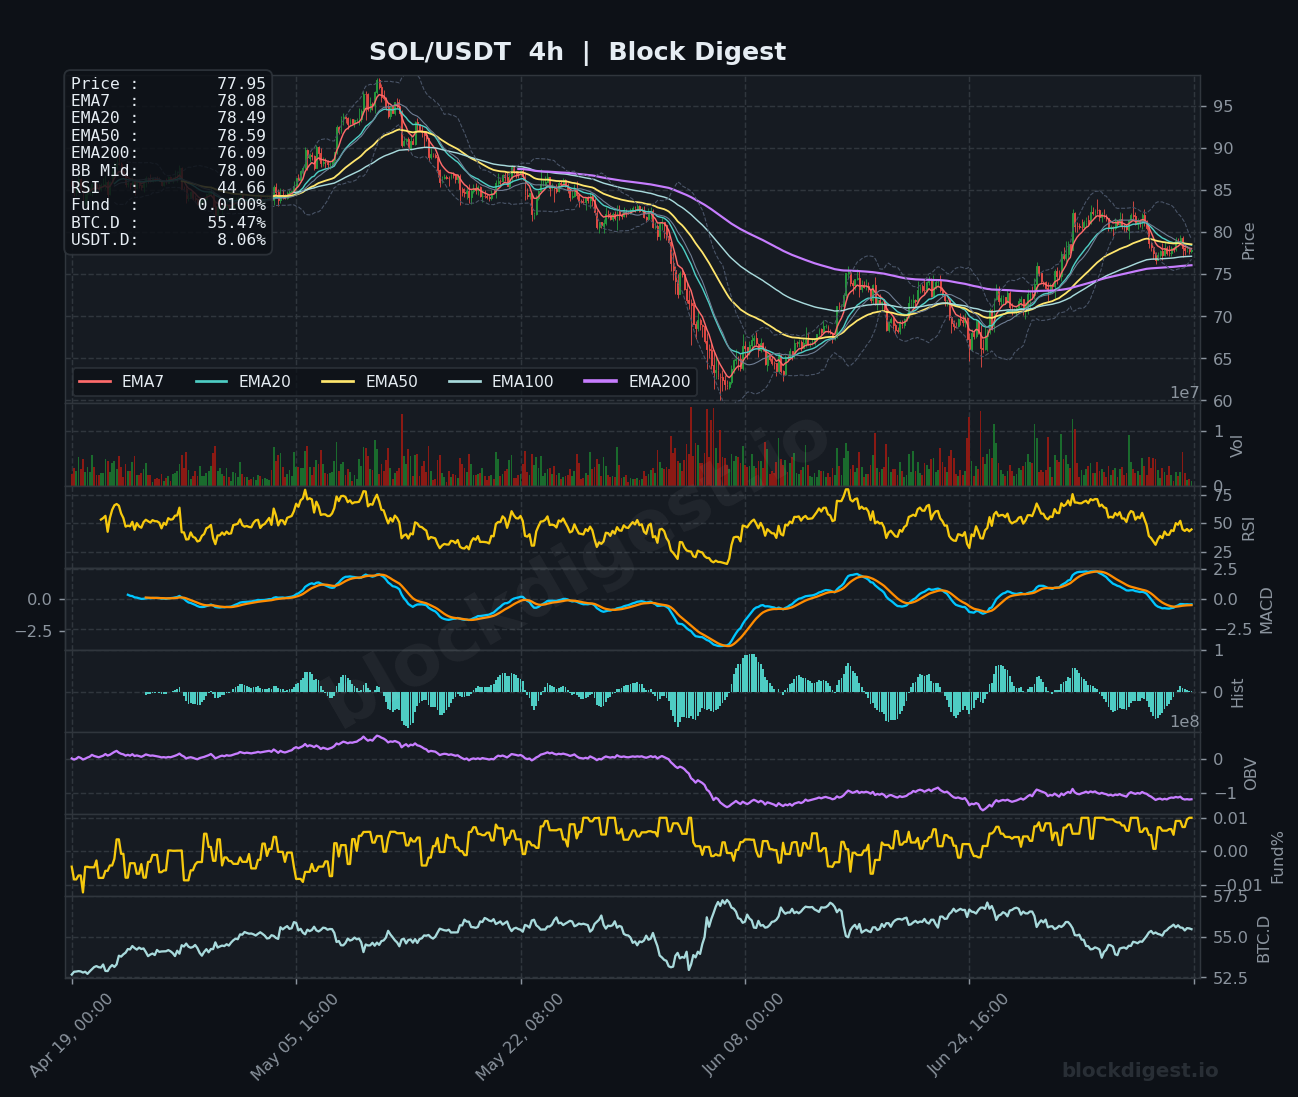
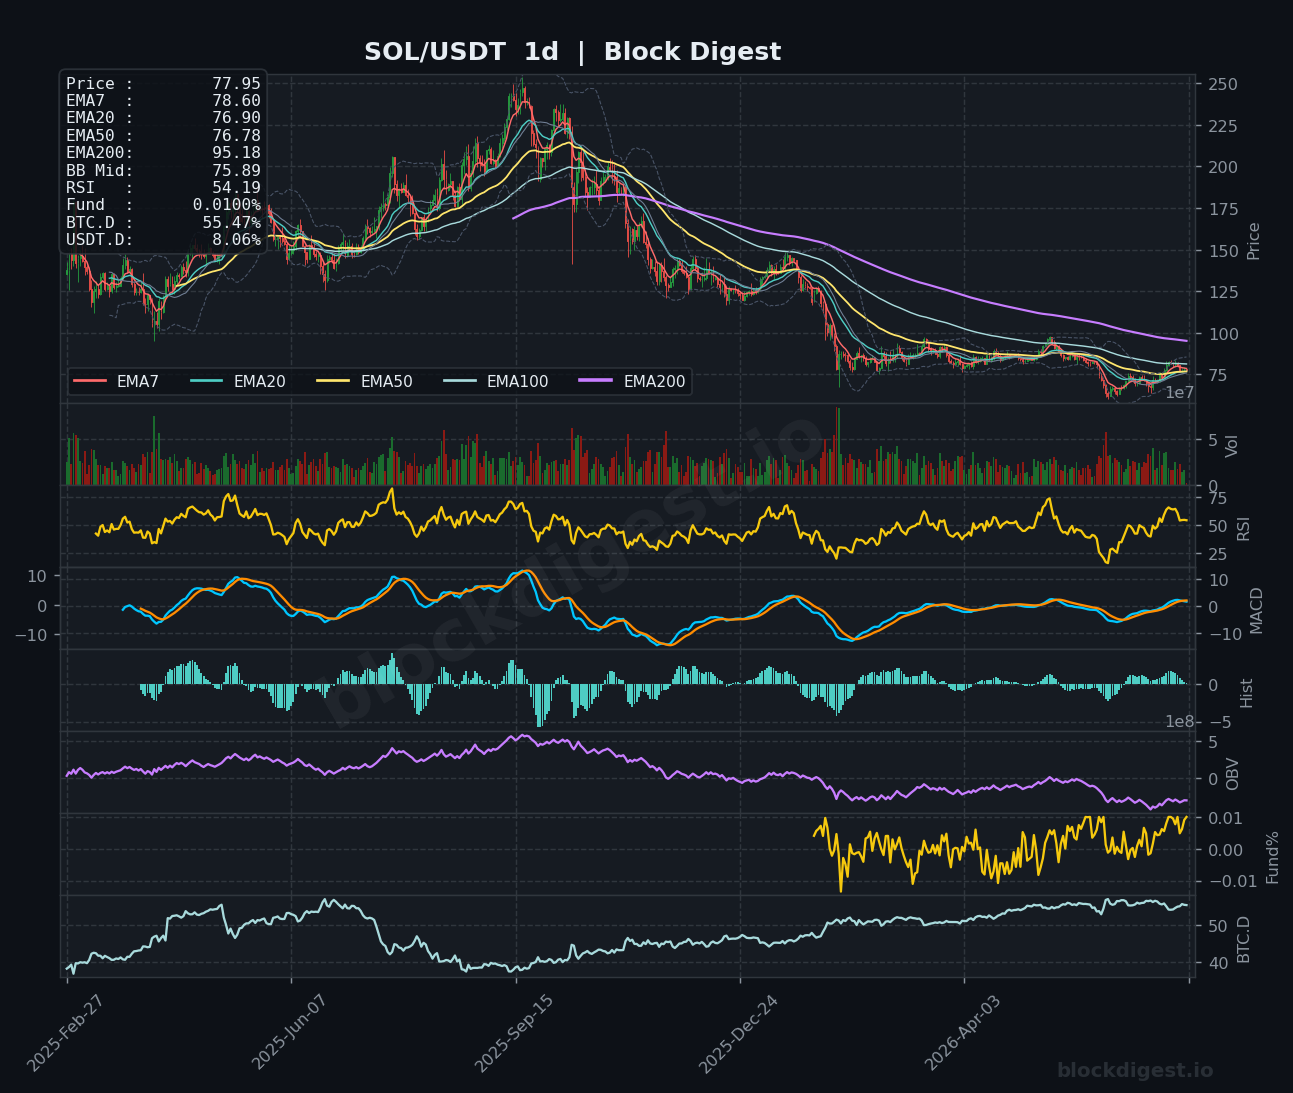
SOL is trading at approximately $77.95, caught in a short-term pullback after failing to sustain momentum above the $80–$82.50 resistance zone visible across the 1h and 4h charts. On the 1h timeframe, price is trading below its EMA50 ($78.22) and EMA200 ($78.58), with RSI at 47.75 — hovering near the midline but leaning bearish — while the MACD histogram has compressed close to zero, indicating indecision. The 4h chart shows RSI at 44.66, and while price has recovered significantly off its mid-June lows near $65, it remains beneath all major EMAs except the EMA200 at $76.09, suggesting the recovery is structurally tentative. On the daily chart, RSI sits at a neutral 54.19 and price trades well below the descending EMA200 at $95.18, reinforcing a broader bearish macro structure; the Alpenglow consensus upgrade narrative may provide a fundamental catalyst, but technicals suggest SOL needs to reclaim $80 convincingly before a bullish bias is warranted.
XRP (XRP)
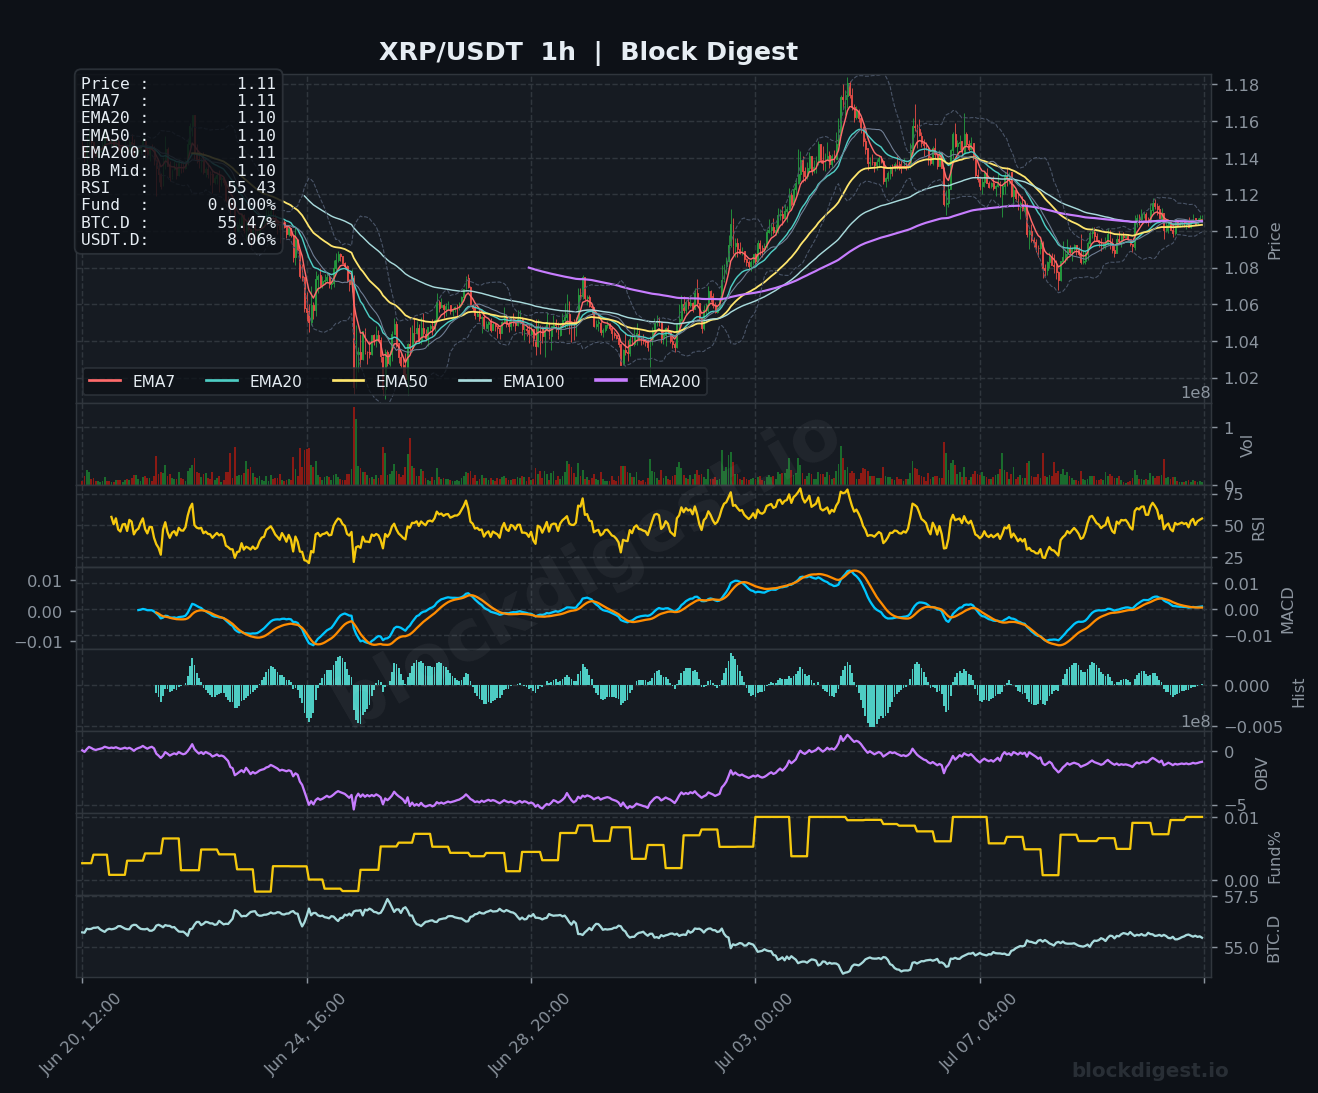
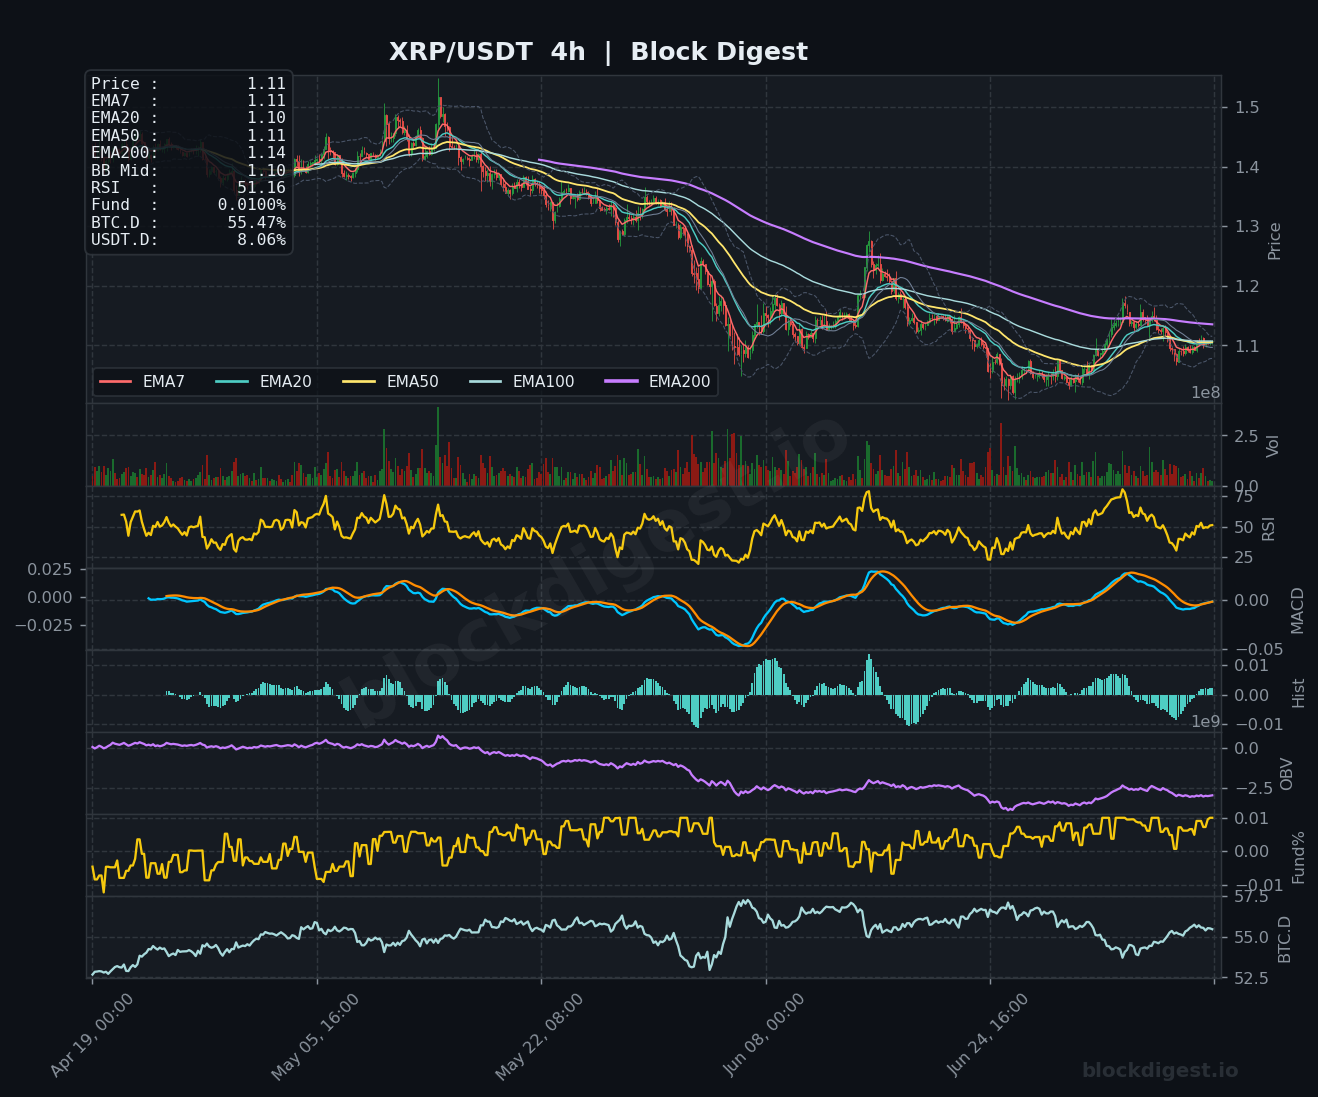
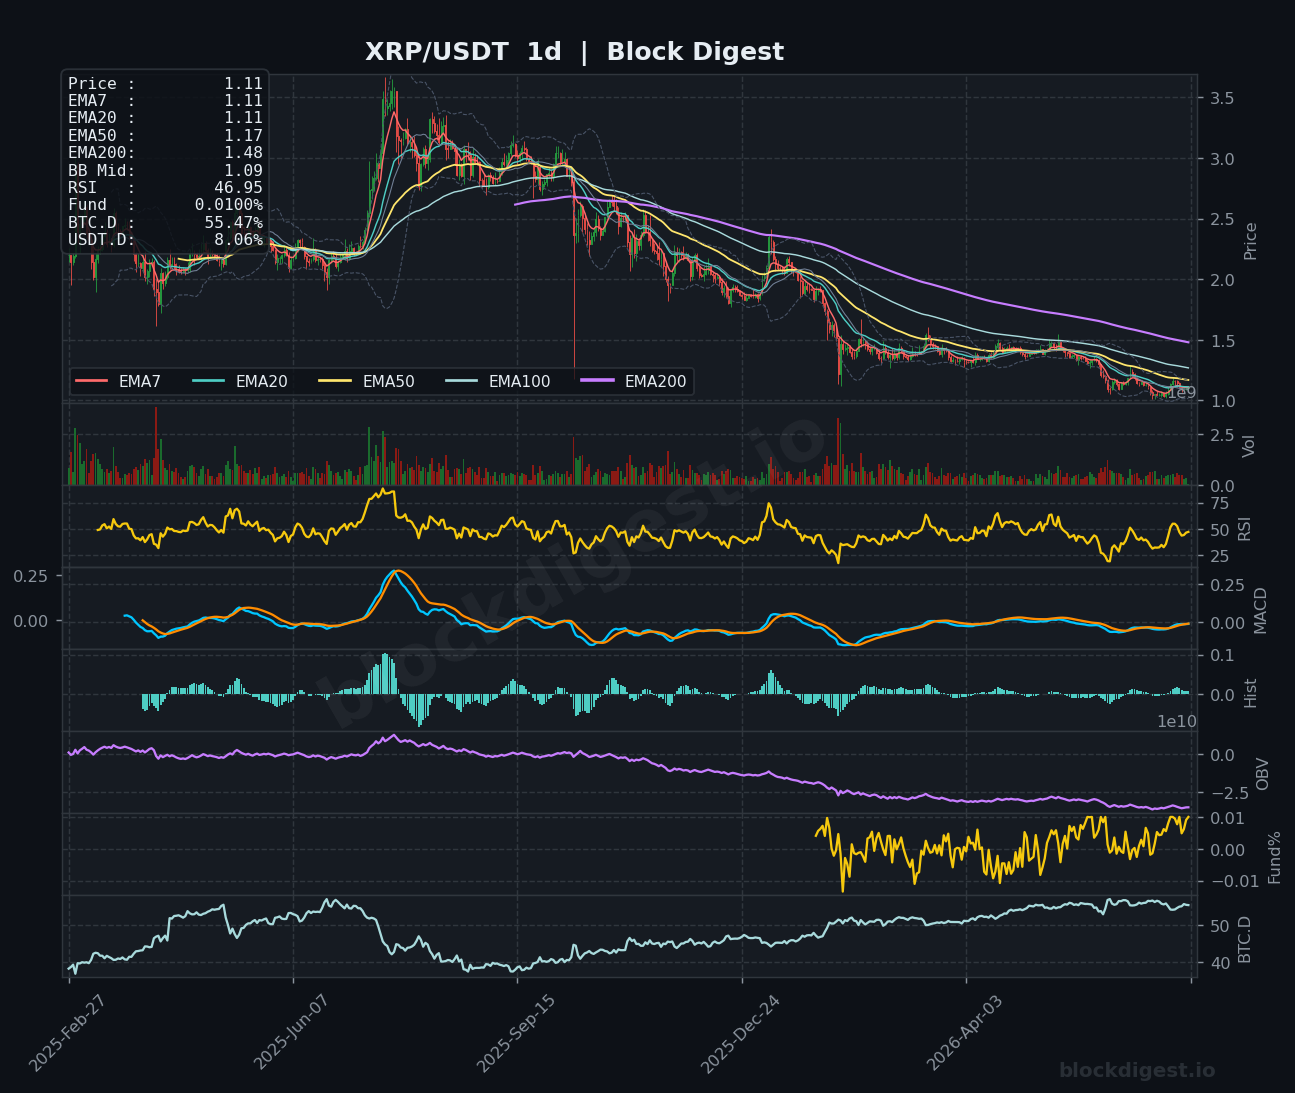
XRP is trading around $1.11, consolidating near a key decision zone after a sharp retreat from the $1.17–$1.18 highs seen earlier this period on the 1h chart. The 1h RSI reads 55.43 with MACD lines converging just above zero, suggesting mild bullish momentum is attempting to rebuild, and OBV on the hourly has trended upward since the lows — a modestly positive accumulation signal. On the 4h chart, however, the broader picture remains challenged: price is sandwiched between the EMA7 ($1.11) and the descending EMA200 ($1.14), with RSI at 51.16 and MACD near flat, indicating the medium-term trend has not yet turned. The daily chart presents the most concerning context — RSI at 46.95, price trading well below the EMA50 ($1.17) and EMA200 ($1.48), and OBV in a prolonged downtrend — though the SEC appeal dismissal and new XRP ETF approvals globally could serve as fundamental underpinning for a base formation near the $1.08–$1.10 support band.
BNB (BNB)
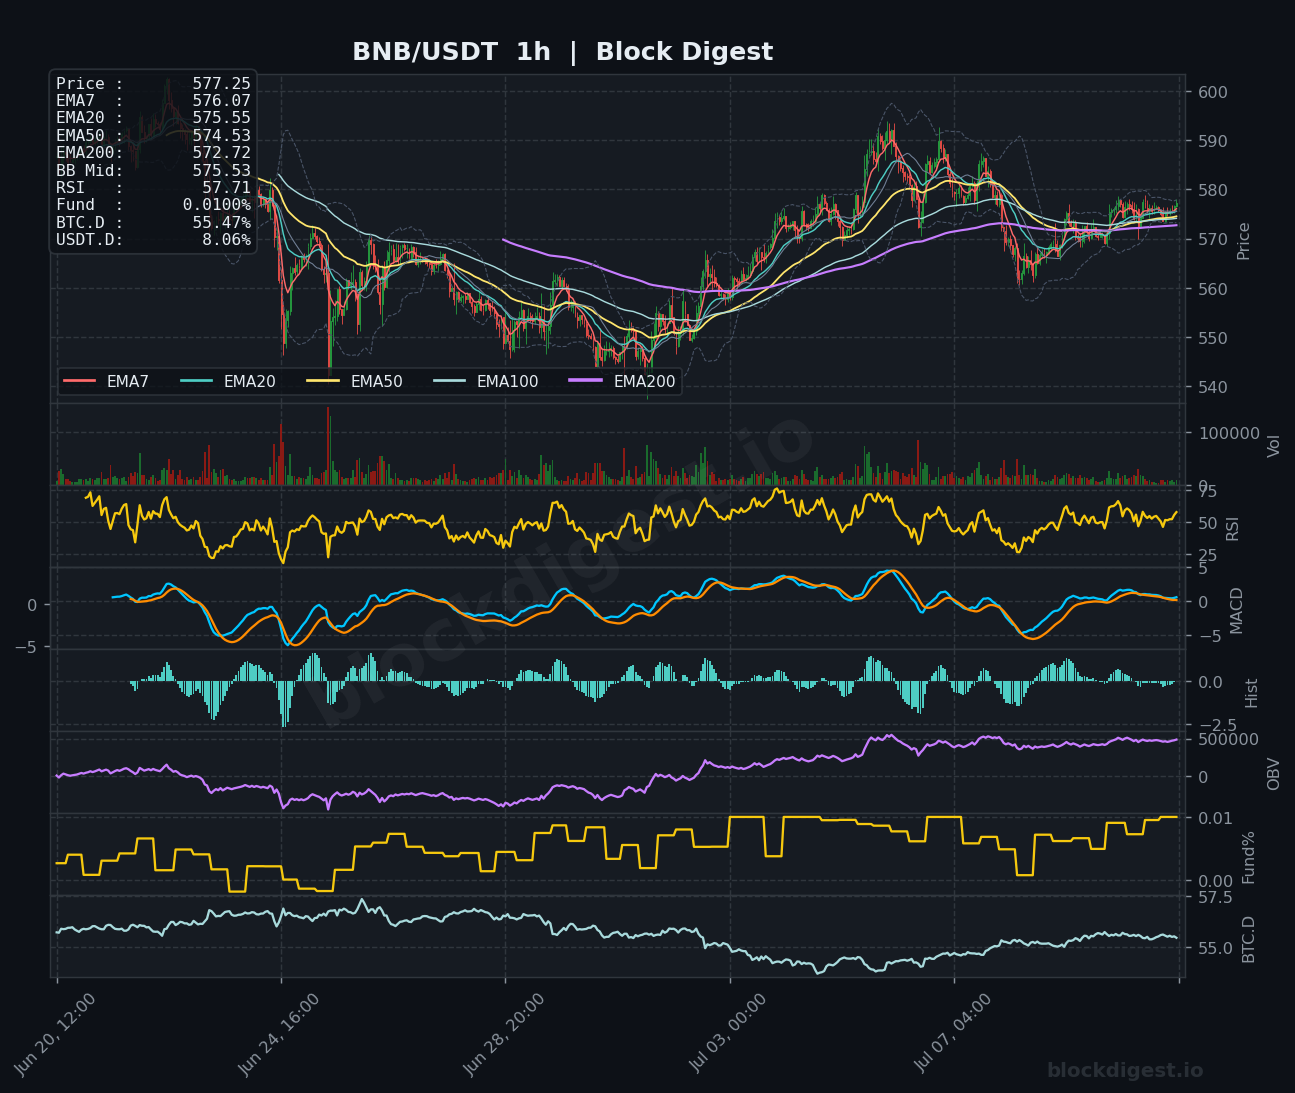
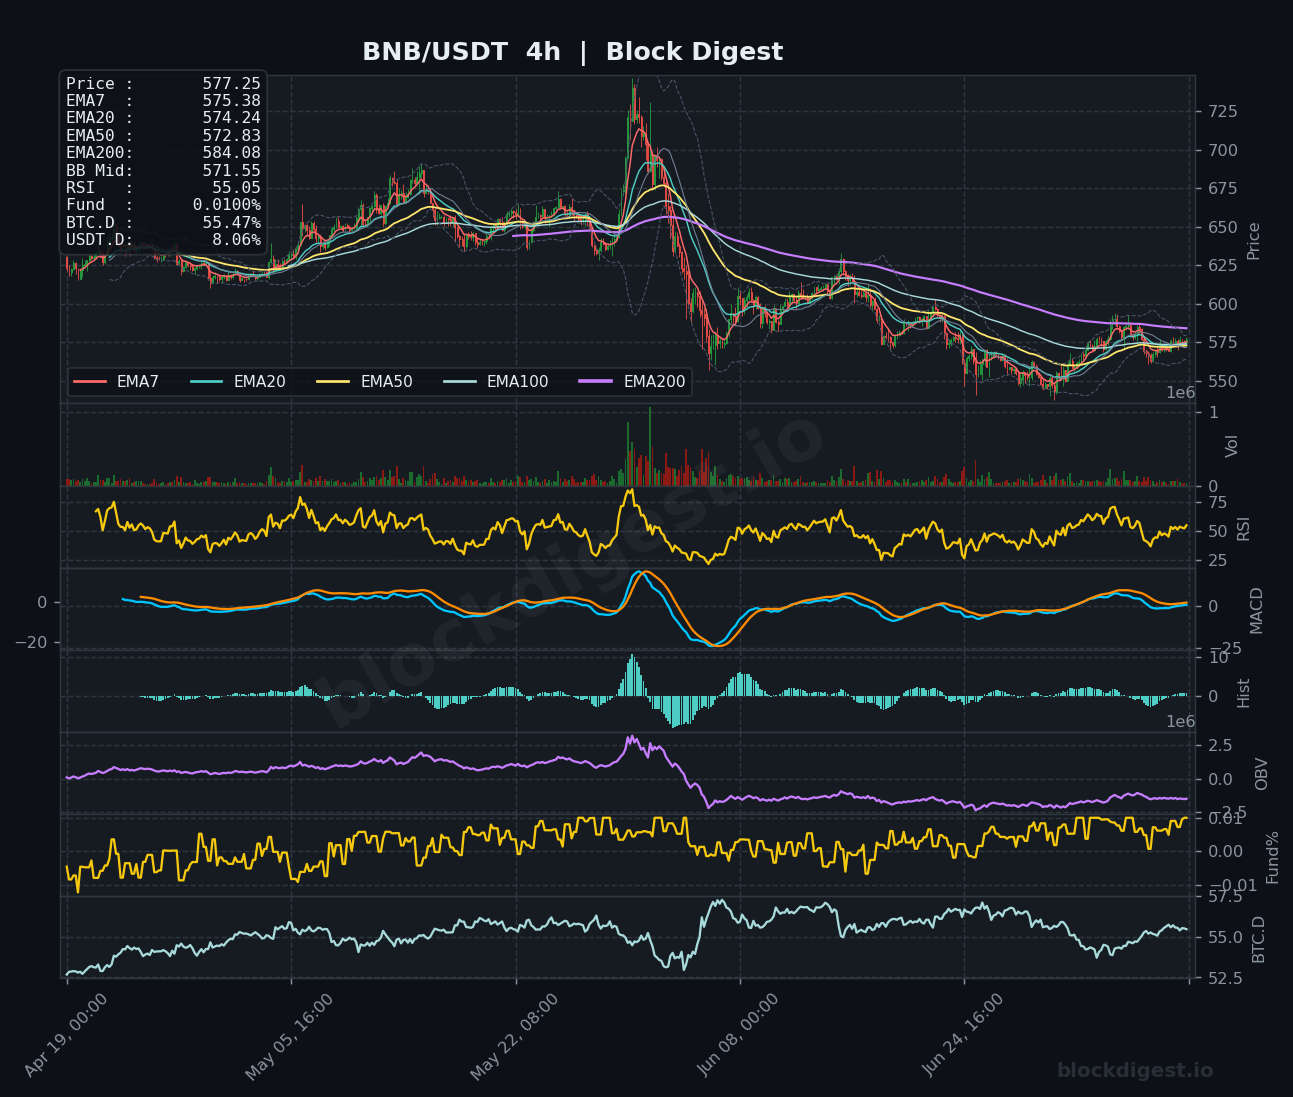
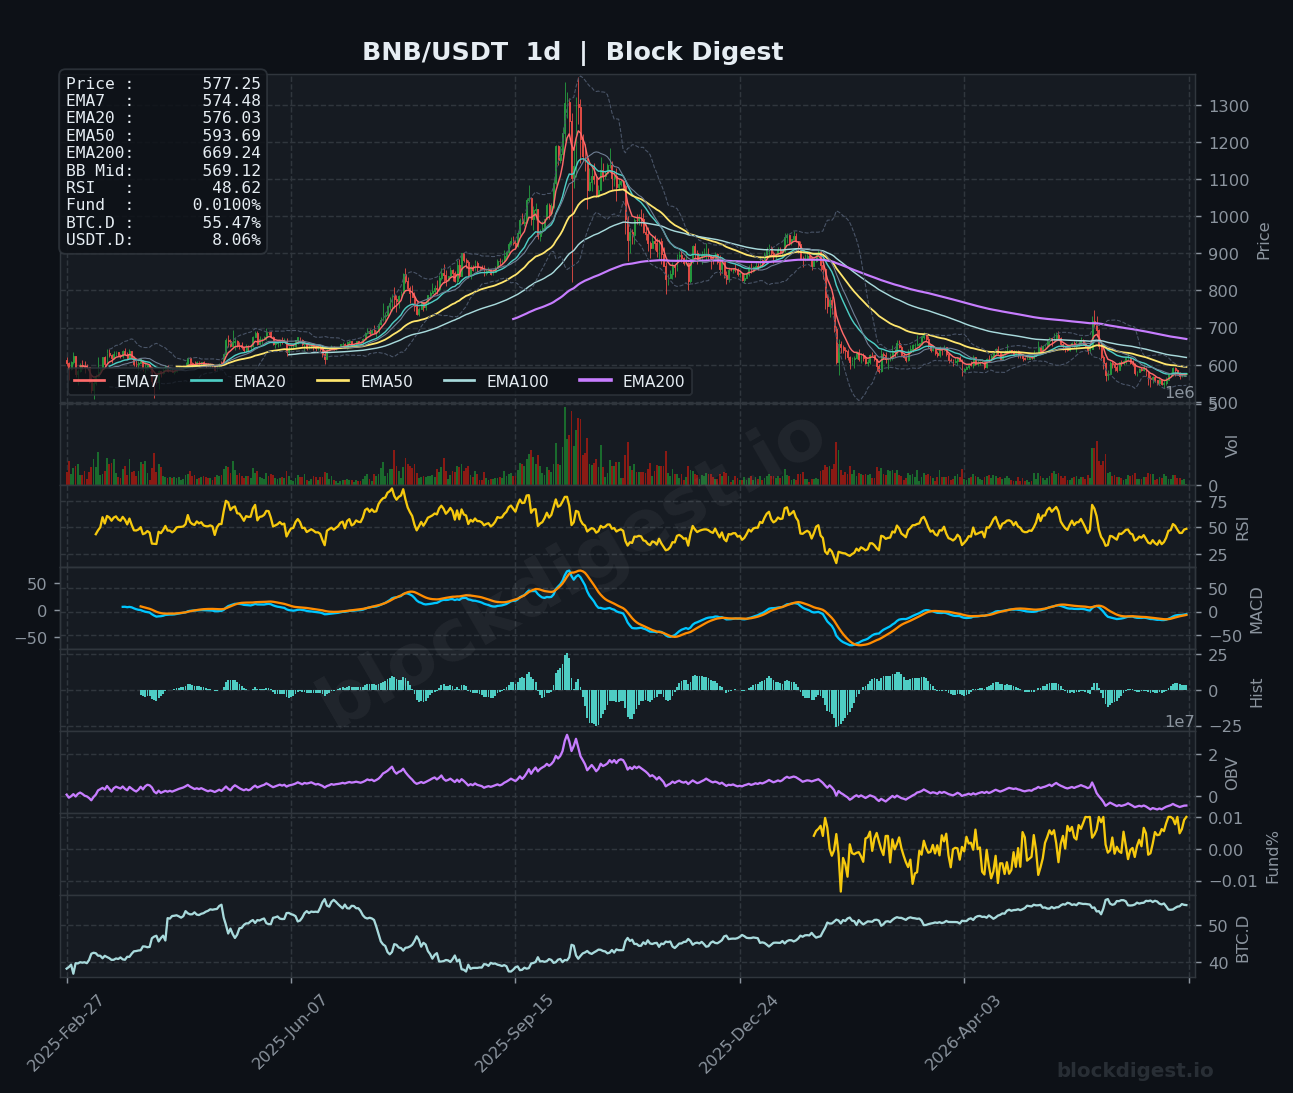
BNB is trading at $577.25, showing relative resilience as the 1h chart displays a bullish EMA stack with price above all short-term moving averages and RSI at 57.71, pointing to modest positive momentum. The 1h MACD is tightening near the zero line with the signal line beginning to curl upward, supporting a cautiously constructive short-term outlook, while OBV has been rising steadily since the recent lows — a constructive accumulation signal. On the 4h chart, RSI holds at 55.05 with price attempting to stabilize above the EMA20 ($574.24) and EMA50 ($572.83), though the EMA200 at $584.08 represents overhead resistance that has capped prior recovery attempts. The daily chart remains structurally bearish with price well below the EMA200 ($669.24) and the EMA50 declining at $593.69, keeping the macro bias negative; BNB needs to reclaim and hold $590–$595 before a more meaningful trend reversal can be argued.
Dogecoin (DOGE)
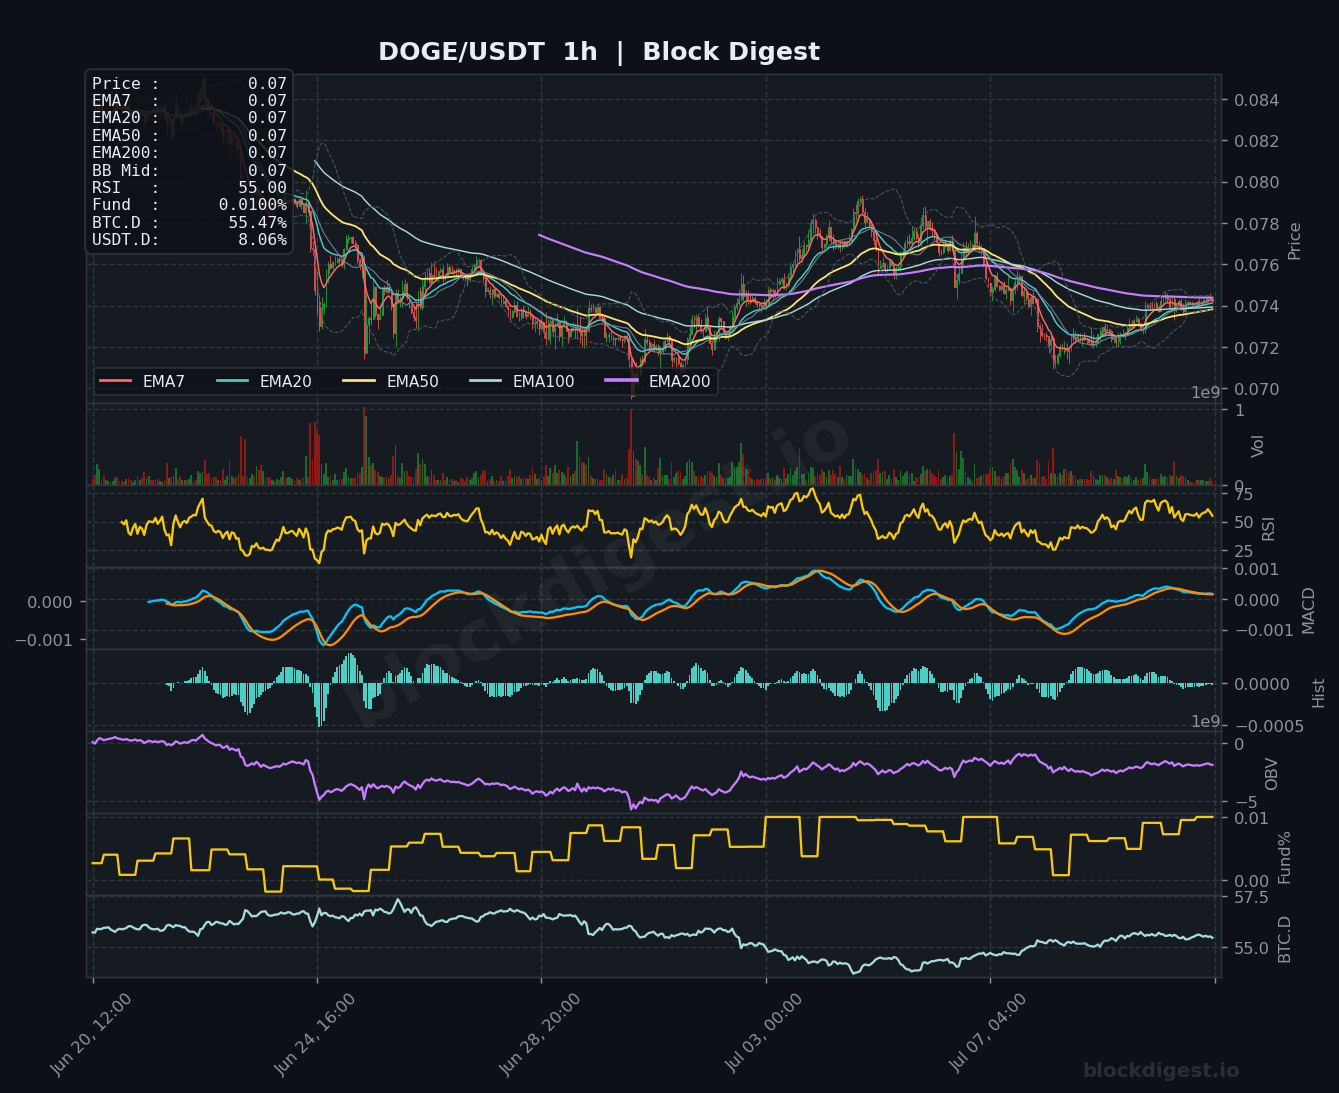
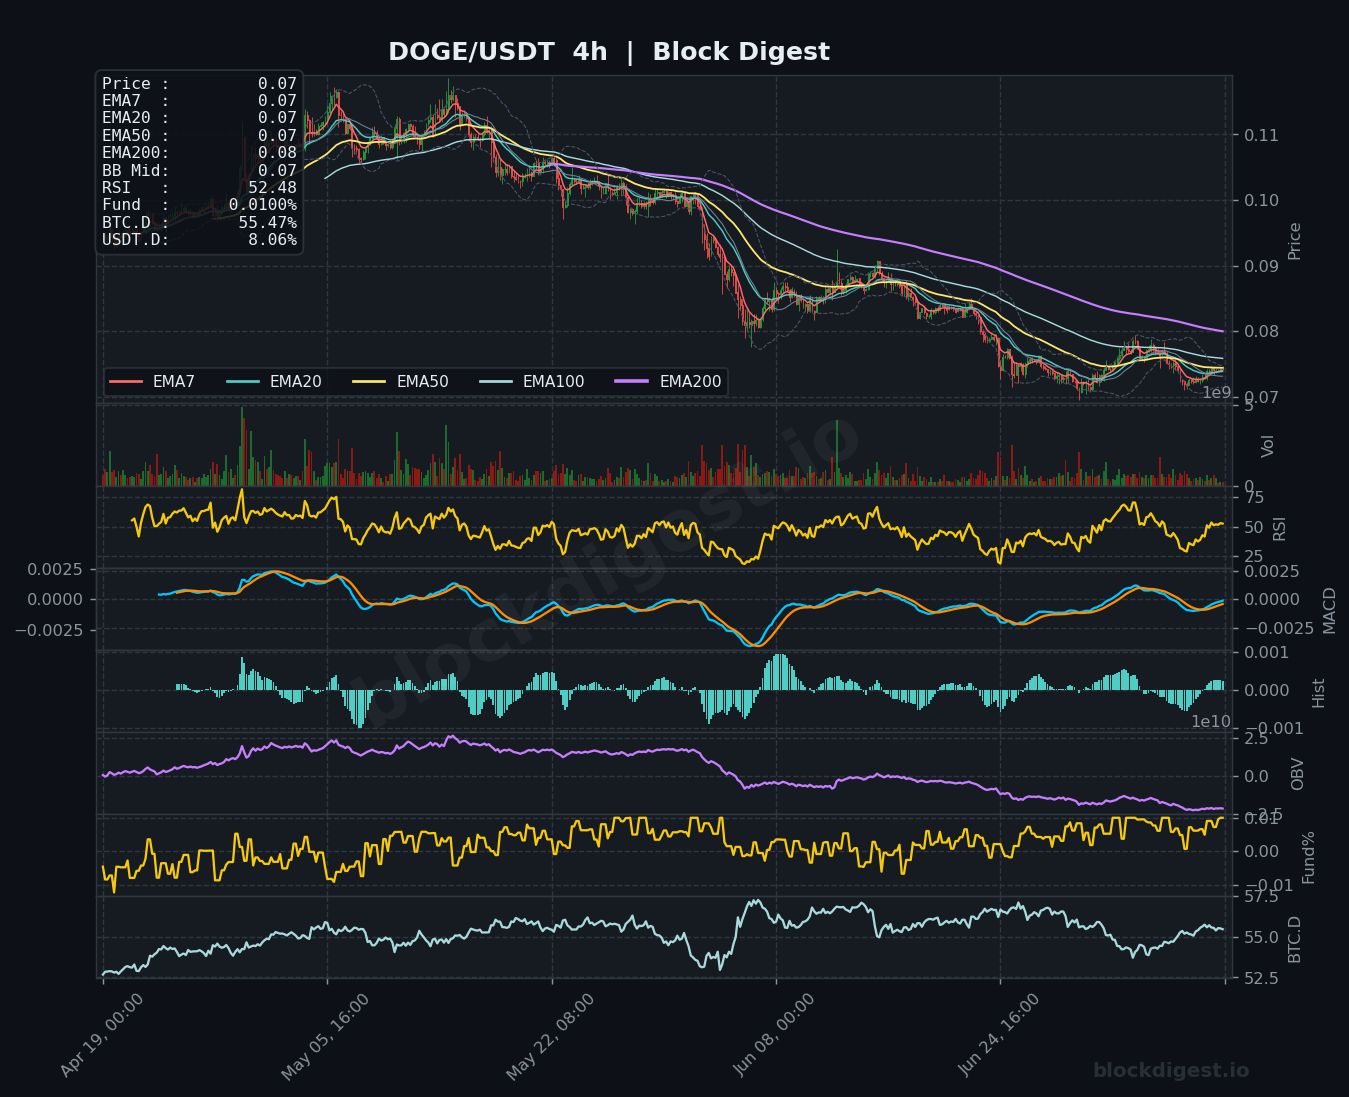
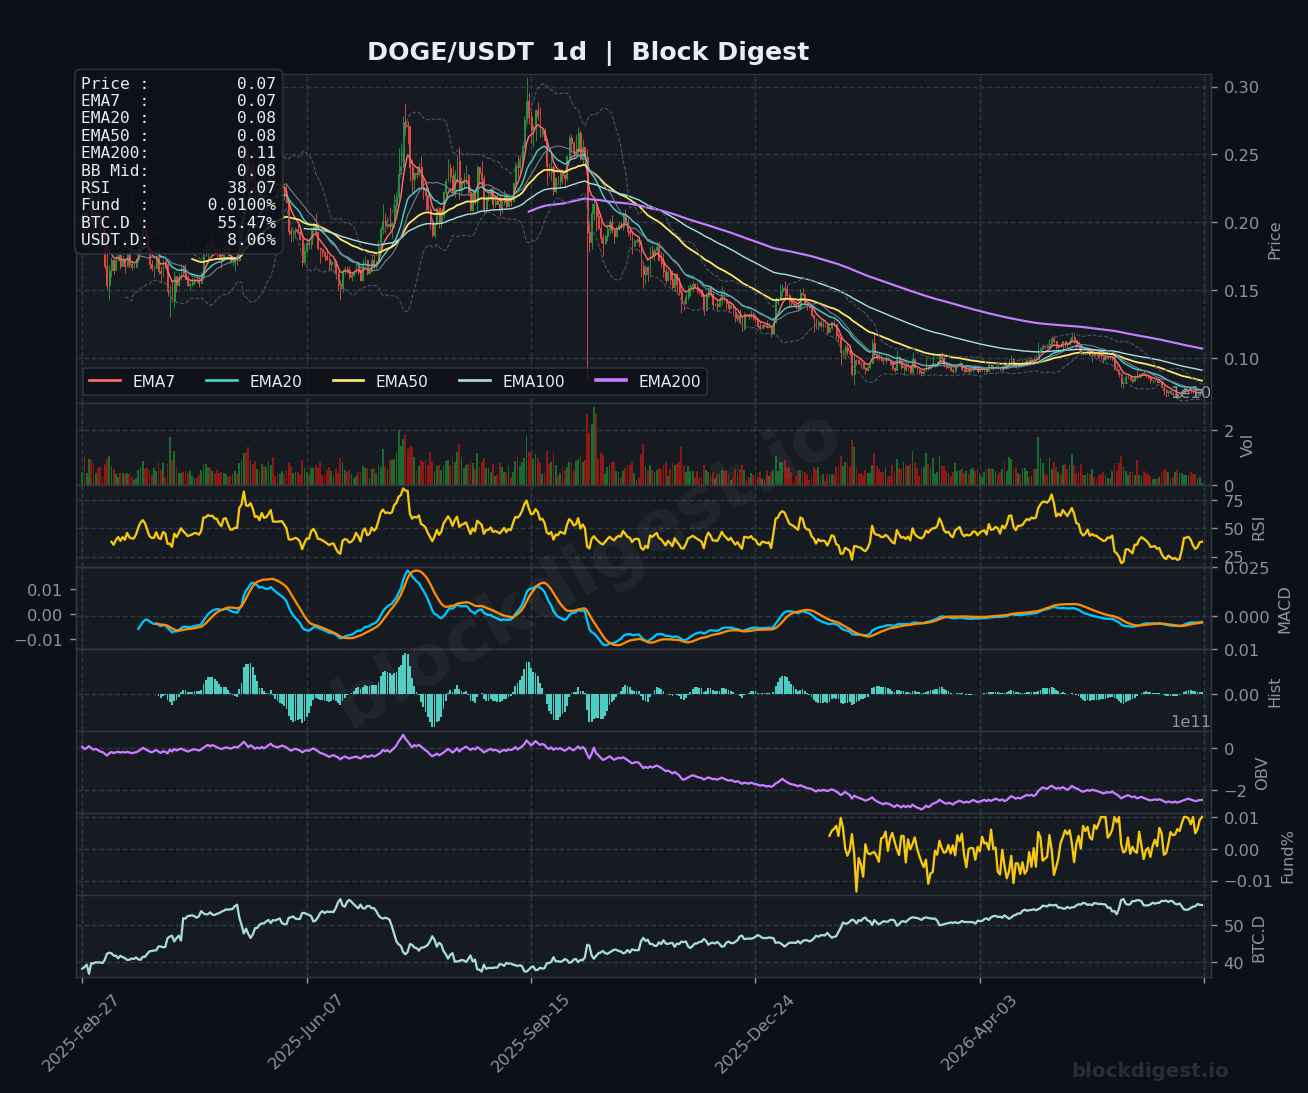
DOGE is trading at approximately $0.074, stuck in a tight consolidation range between $0.072 and $0.076 across the 1h chart, with all short-term EMAs tightly clustered around the current price — a sign of compressed volatility that typically precedes a directional move. The 1h RSI at 55.00 is mildly constructive, and MACD lines are attempting a bullish cross above zero, but volume remains subdued and OBV has shown only a modest recovery from its lows, limiting conviction in any near-term upside. The 4h chart is more telling: RSI at 52.48 and MACD near flat, with price still trading beneath the declining EMA200 at $0.08, confirming that the medium-term trend remains downward. The daily chart is the most bearish of the six coins reviewed today — RSI at 38.07 approaches oversold territory, OBV is in a persistent downtrend, and price has failed to recover above any significant moving average, with the EMA200 at $0.11 an enormous distance overhead; without a clear macro catalyst or BTC-driven risk-on surge, DOGE’s short-term bias remains cautiously bearish.
Litecoin (LTC)
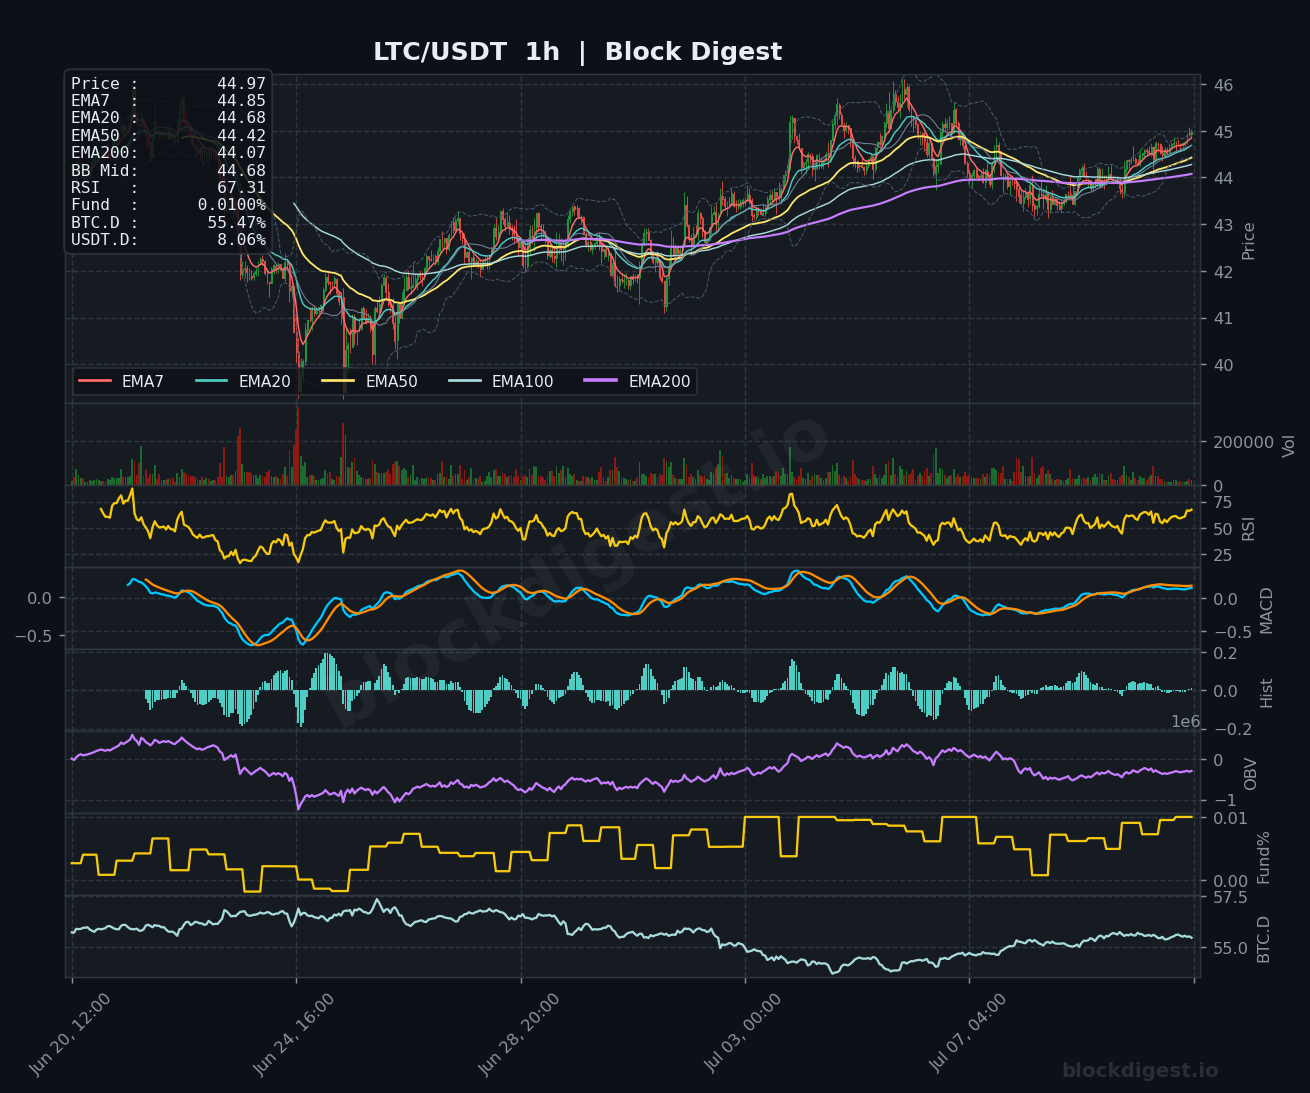
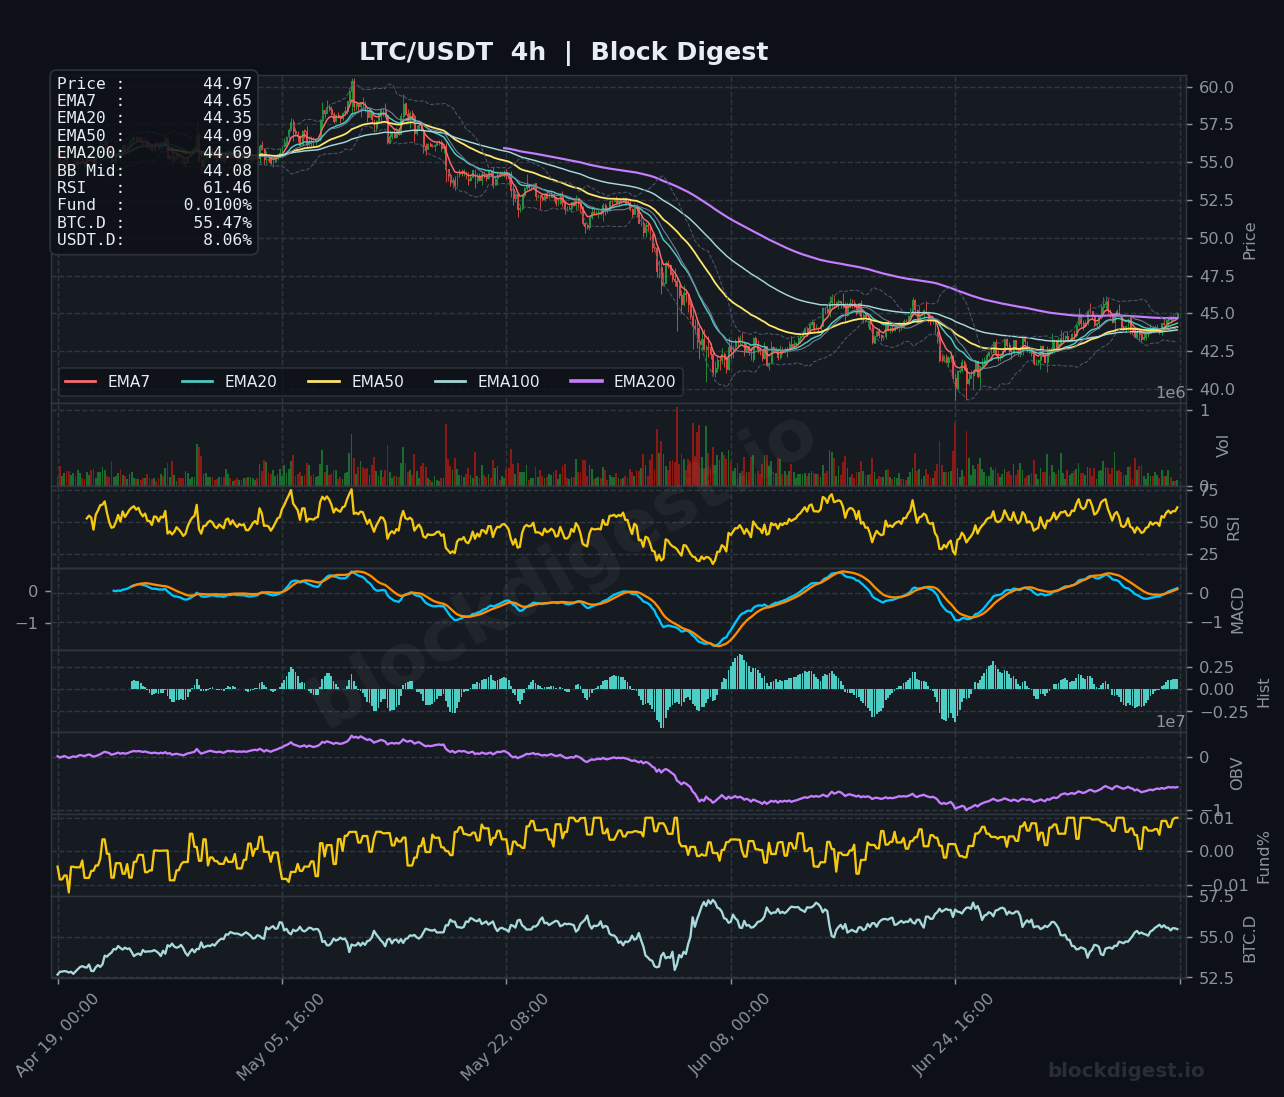
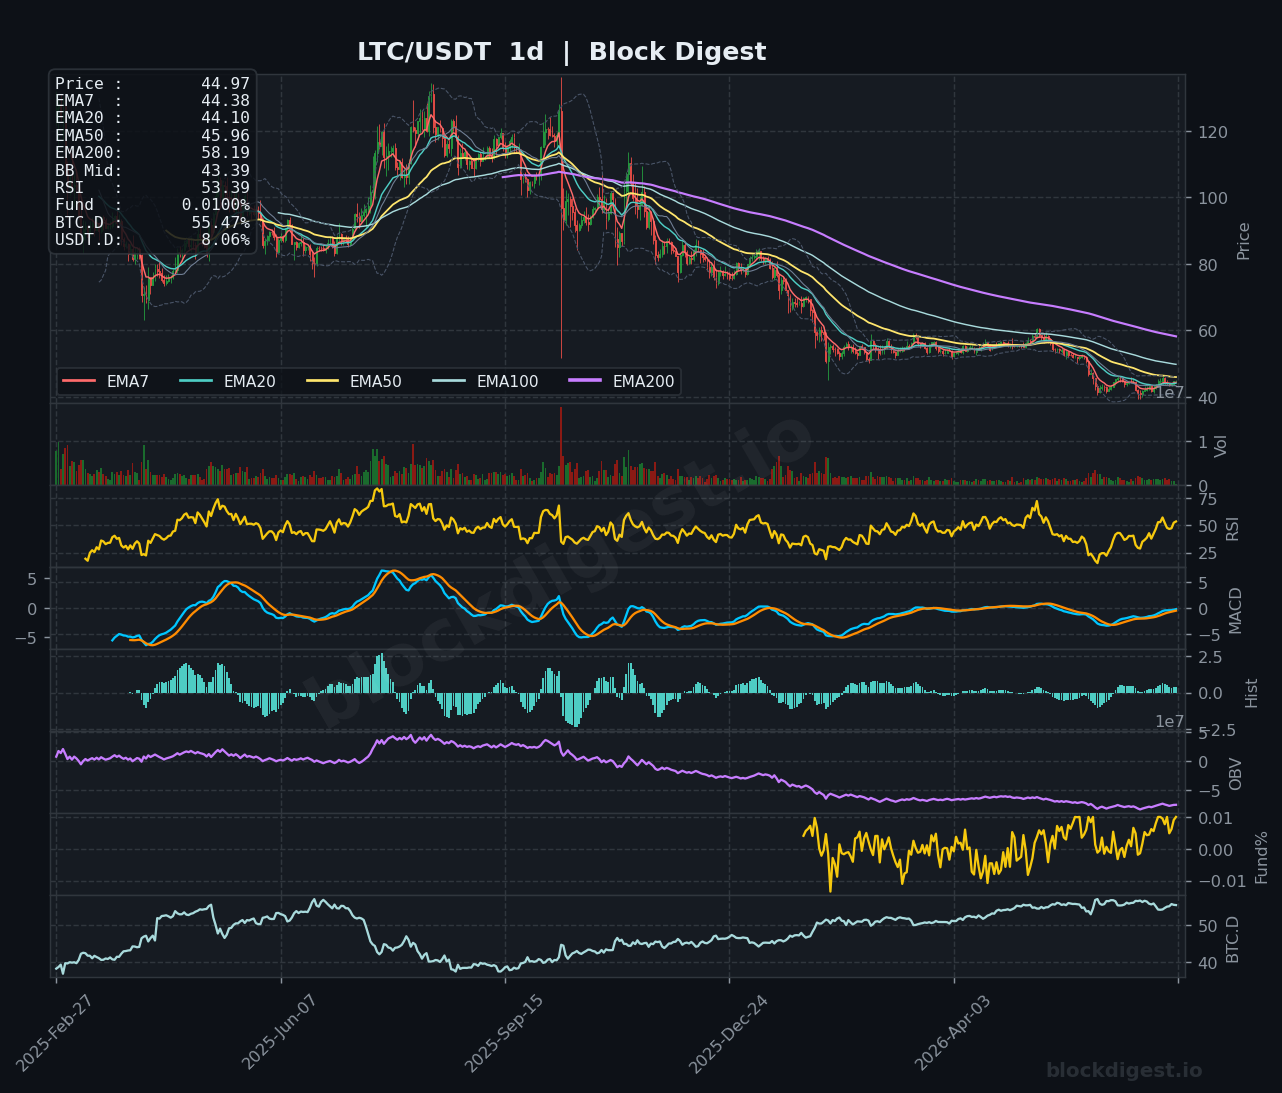
LTC is trading at $44.97 and stands out as today’s relative strength leader among the six coins, with the 1h RSI elevated at 67.31 — approaching overbought but reflecting genuine upward momentum — and price trading above all short-term EMAs on the hourly chart in a clean bullish stack. The 1h MACD is positive and rising with the histogram showing consistent green bars, while OBV on the hourly has steadily climbed, confirming that the recent move from the low-$40s has been accompanied by real buying interest. The 4h chart supports this constructive picture with RSI at 61.46, price above the EMA7 ($44.65), EMA20 ($44.35), and EMA50 ($44.09), and MACD turning positive after a prolonged bearish phase — though the EMA200 at $44.69 on the 4h represents an important near-term test. On the daily chart, RSI at 53.39 with a gently recovering MACD is encouraging for the short-term setup, but the longer-term structure remains challenged given the deep decline from prior highs and the EMA200 at $58.19 acting as distant overhead resistance; immediate support to watch is the $43.50–$44.00 zone.
TRON (TRX)
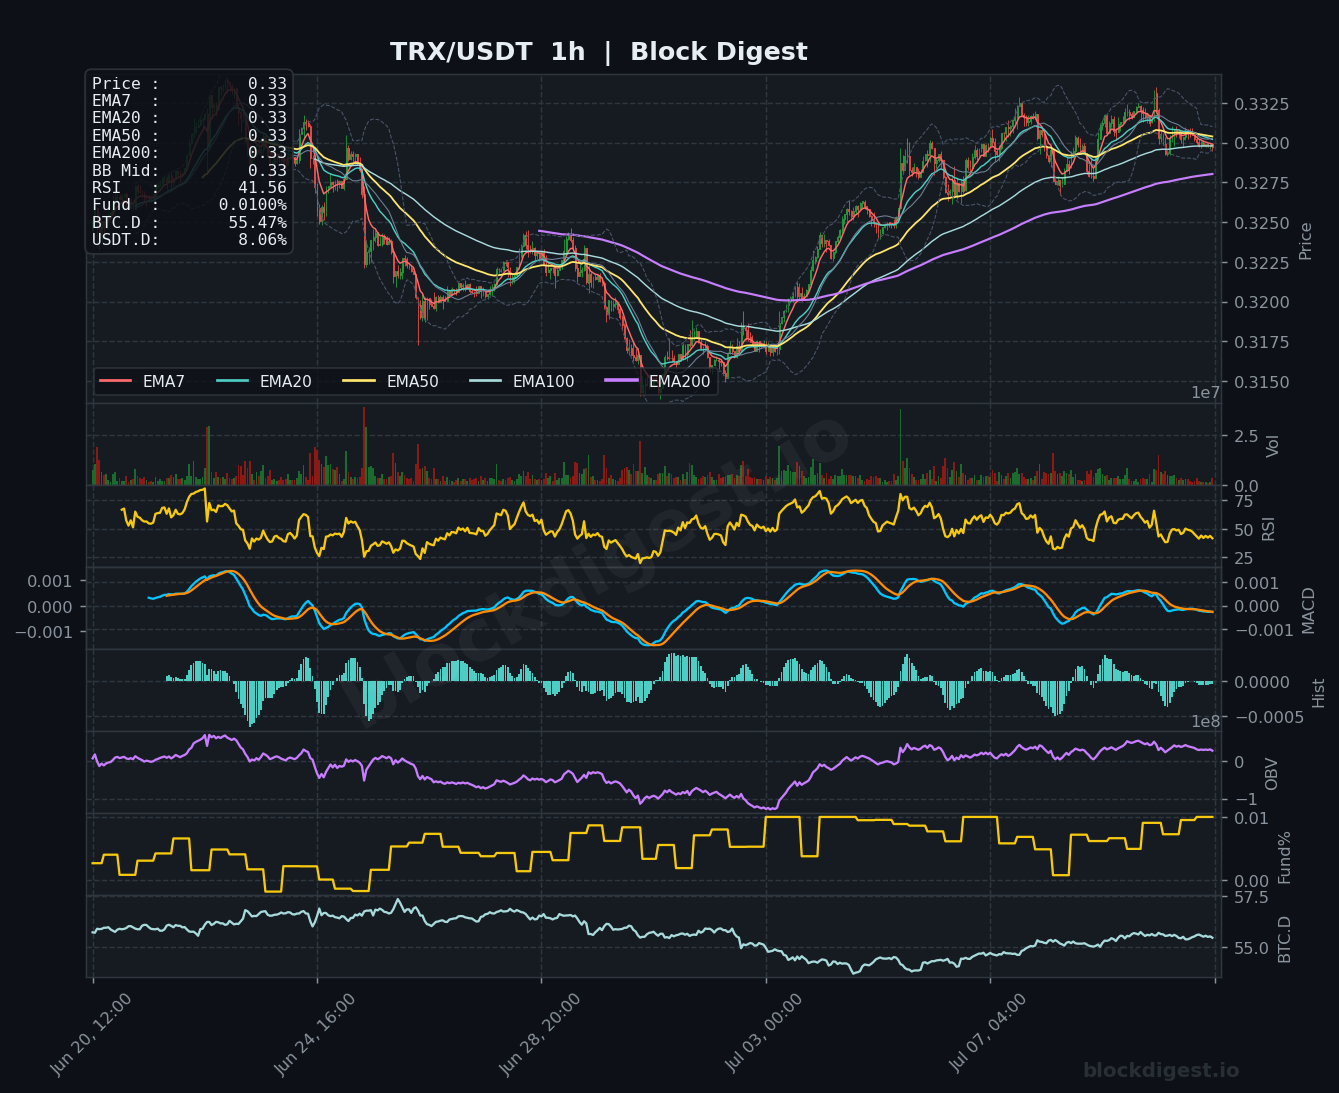
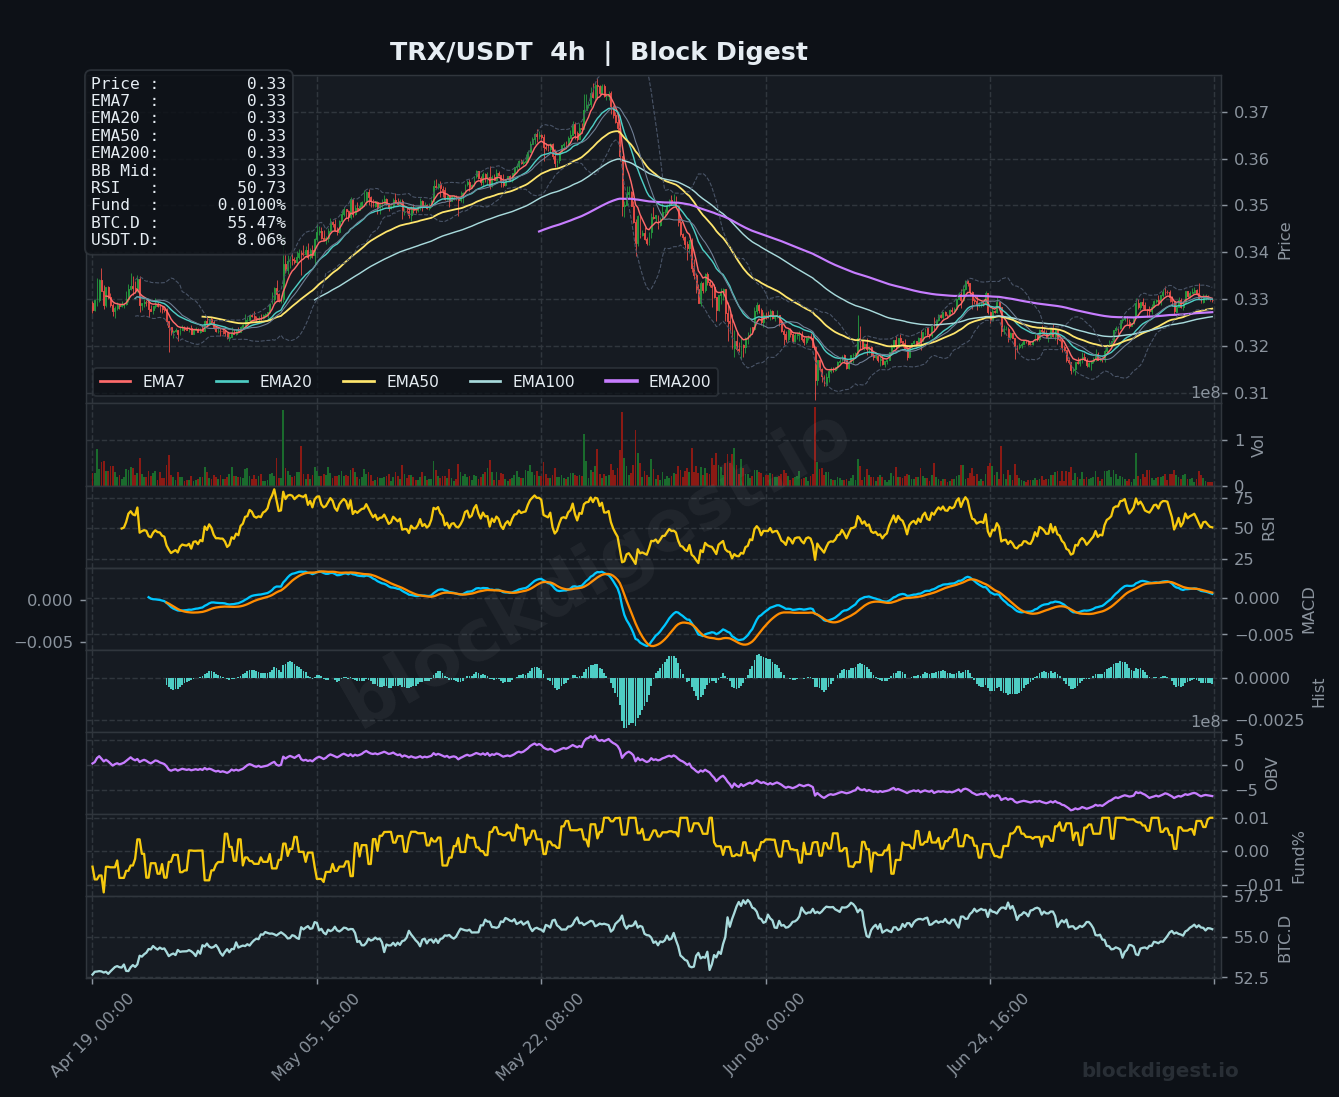
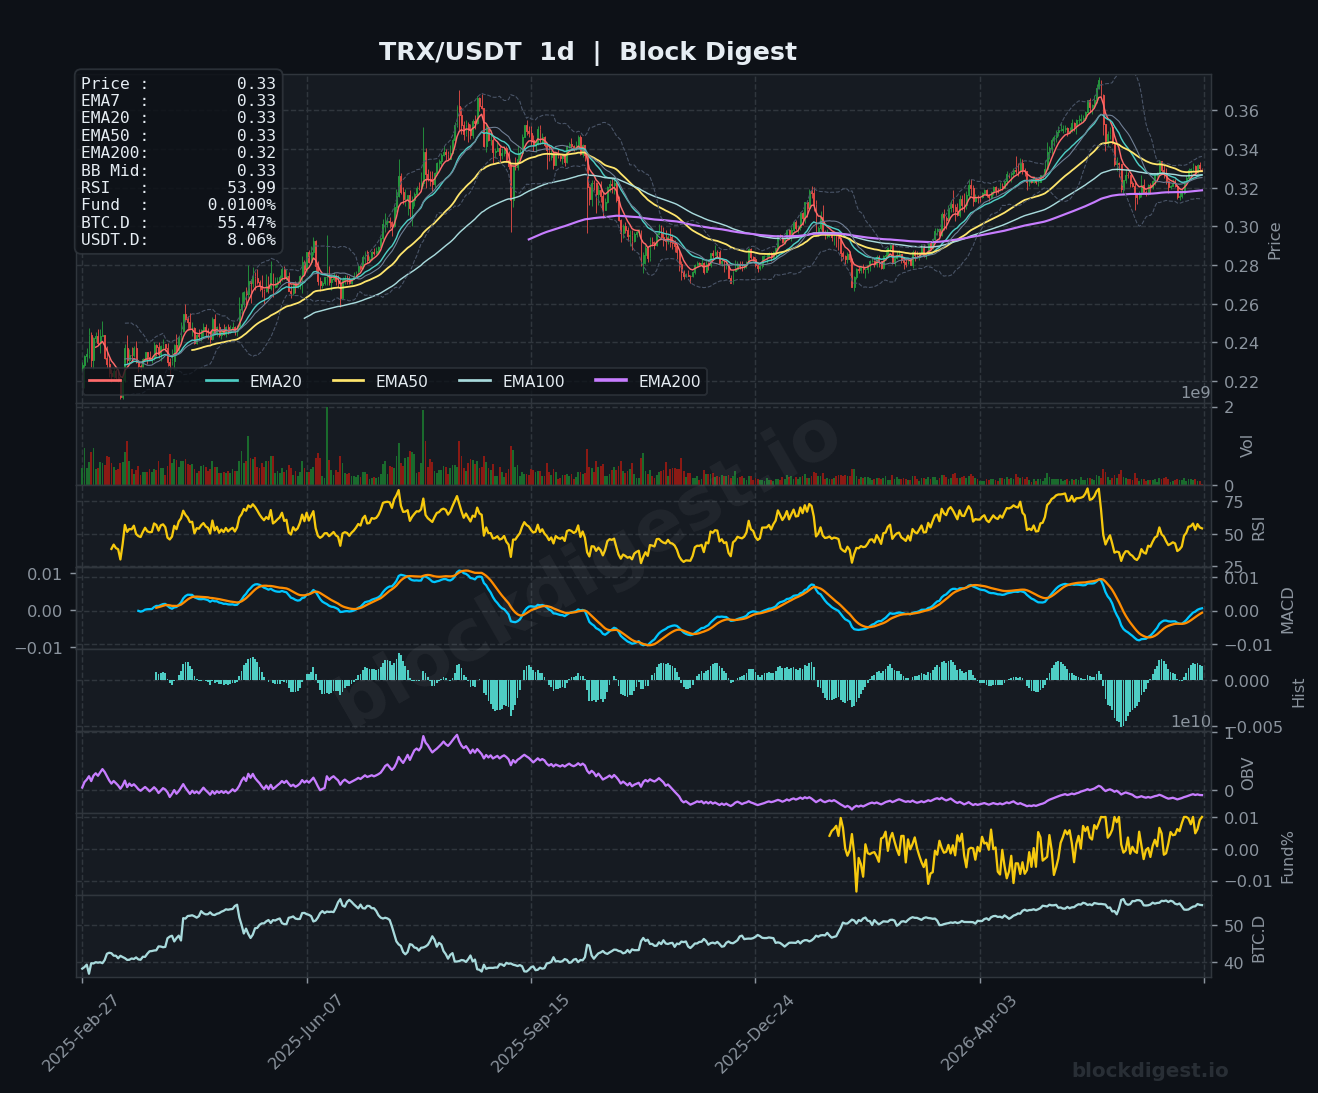
TRX is trading at $0.33, in a pullback phase on the 1h chart after reaching highs near $0.3325, with RSI at 41.56 dipping toward oversold territory and the MACD histogram turning slightly negative — suggesting near-term selling pressure is present. All short-term EMAs on the 1h are tightly compressed around $0.33, reflecting a market in equilibrium, while OBV has held relatively flat over the recent session, indicating neither aggressive accumulation nor distribution. The 4h chart presents a more neutral picture with RSI at 50.73 and MACD hovering near zero; price has been basing in the $0.31–$0.335 range over the past several weeks, and the EMA200 at $0.33 on the 4h is now acting as both support and resistance in this compression zone. The daily chart is notably more constructive than most peers: RSI at 53.99 with MACD lines both positive and above zero, and the EMA200 at $0.32 acting as dynamic support — TRX has demonstrated stronger relative macro structure than XRP, DOGE, or SOL on the daily timeframe, and the $0.315–$0.32 zone represents a meaningful near-term support level to monitor.
Altcoin Outlook
The altcoin space as a whole on July 11, 2026 reflects a market in selective consolidation, with BTC dominance at 55.47% and USDT.D at 8.06% keeping broad-based altcoin rallies suppressed and rewarding only coins with specific fundamental catalysts or relative technical strength. Litecoin is the clear standout from a momentum perspective today, with the strongest short-term EMA alignment and the highest RSI readings across timeframes, while TRX demonstrates the most resilient
Disclaimer: This analysis is for informational purposes only and does not constitute financial advice. Cryptocurrency markets are highly volatile and unpredictable. All trading decisions should be made based on your own research and risk tolerance. Block Digest is not responsible for any financial losses incurred as a result of acting on this content.
Stay Ahead of the Market
Follow BlockDigest for crypto market intelligence, research and real-time updates.


