
Market Context
BTC dominance sits at a notable 56.51% as of June 27, 2026, signaling that capital rotation into altcoins remains suppressed and Bitcoin continues to command an outsized share of total crypto market capitalization. USDT dominance at 8.58% reflects a still-elevated stablecoin positioning, indicating cautious risk appetite among market participants who have not yet meaningfully deployed capital back into altcoins. The broader altcoin complex reflects this hesitation, with most major alts trading below key structural EMAs on the daily timeframe and showing persistent selling pressure from prior cycle highs.
Solana (SOL)
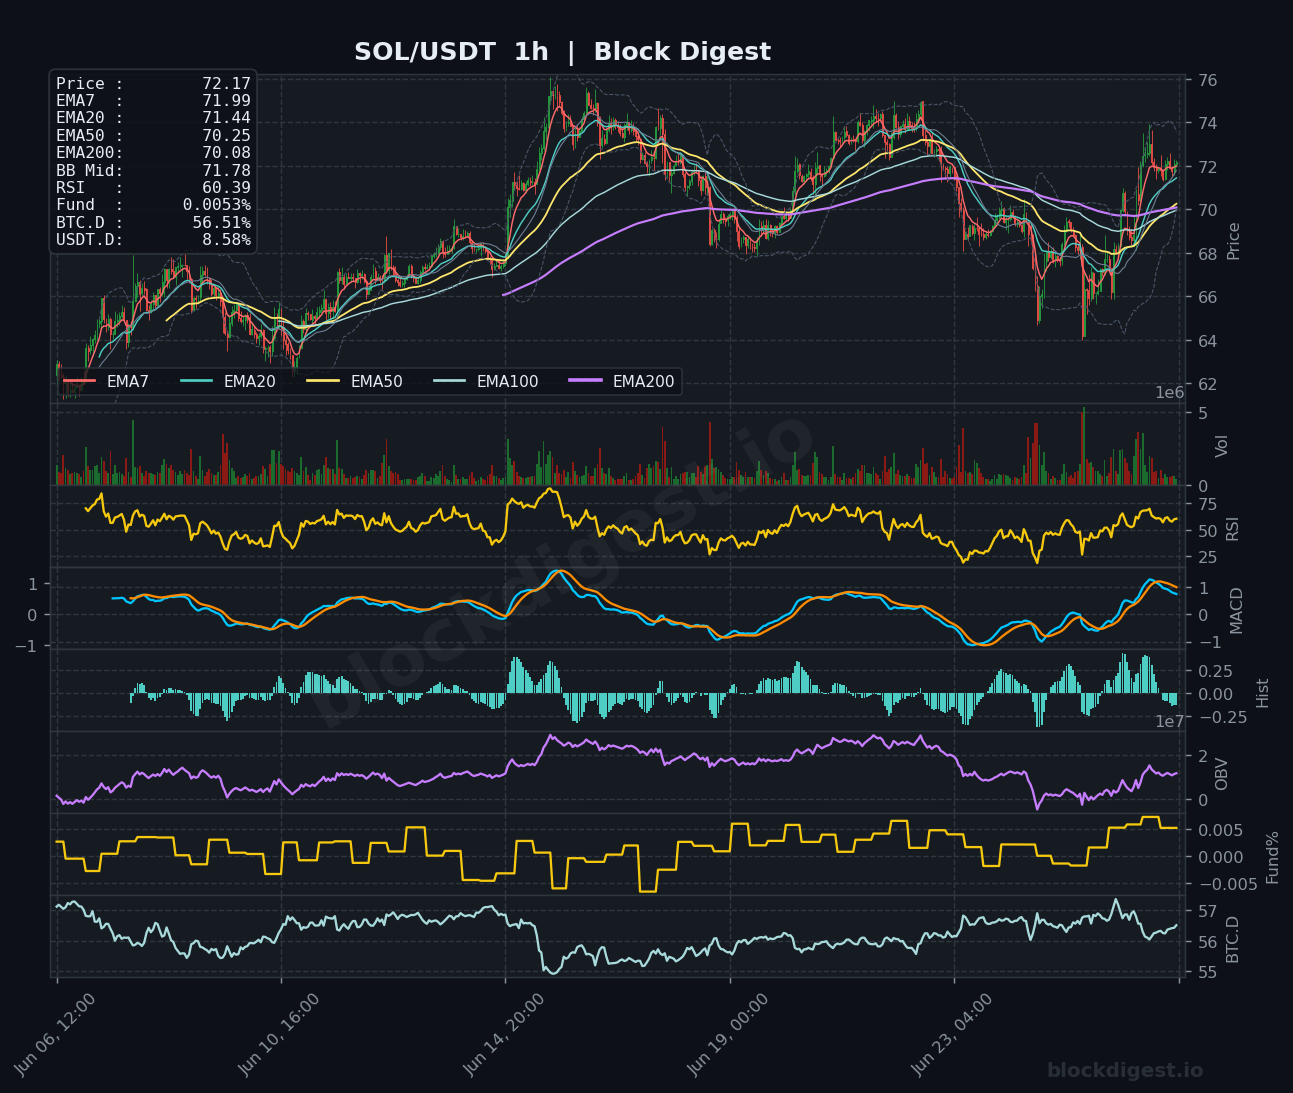
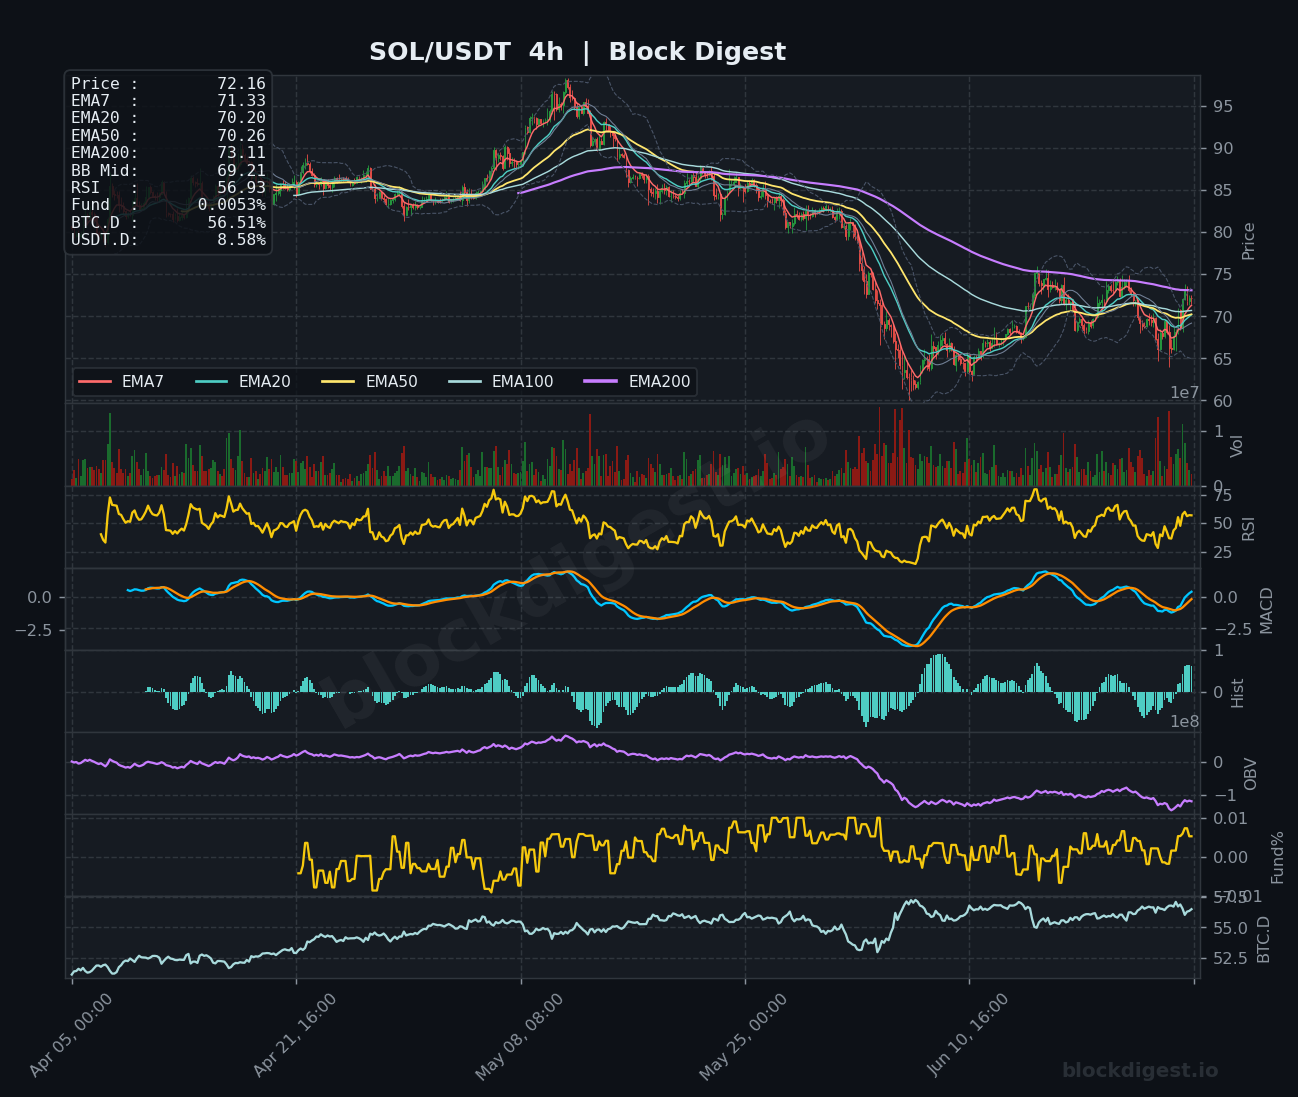
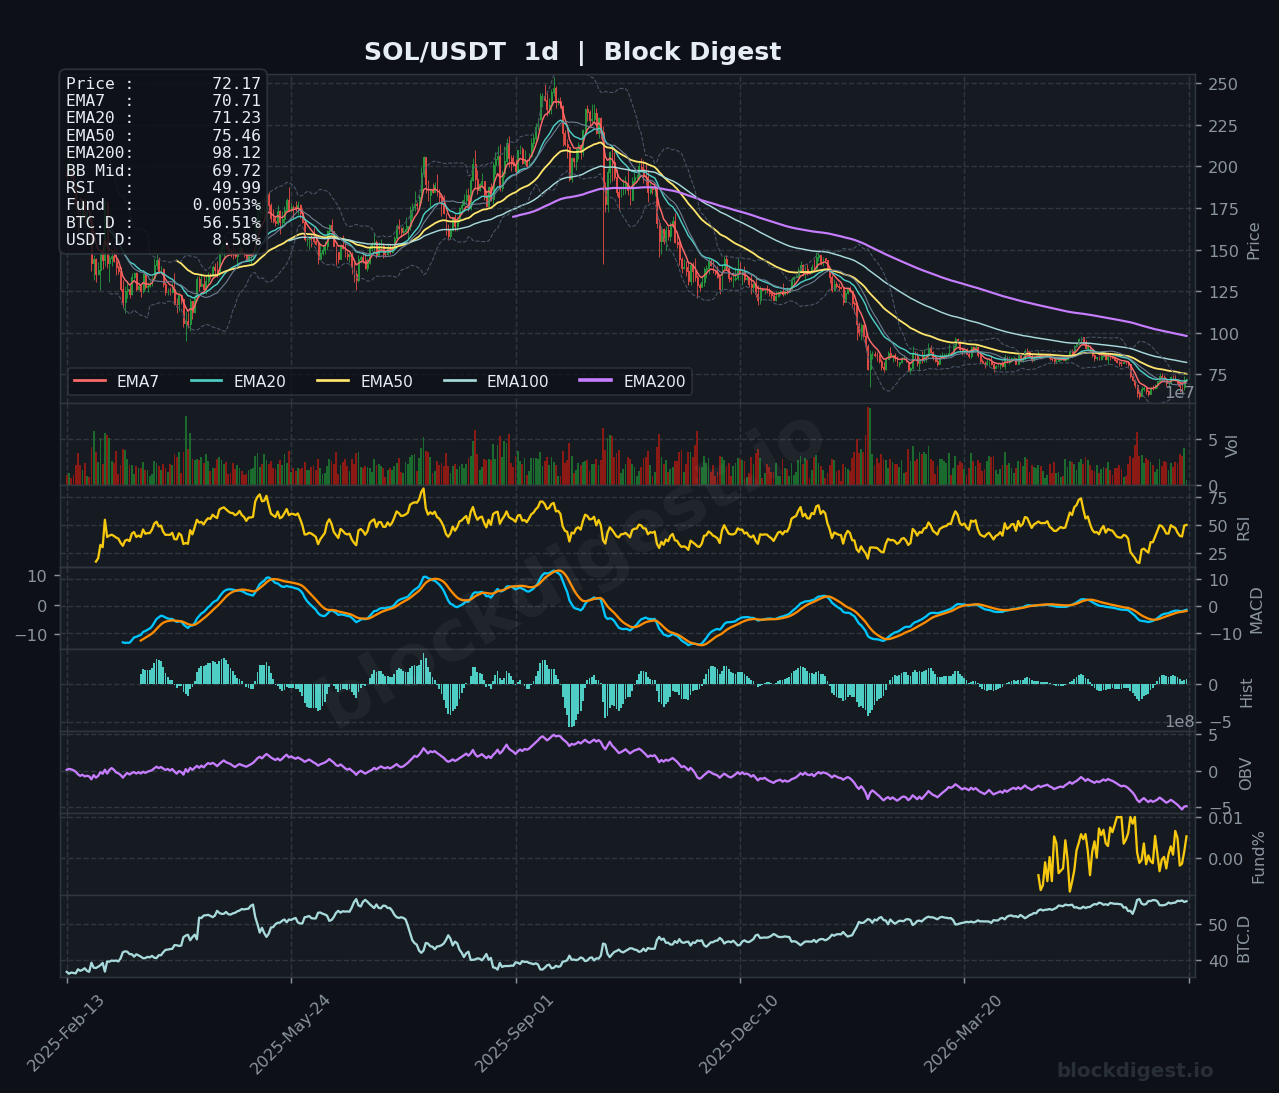
SOL is currently trading at $72.17, sitting just above its short-term EMAs (EMA7 at $71.99, EMA20 at $71.44) on the 1-hour chart, suggesting a nascent near-term recovery attempt after a sharp drawdown from highs near $75. On the 4-hour chart, price remains well below the EMA200 at $73.11 and all EMAs are in bearish alignment, while the daily chart paints a grim structural picture with price at $72.17 deeply below the EMA200 at $98.12 — confirming the coin is still in a long-term downtrend. The 1-hour RSI at 60.39 and an emerging MACD bullish cross offer short-term hope, but the 4-hour RSI at 56.93 and daily RSI hovering near 50 suggest momentum is far from convincingly bullish. Key resistance lies at $74–$75 and support at $65–$66; the short-term bias is cautiously neutral to slightly bullish on the hourly but remains bearish on higher timeframes.
XRP (XRP)
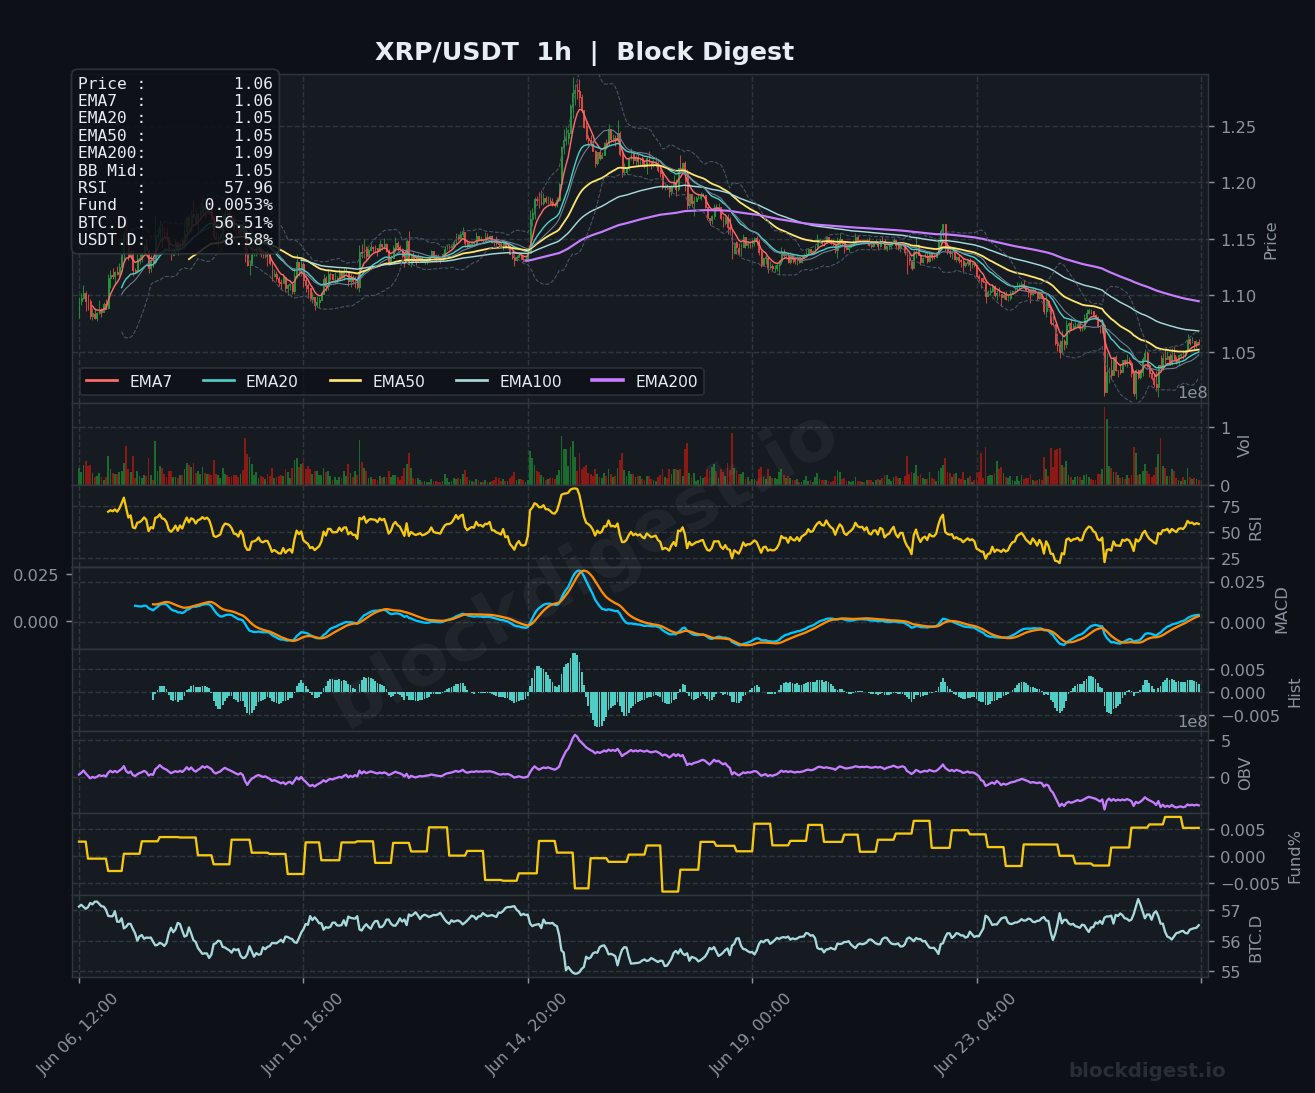
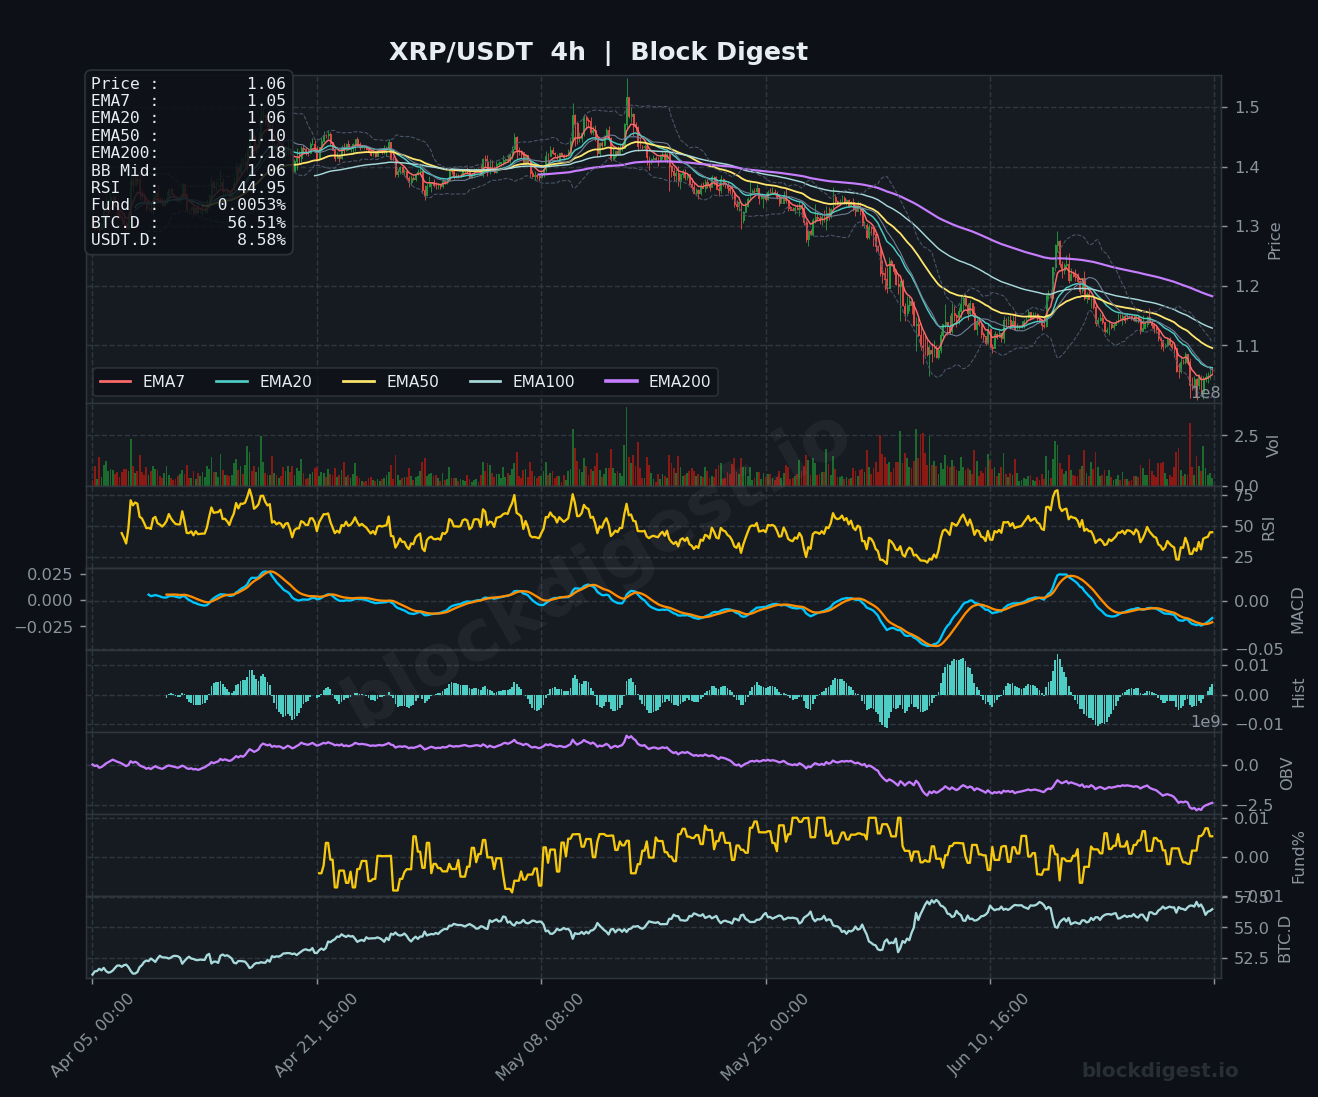
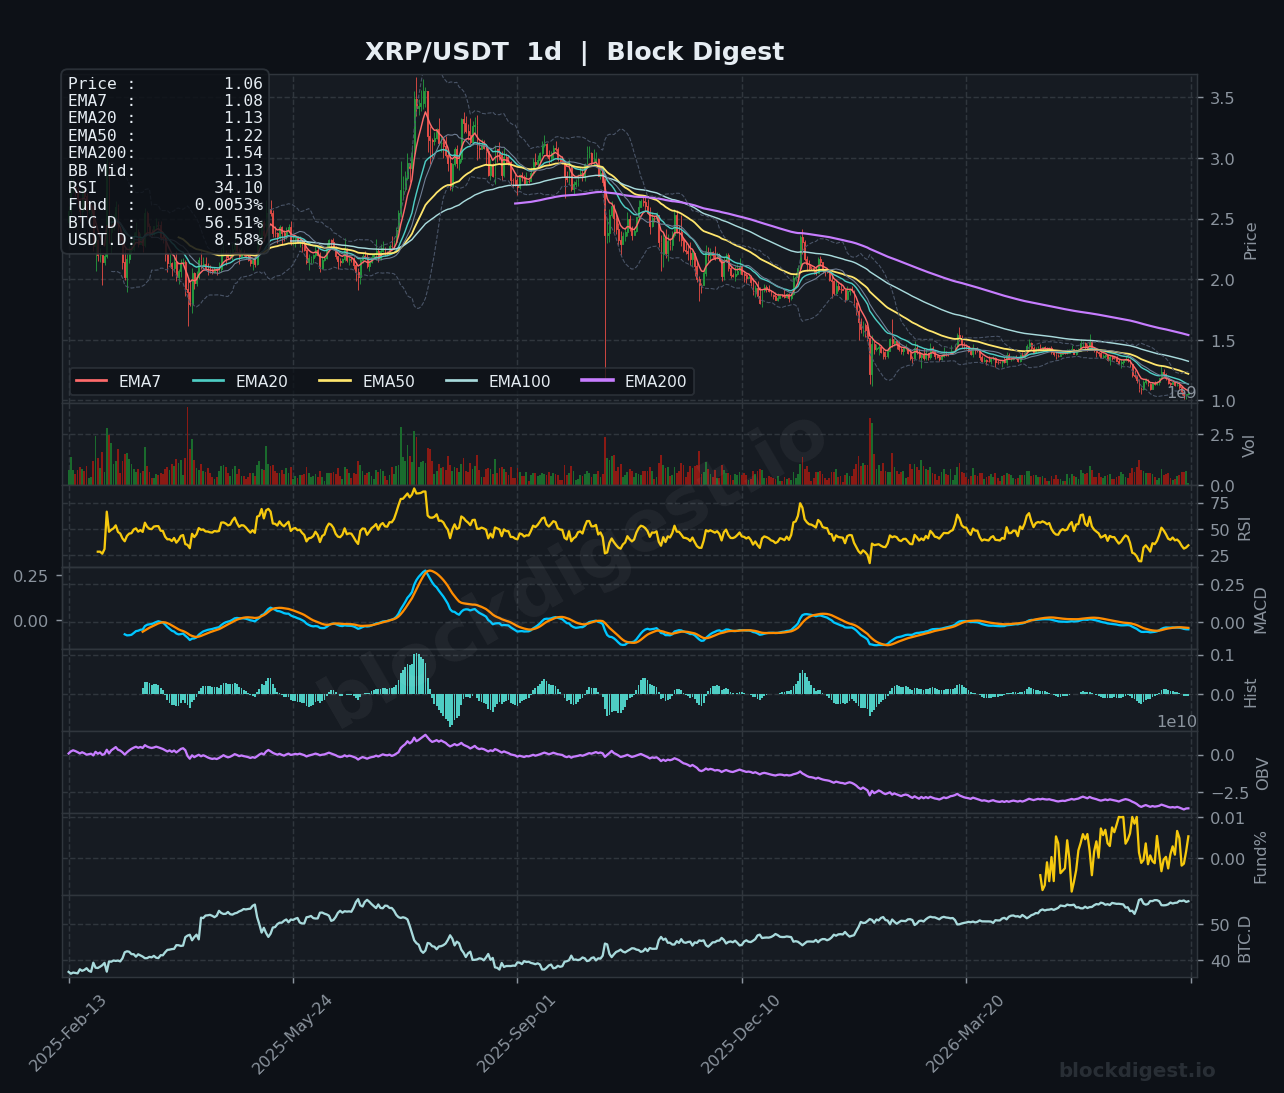
XRP is trading at $1.06, struggling beneath a bearish EMA stack on both the 1-hour and 4-hour charts, with the EMA200 on the daily at $1.54 acting as a distant but decisive structural overhead. The 4-hour RSI at 44.95 reflects sustained selling pressure, while the daily RSI at a deeply oversold 34.10 suggests the asset may be approaching exhaustion on the downside — though no confirmed reversal signal is yet present. The daily MACD remains negative with the signal line still below zero, and the OBV trend on both 4-hour and daily is consistently declining, confirming persistent distribution. Immediate support sits at the $1.00 psychological level, with resistance at $1.10–$1.15; the short-term bias is bearish, with the only saving grace being a mildly oversold daily RSI that could attract dip buyers.
BNB (BNB)
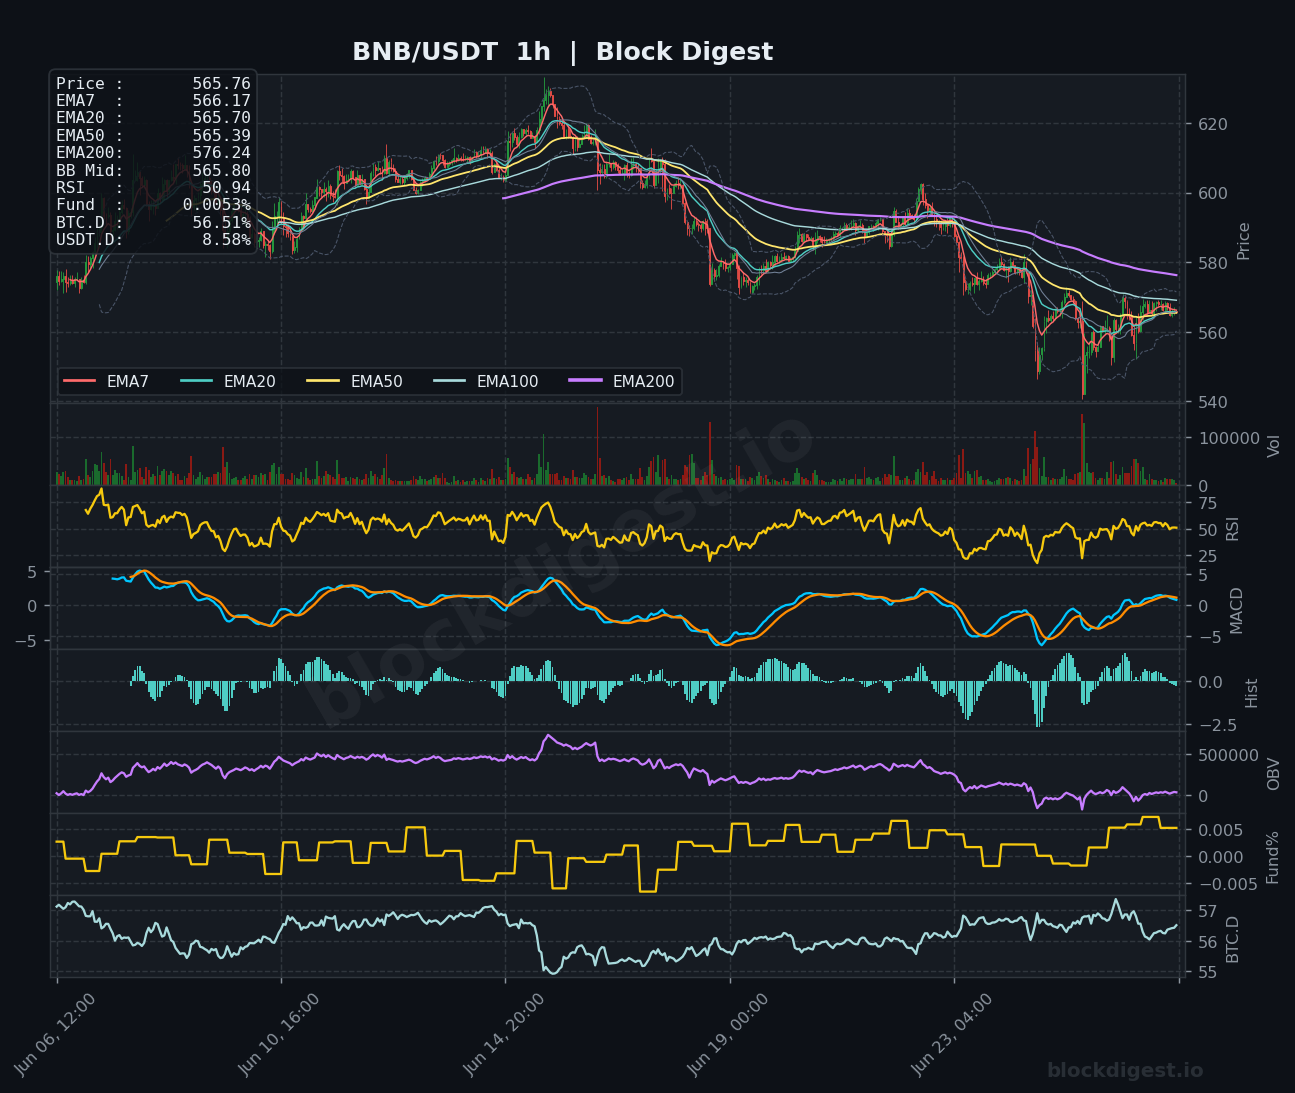
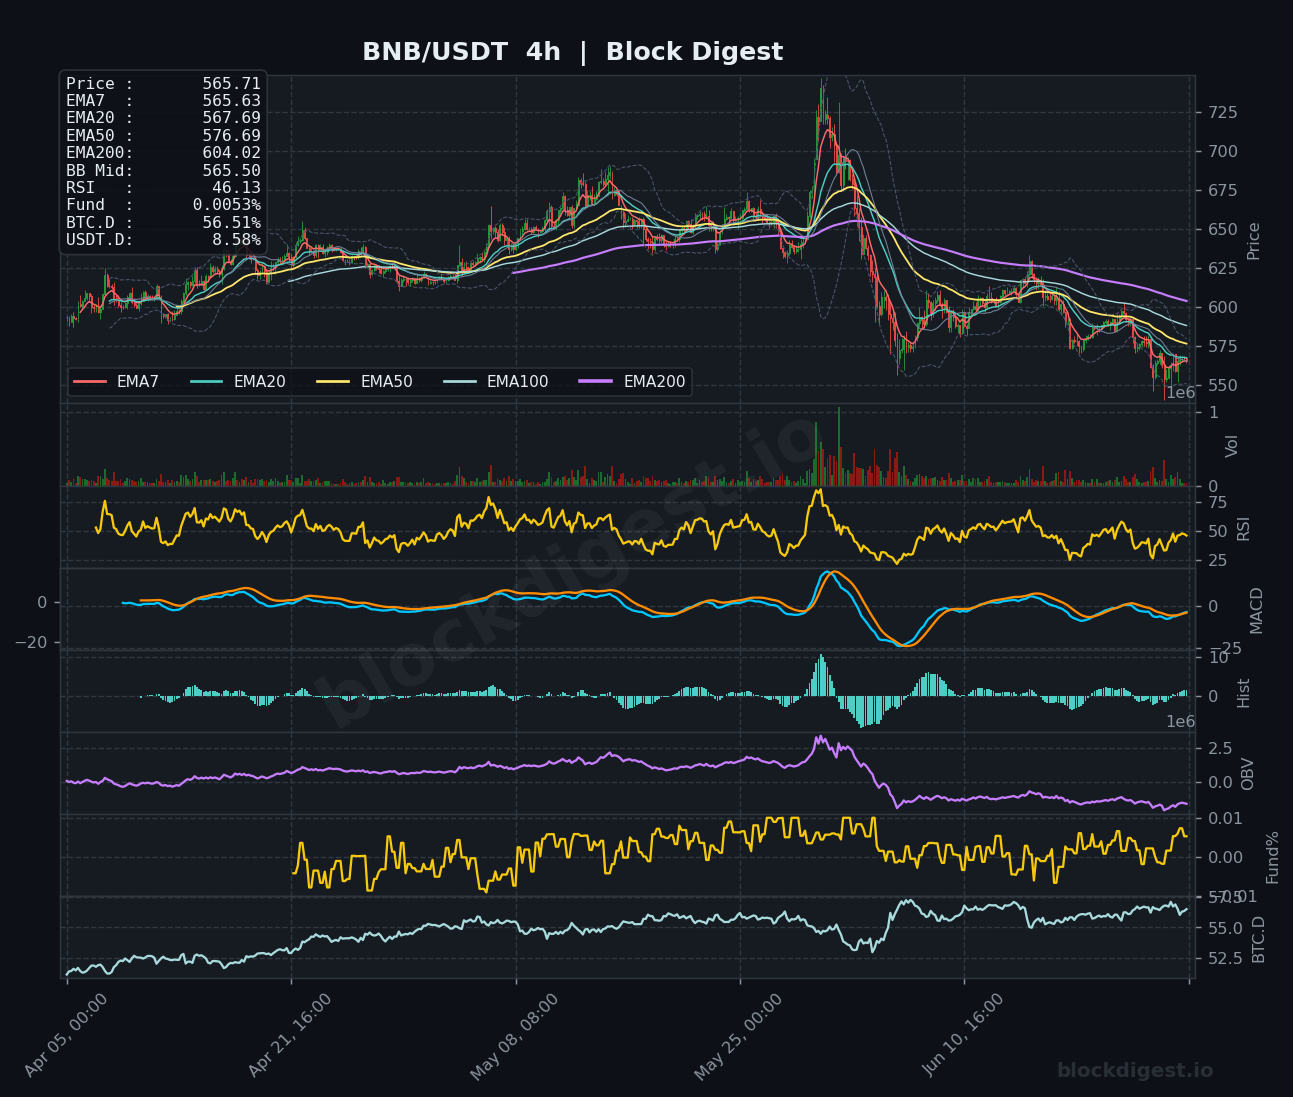
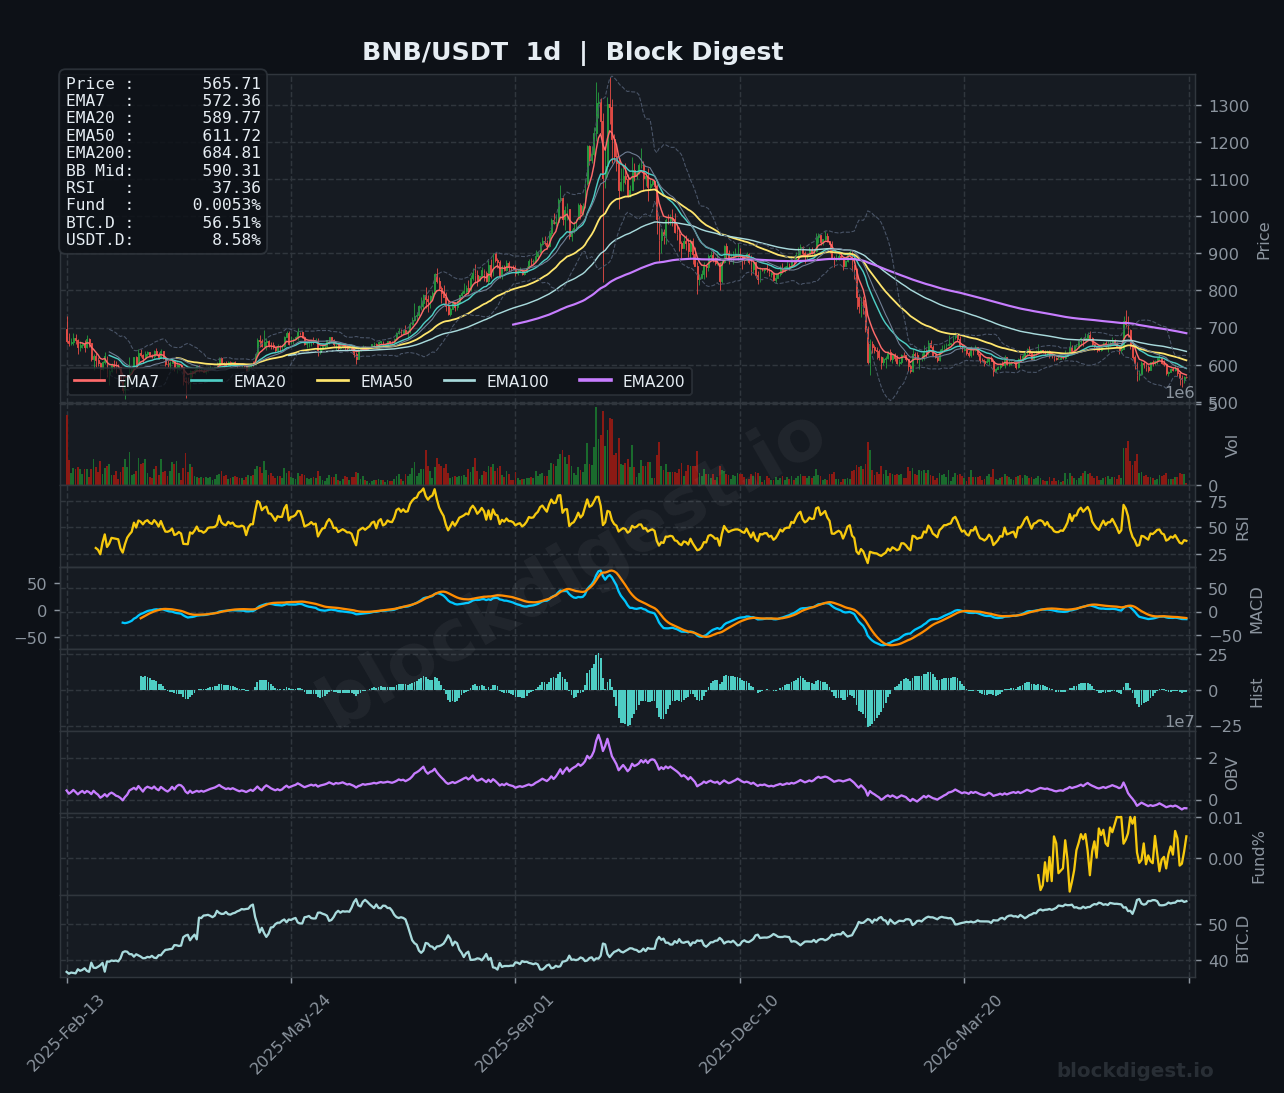
BNB is trading at $565.76, hovering near a critical juncture where all short-term EMAs (EMA7 at $566.17, EMA20 at $565.70, EMA50 at $565.39) are converging tightly on the 1-hour chart with RSI at 50.94 — a textbook indecision setup. The 4-hour chart shows RSI at 46.13 with MACD still negative, while the daily chart reveals a more alarming picture: price is now well below all major daily EMAs, with EMA200 at $684.81, and the daily RSI sits at 37.36, approaching oversold territory. OBV on the 4-hour and daily charts has trended sharply lower following the peak, indicating sustained institutional selling. Support is found near $550–$555 and resistance clusters around $575–$580; the overall bias remains bearish with the daily structure still deteriorating.
Dogecoin (DOGE)
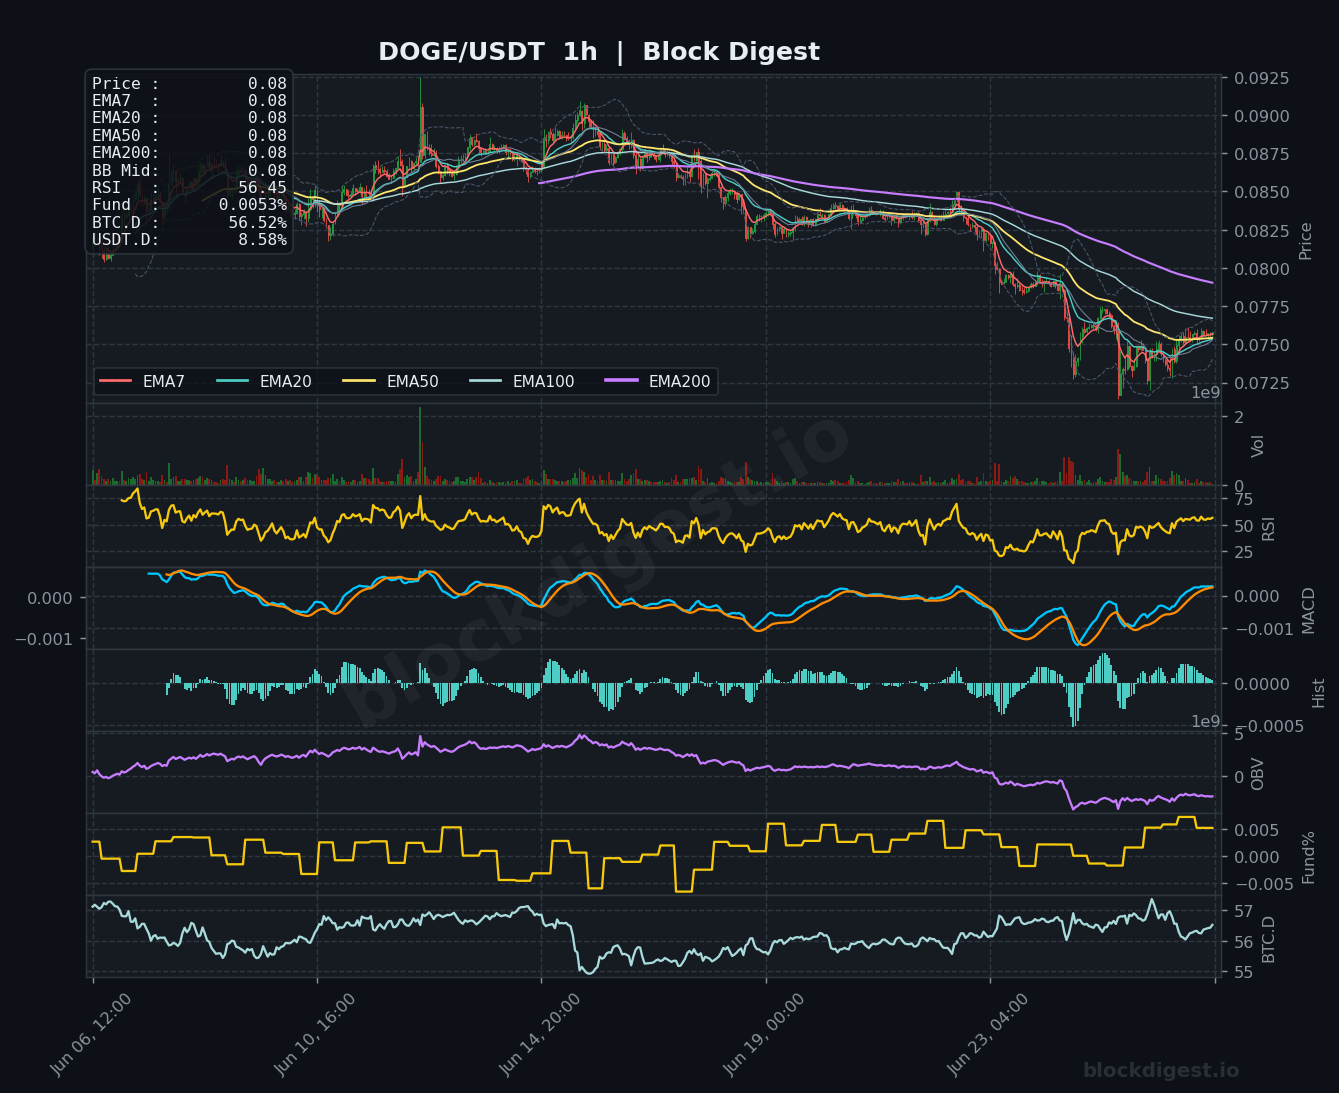
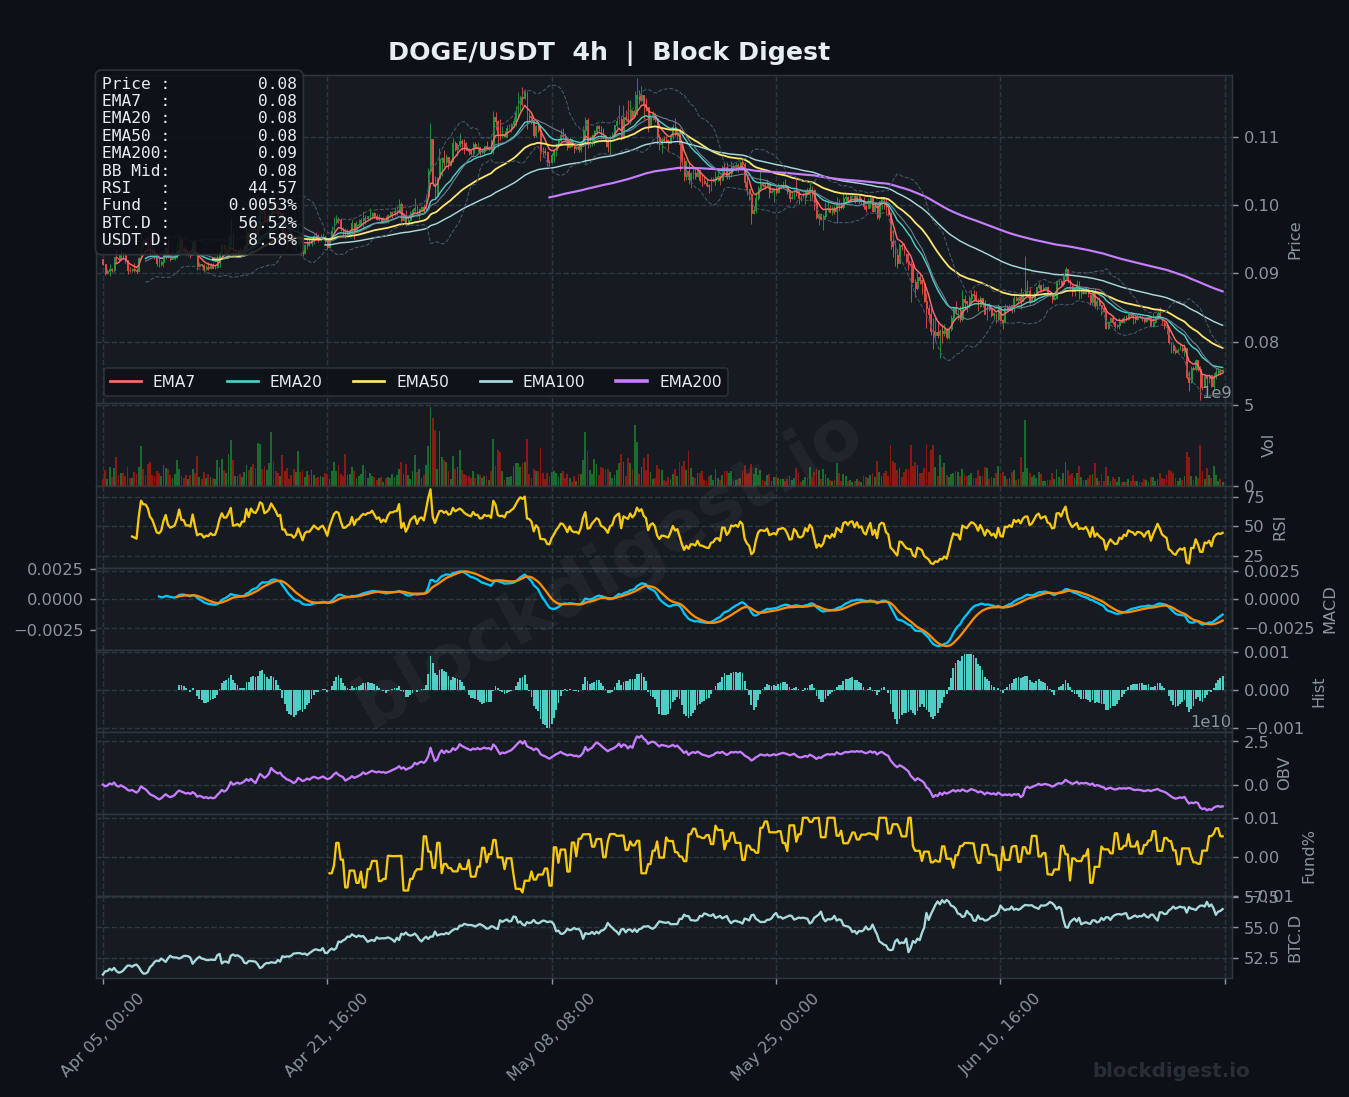
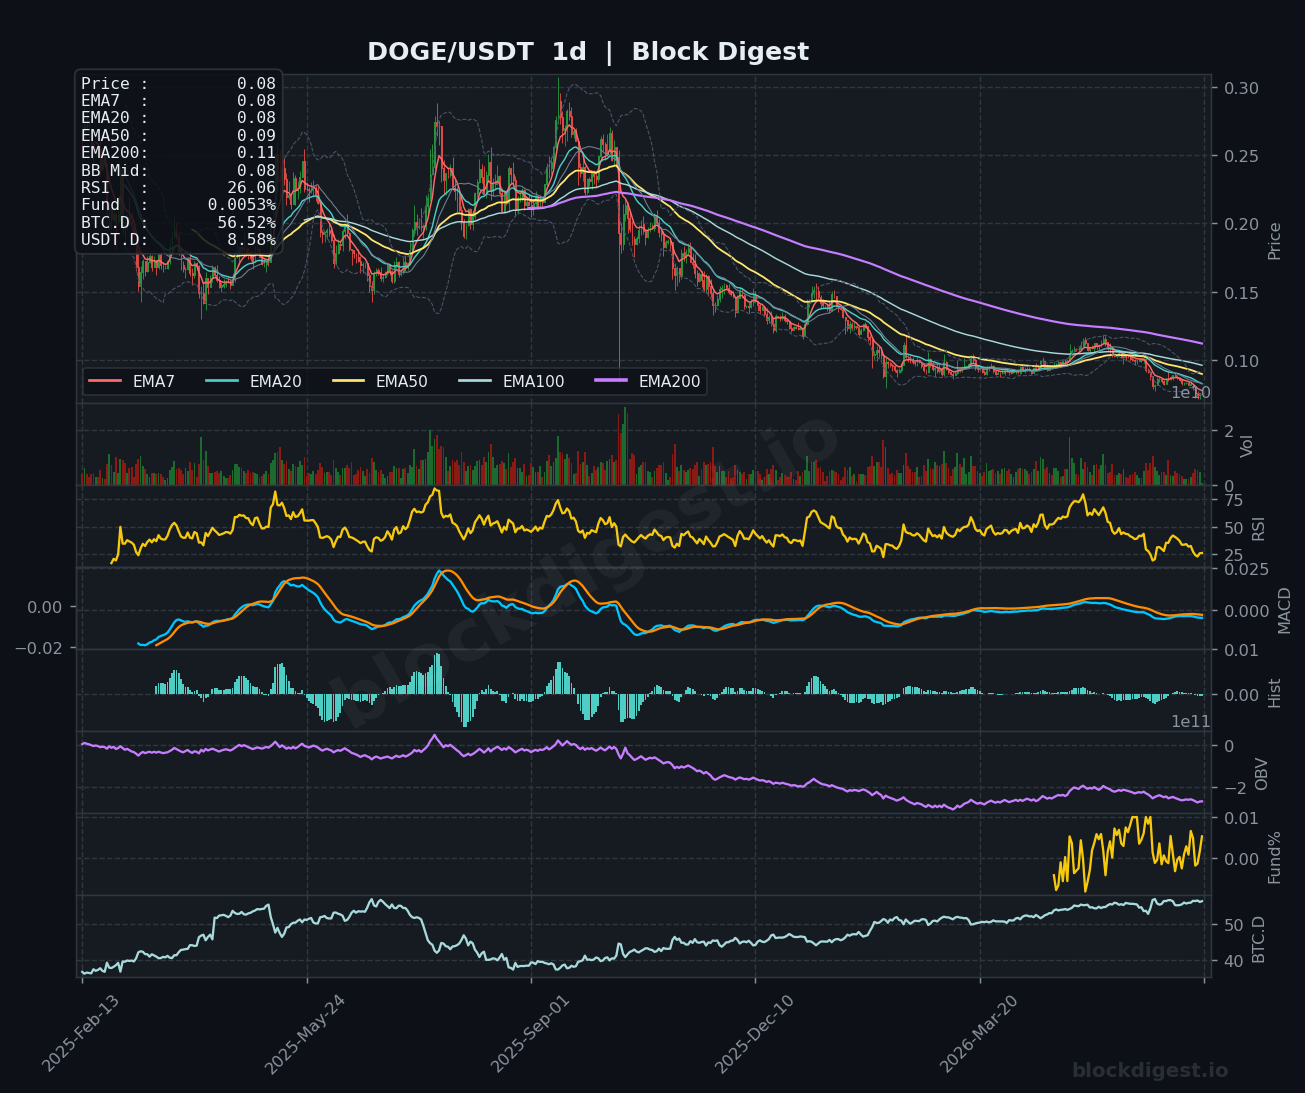
DOGE is trading at $0.08, a level where all EMAs have essentially converged flat on the 1-hour chart, reflecting extreme compression and lack of directional conviction. The 4-hour RSI at 44.57 and a MACD structure barely recovering from deeply negative territory offer limited immediate upside catalyst, while the daily RSI at 26.06 places DOGE firmly in oversold territory — the most oversold reading among the assets covered today. Despite the deeply oversold daily condition, the OBV on both the 4-hour and daily continues to decline, showing no accumulation signal to accompany the low RSI reading. Key support lies at $0.072–$0.074 and resistance at $0.085–$0.090; while the daily oversold RSI may attract short-covering, the bias remains cautiously bearish until a volume-backed reversal materializes.
Litecoin (LTC)
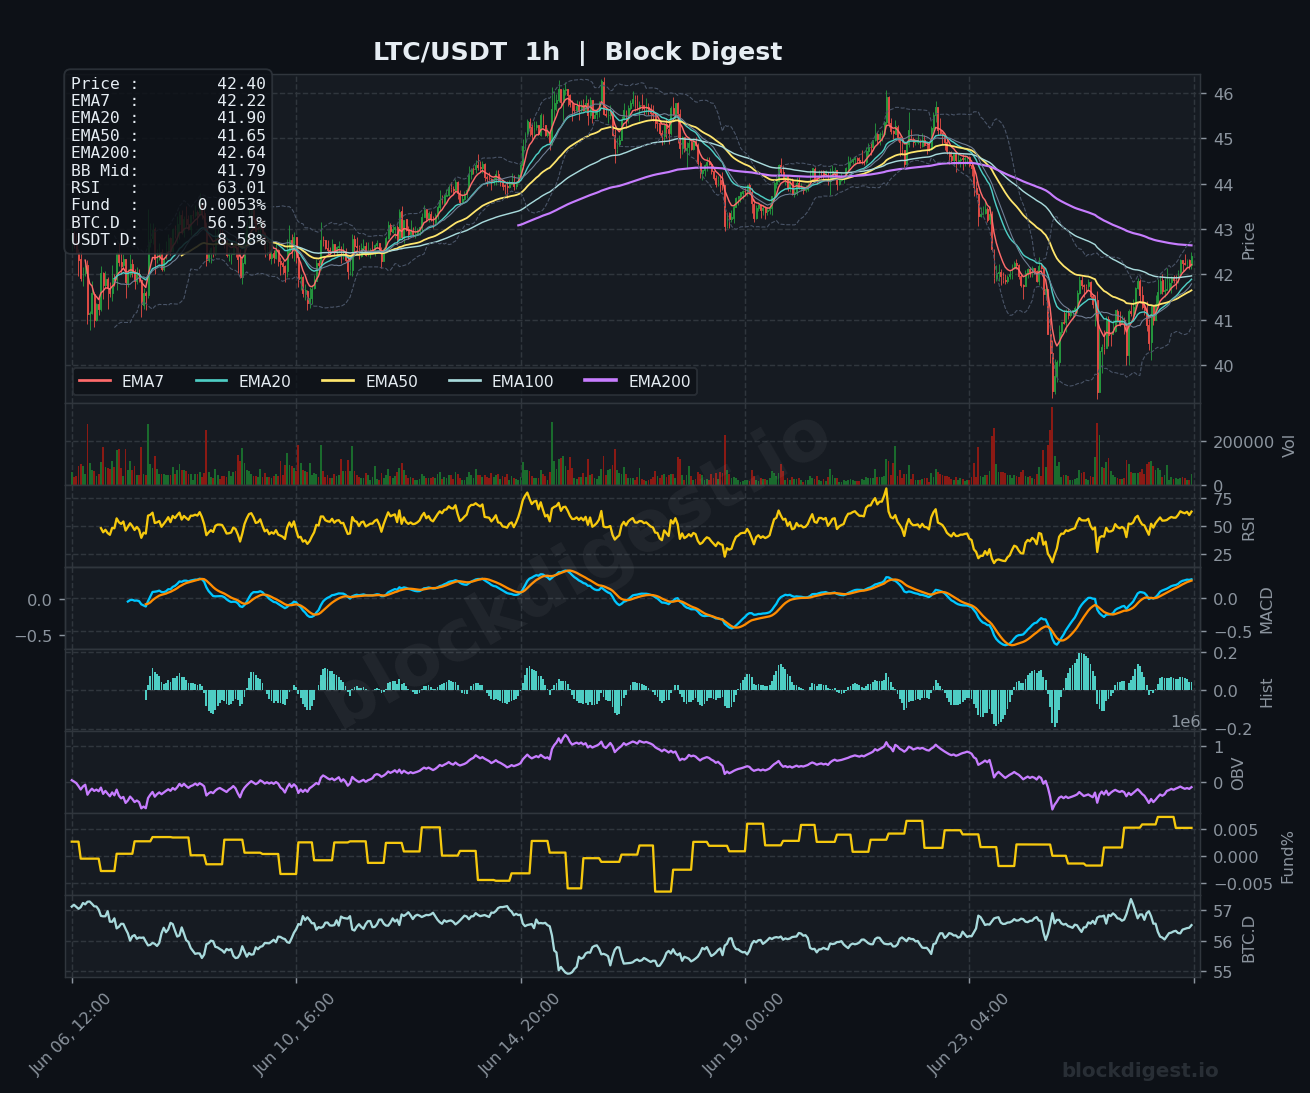
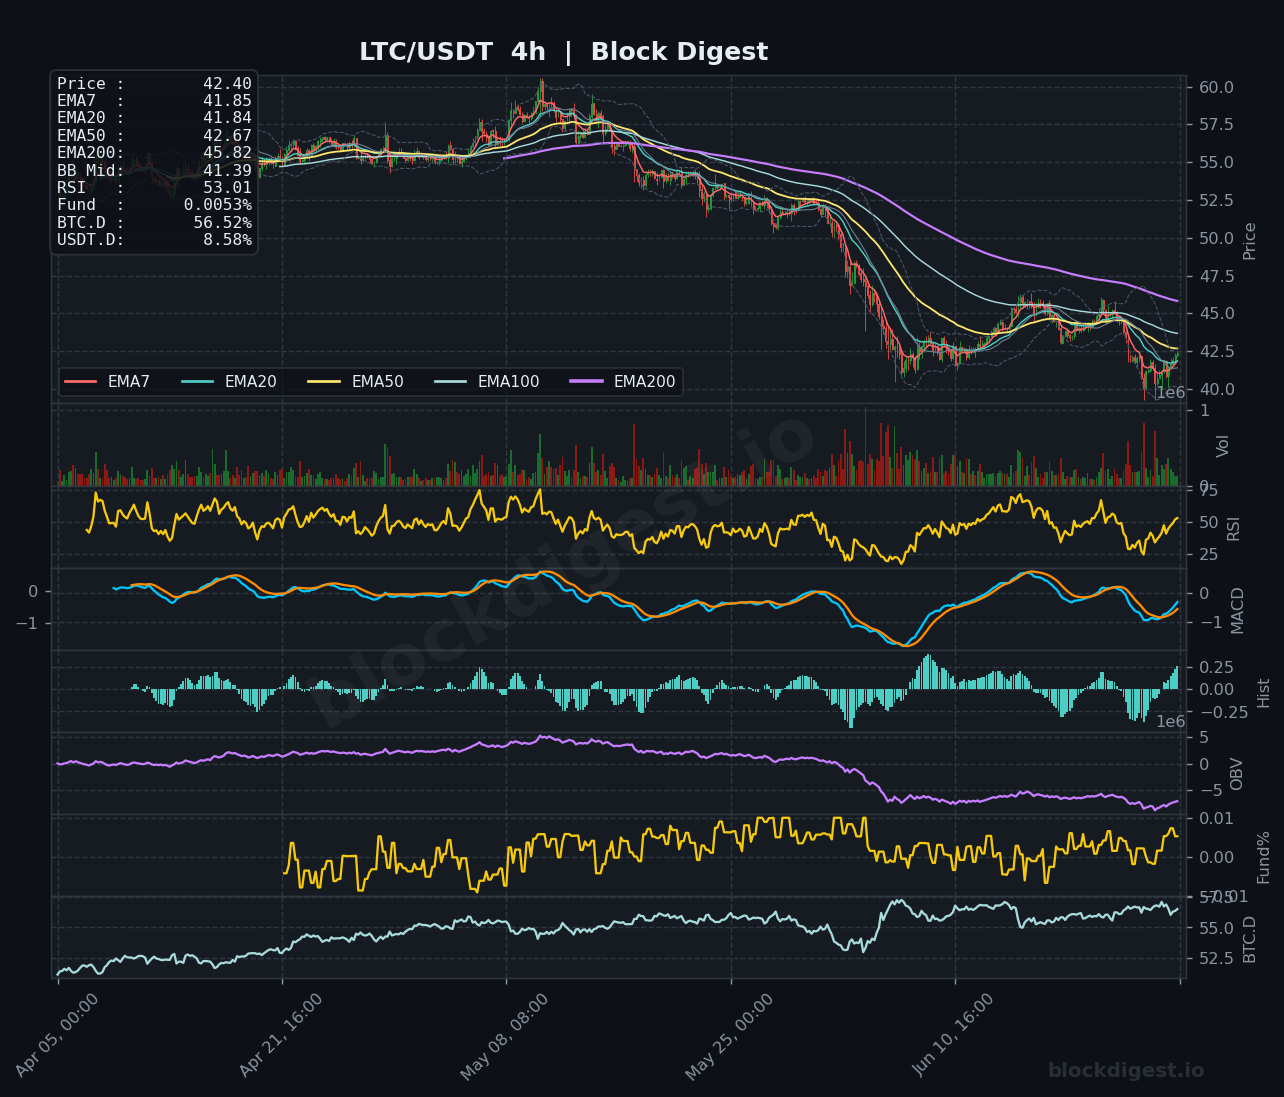
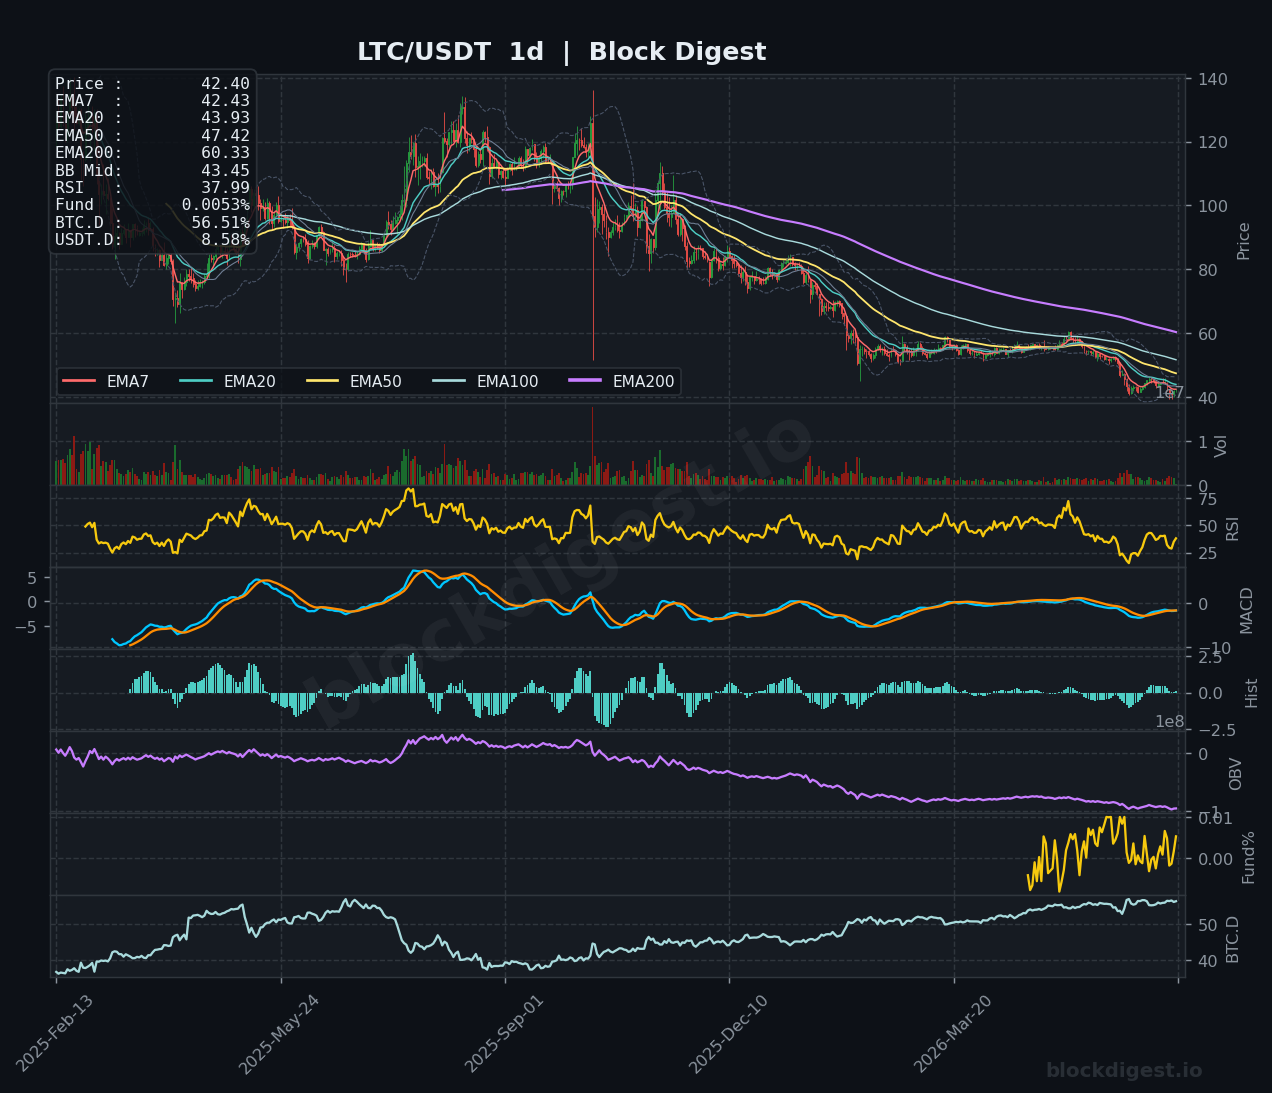
LTC is trading at $42.40, showing one of the more interesting short-term setups in today’s coverage — the 1-hour RSI at 63.01 is the highest among the group, and the MACD on the hourly is crossing bullishly with price reclaiming all short-term EMAs. The 4-hour timeframe shows RSI at 53.01 with the MACD histogram turning positive, suggesting the intermediate-term momentum is also attempting a recovery following a sharp drop to the $40 area. However, the daily chart remains structurally weak: price at $42.40 is below the EMA20 ($43.93), EMA50 ($47.42), and far below the EMA200 ($60.33), with daily RSI at 37.99. Support is established near $40.00 and resistance at $44–$45; short-term bias is cautiously bullish on the hourly and 4-hour, but the daily structure remains a headwind.
TRON (TRX)
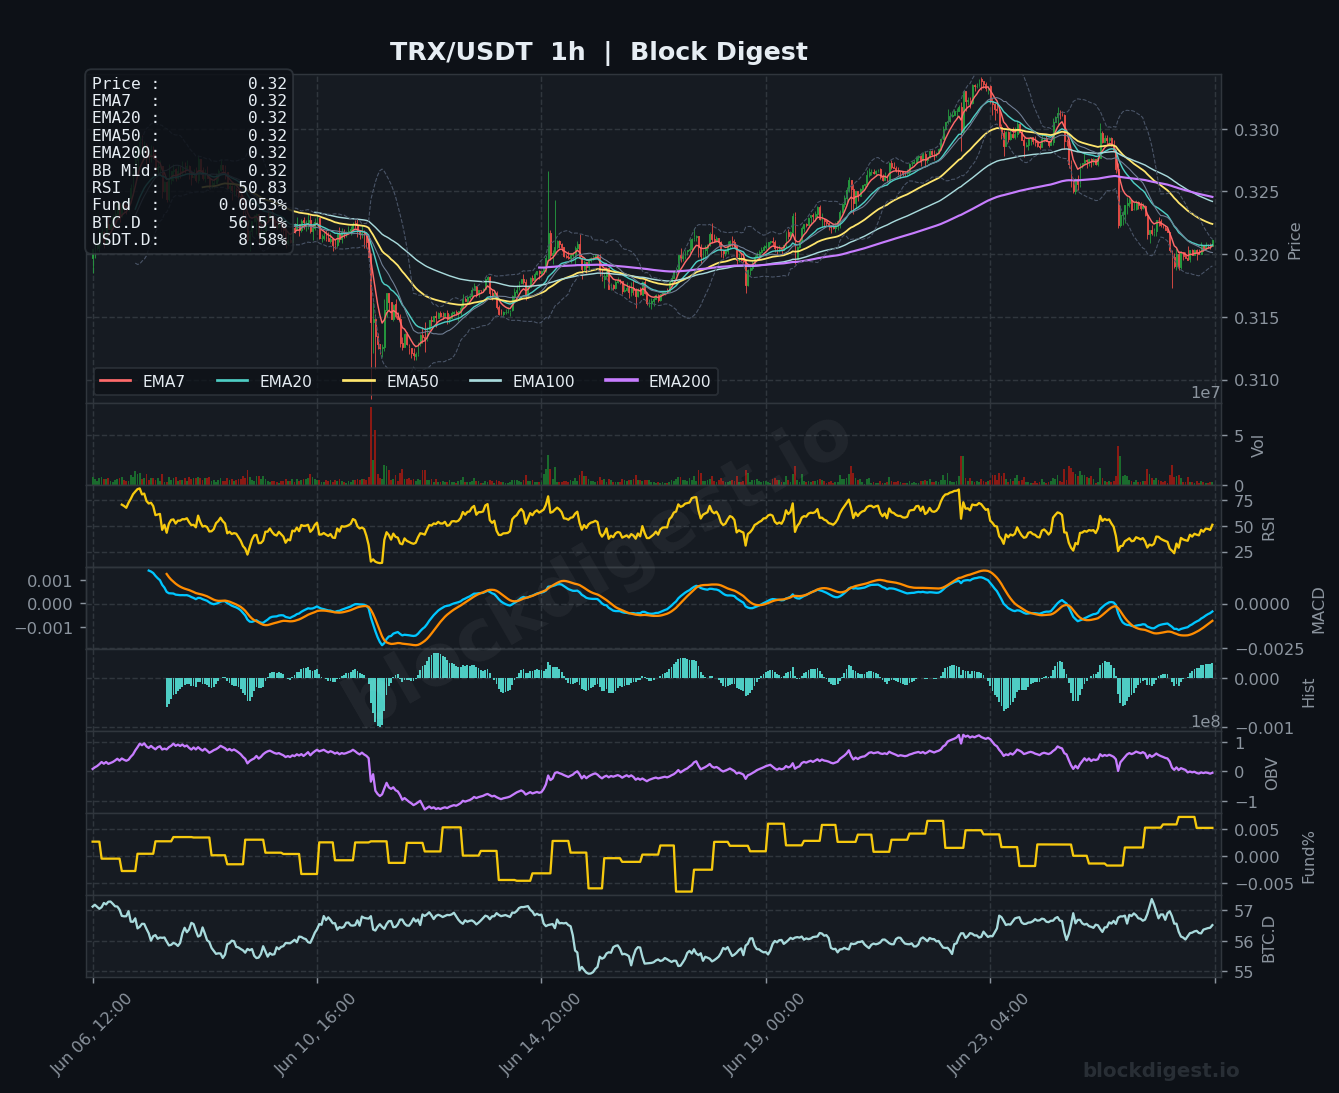
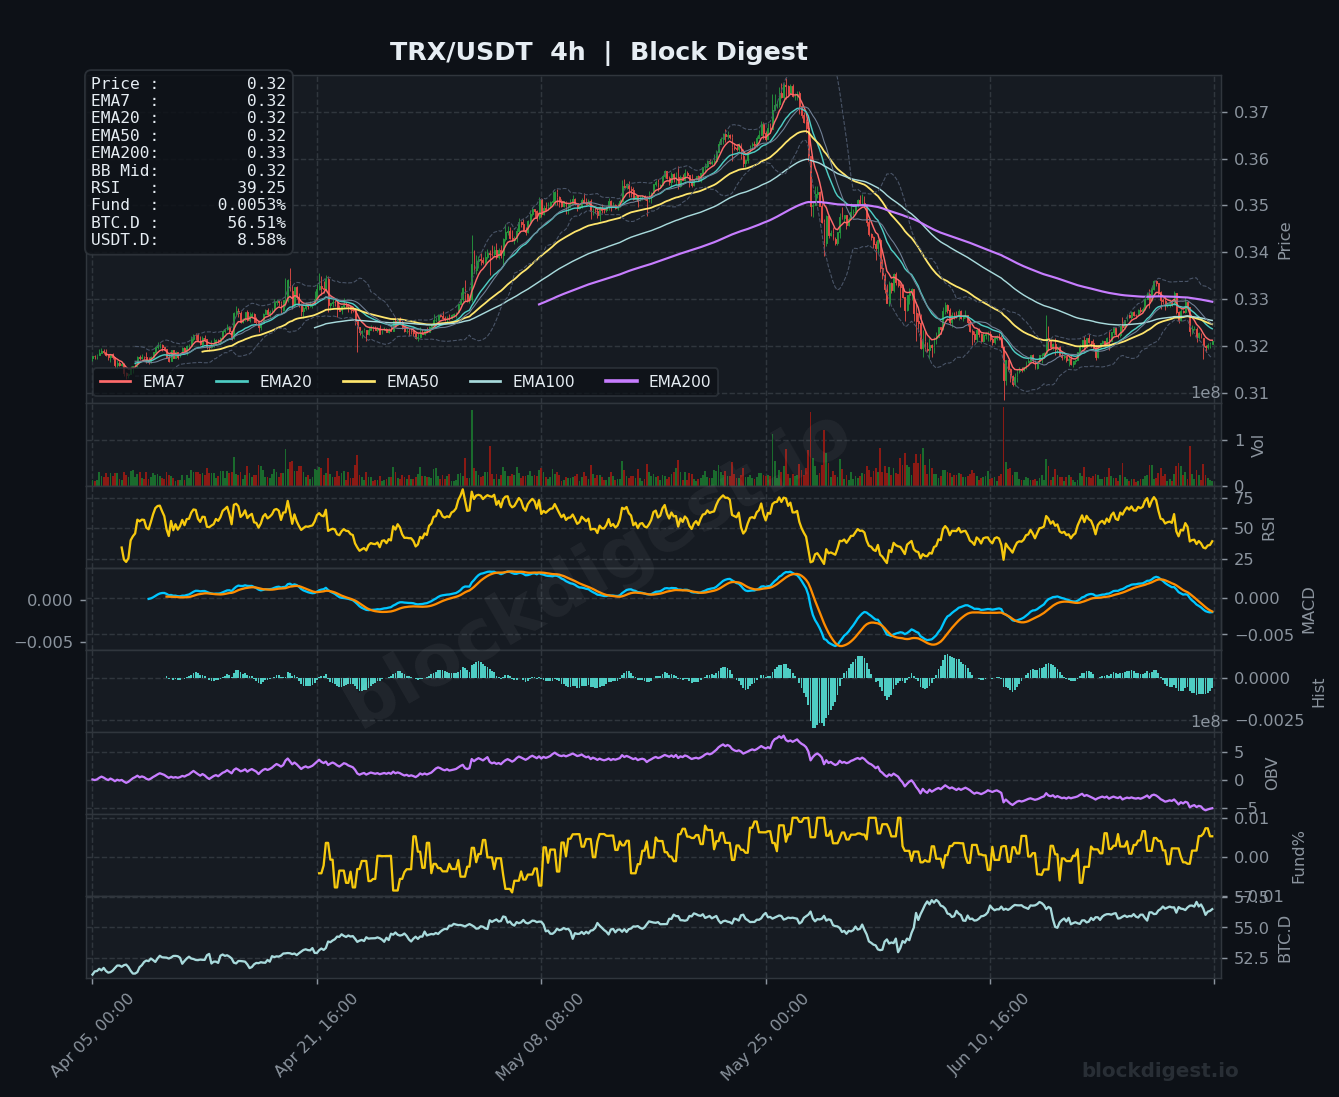
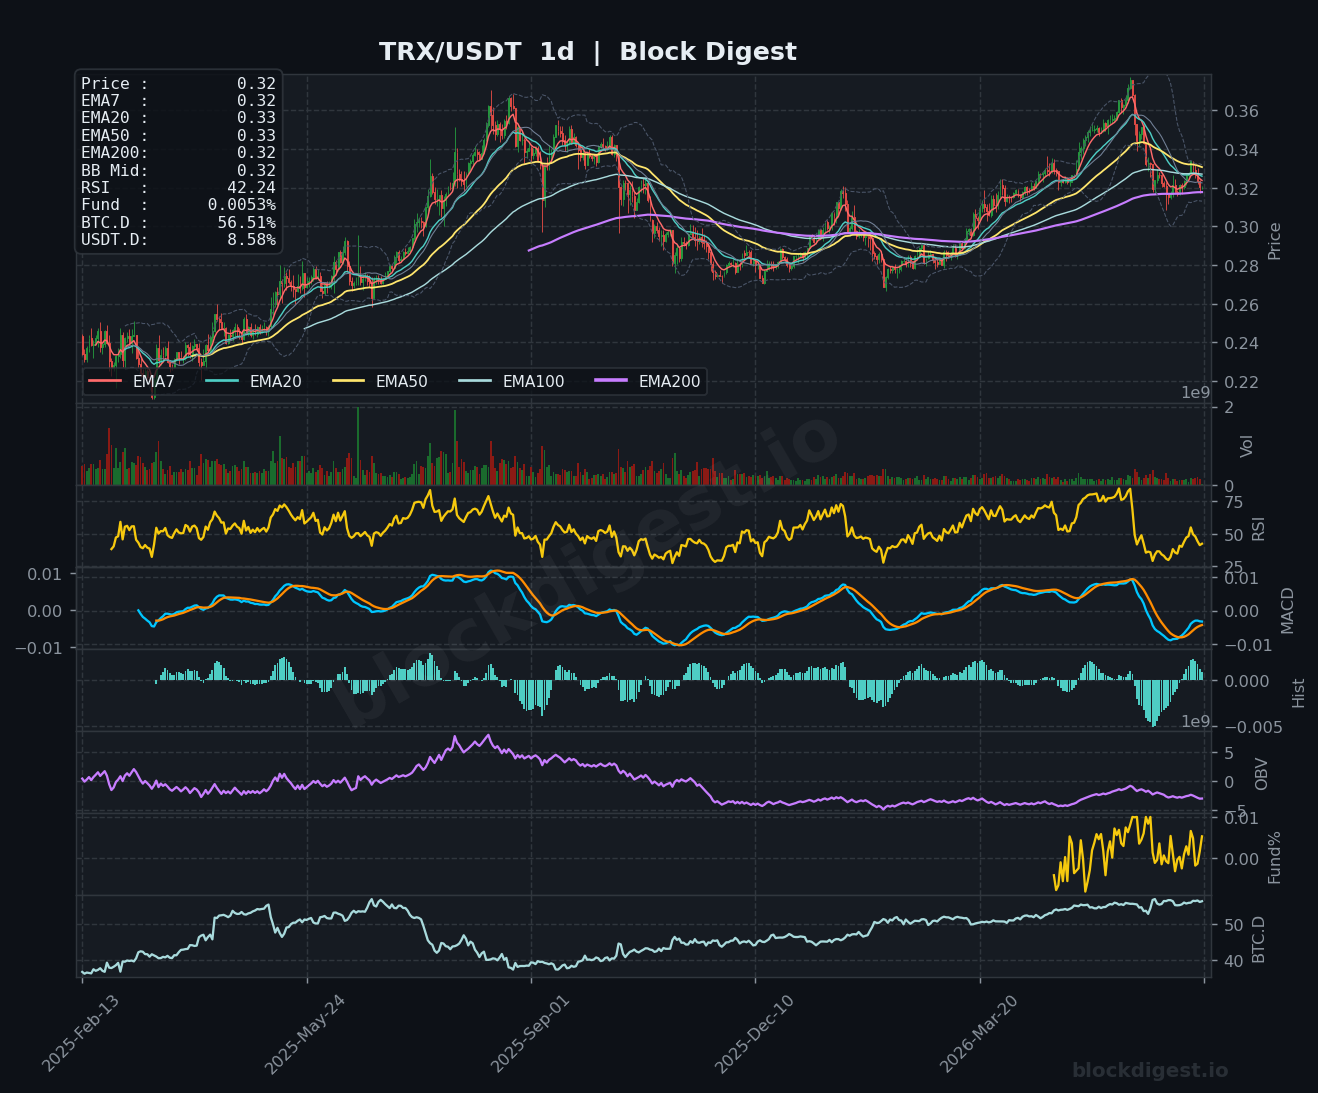
TRX is trading at $0.32, and stands out as the most structurally resilient asset in this roundup — on the daily chart, price is near the EMA200 at $0.32, effectively trading at its long-term moving average rather than far below it as seen in most peers. The 1-hour RSI at 50.83 reflects neutral momentum following a pullback from recent highs near $0.330, while the 4-hour RSI at 39.25 signals short-term selling pressure that has emerged after the local top. The daily RSI at 42.24 is softer but not oversold, and importantly, the daily MACD remains close to zero — far less negative than its altcoin counterparts — indicating the trend deterioration is shallower. Support sits at $0.315–$0.318 and resistance at $0.330–$0.335; the short-term bias is neutral to mildly bearish on the intraday, but TRX maintains the strongest higher-timeframe structure of the group.
Altcoin Outlook
The June 27, 2026 altcoin landscape is broadly defensive: with BTC dominance at 56.51% and USDT.D at 8.58%, the conditions for a sustained altcoin rotation rally are not yet in place, and most of the assets reviewed are trading in confirmed daily downtrends below key EMAs. TRON (TRX) and Litecoin (LTC) display the most constructive short-to-medium term setups — TRX for its structural resilience near the daily EMA200, and LTC for its stronger hourly and 4-hour momentum readings — while DOGE and XRP present the weakest technical pictures, with both exhibiting prolonged distribution trends despite increasingly oversold daily RSI readings. Traders should watch for a decisive move in BTC dominance — a break below 55% could be the catalyst needed to unlock meaningful altcoin upside — while a sustained USDT.D decline below 8% would further confirm risk appetite returning to the market. Until those macro conditions shift, bounces in individual altcoins should be treated as relief rallies within larger downtrends rather than confirmed trend reversals.
Disclaimer: This analysis is for informational purposes only and does not constitute financial advice. Cryptocurrency markets are highly volatile and unpredictable. All trading decisions should be made based on your own research and risk tolerance. Block Digest is not responsible for any financial losses incurred as a result of acting on this content.
Stay Ahead of the Market
Follow BlockDigest for crypto market intelligence, research and real-time updates.


