
Market Overview
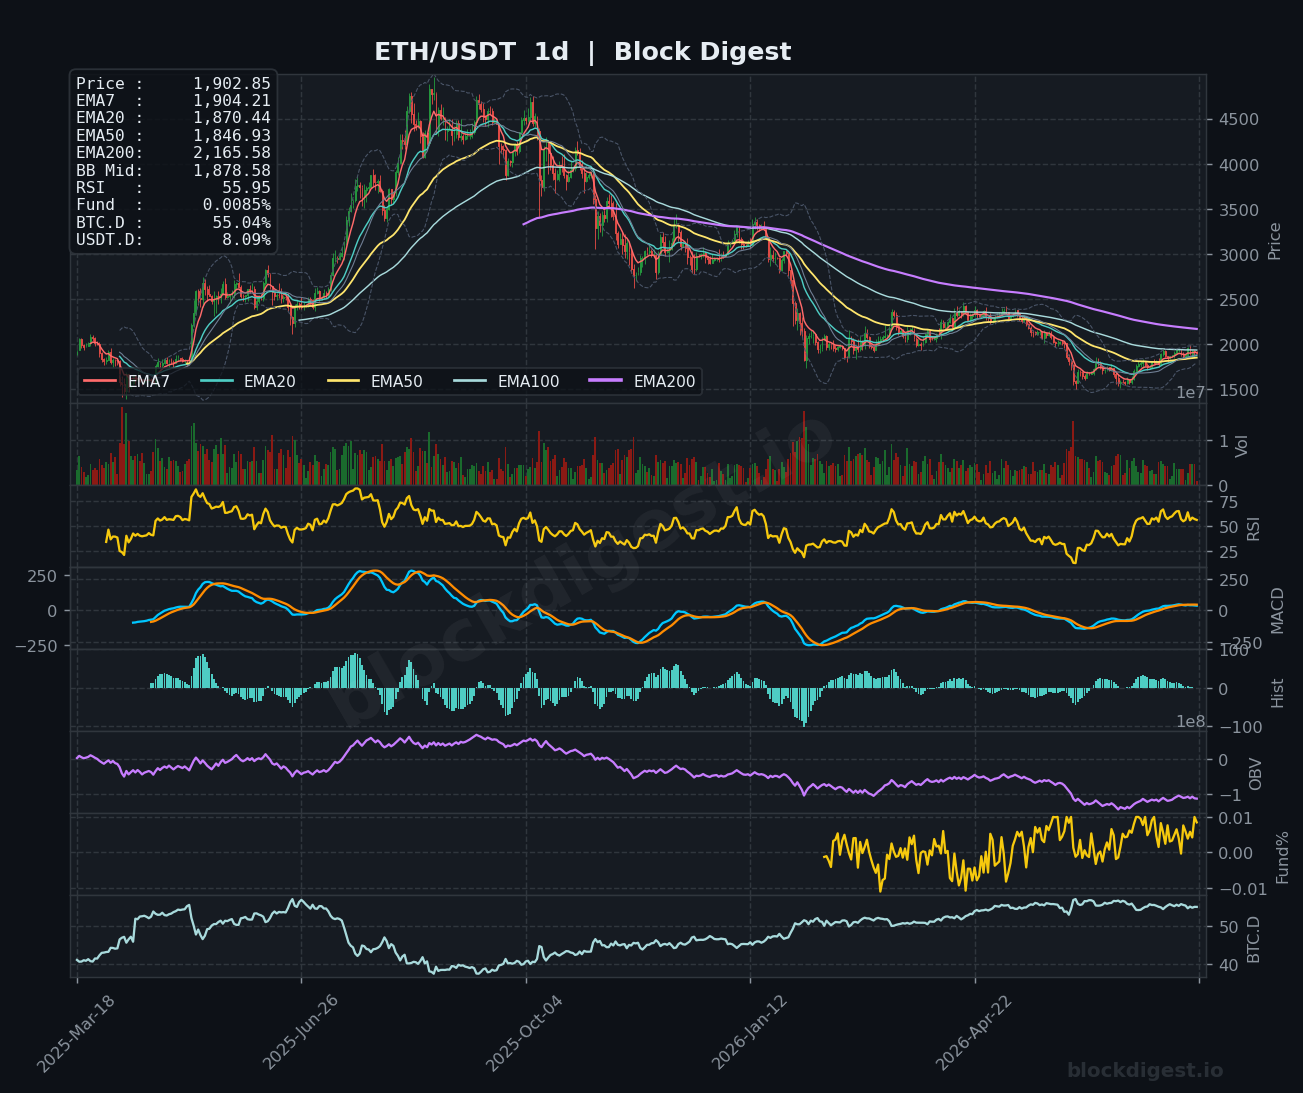
Ethereum is trading at $1,902.97 as of July 30, 2026, navigating a critical inflection zone after a multi-month recovery from lows near $1,500. On the daily timeframe, price has reclaimed the EMA7 ($1,904.21), EMA20 ($1,870.44), and EMA50 ($1,846.93), a constructive development, but remains deeply suppressed beneath the EMA200 ($2,165.58), which continues to exert significant macro overhead pressure. The Bollinger Band midline on the daily sits at $1,878.58, and price is trading just above it, suggesting the recovery is real but fragile. The dominant daily trend remains structurally bearish given the EMA200 gap, though near-term momentum has shifted modestly in the bulls’ favor.
Multi-Timeframe Confluence
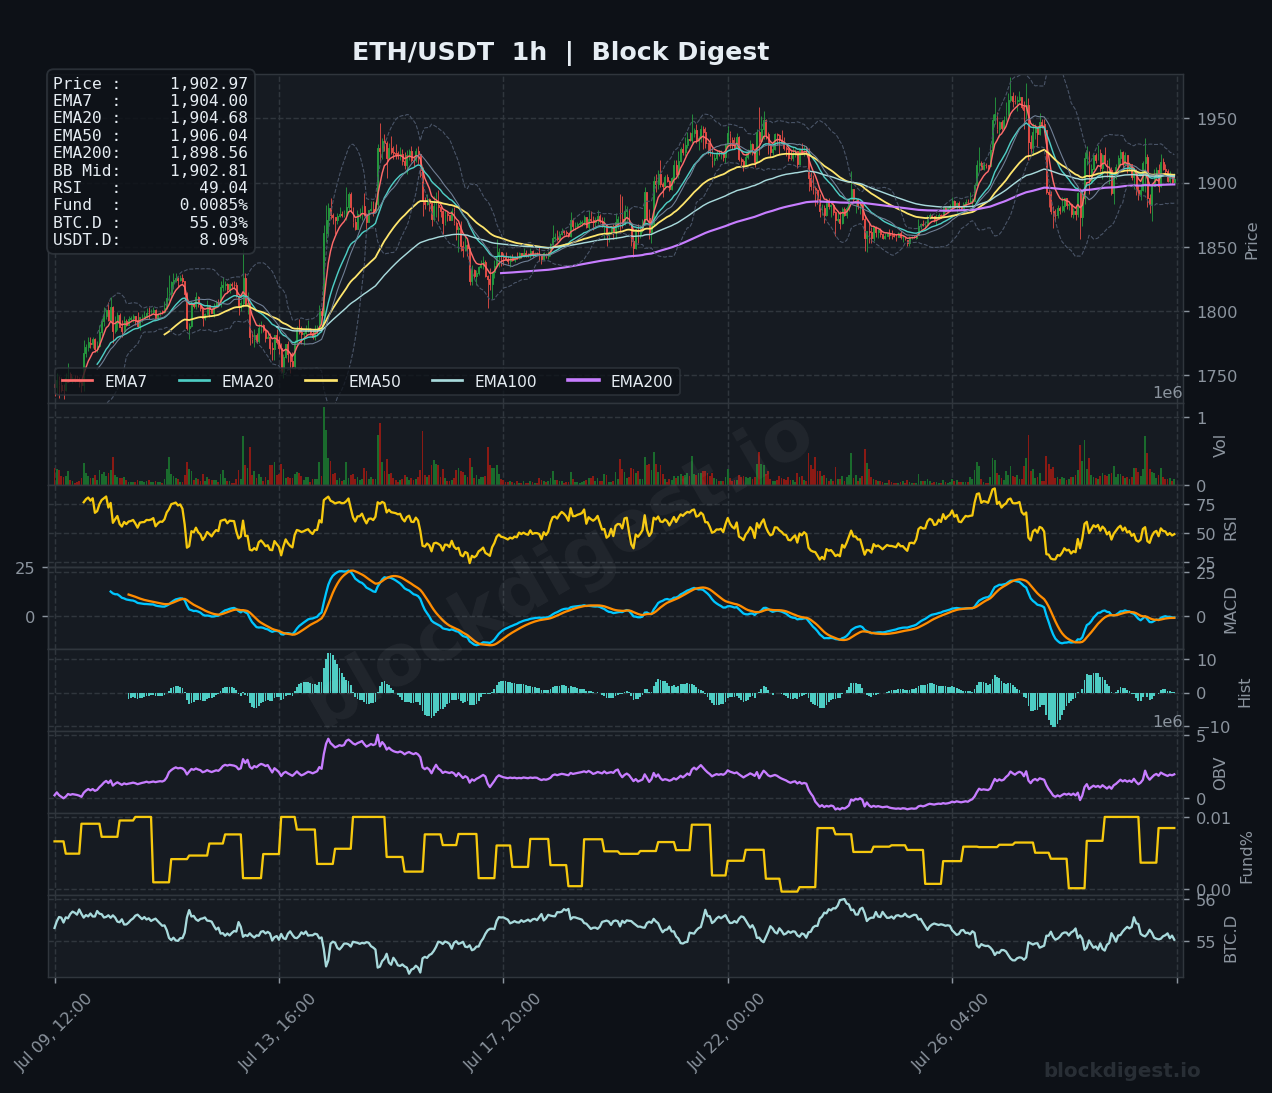
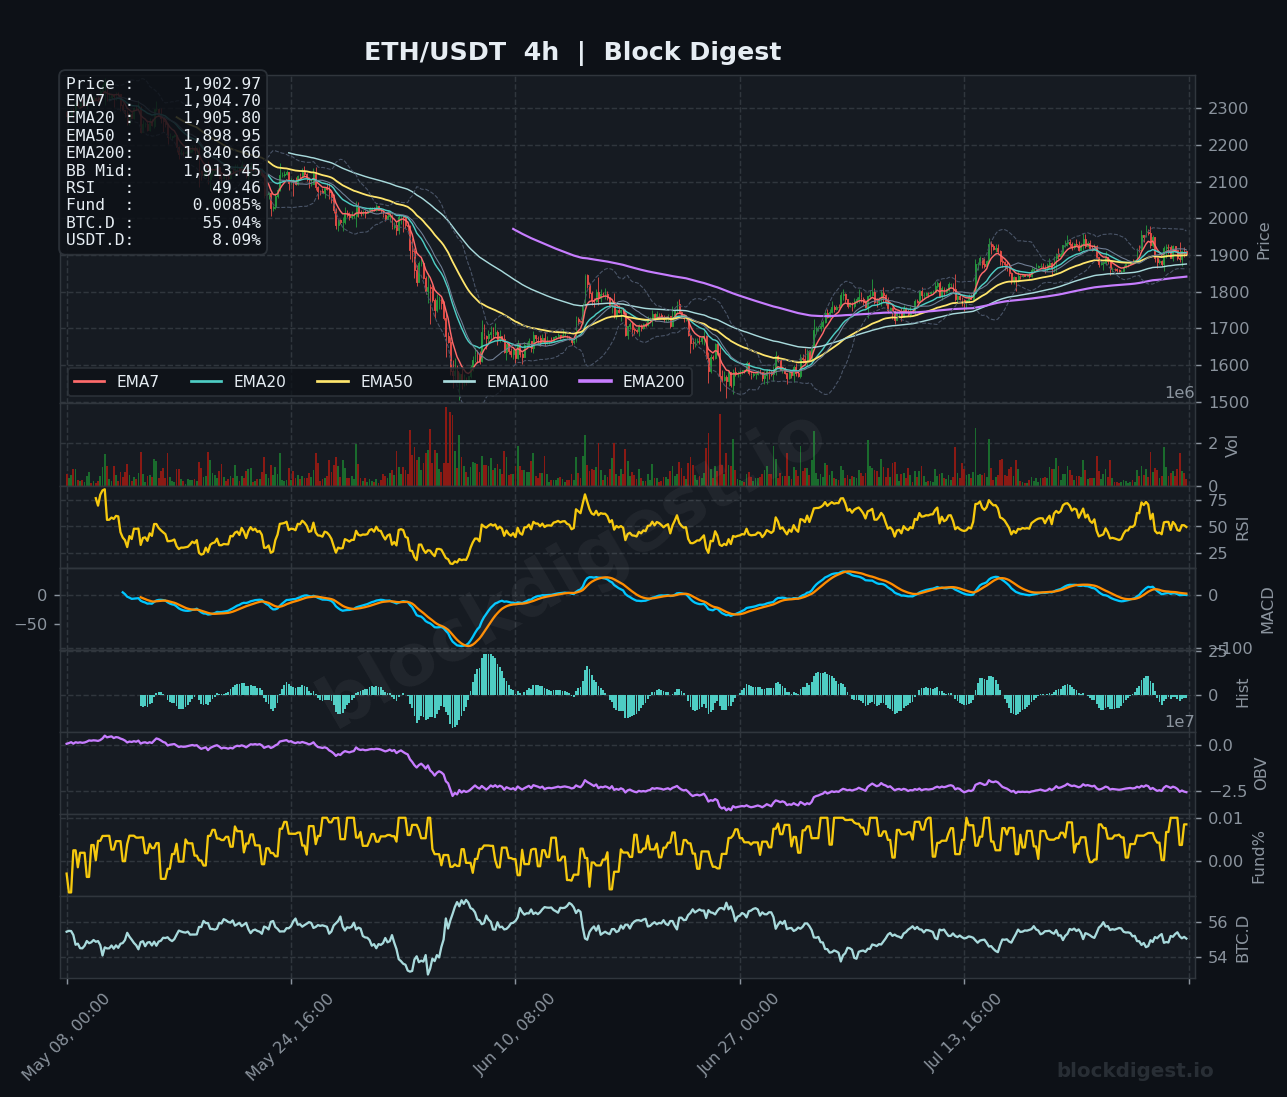
Across all three timeframes, ETH is caught in a tight EMA cluster, with the 1h showing price sandwiched between EMA7 ($1,904.00), EMA20 ($1,904.68), EMA50 ($1,906.04), and EMA200 ($1,898.56) — all compressed within a roughly $7 range, signaling extreme short-term indecision. The 4h chart reinforces this picture: the EMA7 ($1,904.70), EMA20 ($1,905.80), and EMA50 ($1,898.95) are tightly coiled while price trades below the 4h BB midline of $1,913.45, hinting at a slight bearish lean on the intermediate timeframe. The daily provides the clearest directional read — the bullish EMA stack (EMA7 > EMA20 > EMA50) on that timeframe is a positive signal, but it contradicts the compressed, directionless short-term action, making a decisive move in either direction increasingly likely within the next 24–48 hours ahead of the Fed’s rate decision.
Key Levels to Watch
- Resistance: $1,950 — recent swing high on the 1h chart where sellers have previously stepped in; $1,975–$1,980 — the upper Bollinger Band region on the 4h timeframe where momentum stalled during the most recent rally attempt; $2,050–$2,100 — the macro supply zone and area of prior consolidation visible on the daily, a recovery above which would materially shift the intermediate structure.
- Support: $1,878–$1,880 — daily BB midline and recent consolidation floor; a breach would expose the next level. $1,840–$1,847 — daily EMA50, the first meaningful structural support and a level that broadly defined the base of recent recovery. $1,780–$1,800 — psychological and chart support from prior price action on the daily, representing the line in the sand for any continued recovery thesis.
Momentum & On-Chain Signals
The RSI across timeframes tells a consistent story of neutrality: the 1h reads 49.04 and the 4h sits at 49.46, both hugging the midline with no directional conviction, while the daily RSI at 55.95 shows slightly stronger footing and a recovering trajectory from deeply oversold territory earlier this year. Block Digest’s proprietary BD Pulse Score reinforces this caution, clocking in at a bearish 40/100, suggesting that beneath the surface, momentum has not yet confirmed a durable recovery. The MACD on the 4h is essentially flat with both lines converging near zero and histogram bars shrinking, consistent with a market in pause mode. On-chain volume flow, reflected in the OBV trend reading of +1 from our BD Pulse data, indicates marginal accumulation is underway, though the 4h OBV line remains well below its prior peaks, meaning distribution from the macro downtrend has not been fully absorbed.
BTC Dominance & Market Sentiment
BTC dominance is holding at 55.04% — a level that has been persistently elevated and continues to act as a headwind for ETH and altcoins broadly. This is corroborated by USDT.D sitting at 8.09%, reflecting that a non-trivial amount of capital remains parked in stablecoins rather than rotating into risk assets. For ETH specifically, continued BTC dominance above 55% historically suppresses ETH/BTC recovery and limits the upside potential of any standalone ETH rally, meaning a meaningful ETH breakout likely requires BTC dominance to soften first.
Risk Scenarios
- Bullish case: A confirmed Fed rate hold or dovish pivot signal could catalyze a risk-on rotation, propelling ETH above the $1,950 resistance with volume. A sustained daily close above $1,975–$2,000 would open a path toward $2,100 and mark a structural trend shift on the intermediate timeframe.
- Bearish case: A break below the $1,878 daily BB midline, compounded by a negative Fed surprise or escalating geopolitical risk from the Middle East conflict, could accelerate selling toward $1,840 (daily EMA50). A failure of that level opens the door to a retest of $1,780–$1,800.
Outlook
ETH enters July 30 in a state of compressed indecision, with all short-term EMAs coiled within a $10 range and momentum indicators parked at neutral — a setup that historically precedes a sharp directional move. The immediate macro catalyst is the Fed’s rate decision, which carries outsized significance for risk assets given the current geopolitical backdrop. The BD Pulse Score at 40/100 keeps us cautious on the bullish narrative despite the daily EMA stack improvement, and with BTC dominance anchored above 55%, ETH remains vulnerable to underperformance relative to Bitcoin. The directional bias leans neutral-to-cautious bearish on a 24-hour horizon, with a break above $1,950 or below $1,878 likely determining the next meaningful leg.
—
Disclaimer: This analysis is for informational purposes only and does not constitute financial advice. Cryptocurrency markets are highly volatile and unpredictable. All trading decisions should be made based on your own research and risk tolerance. Block Digest is not responsible for any financial losses incurred as a result of acting on this content.
Stay Ahead of the Market
Follow BlockDigest for crypto market intelligence, research and real-time updates.


