ETH Daily Analysis — 2026-07-28 (Full Archive)
Market Overview
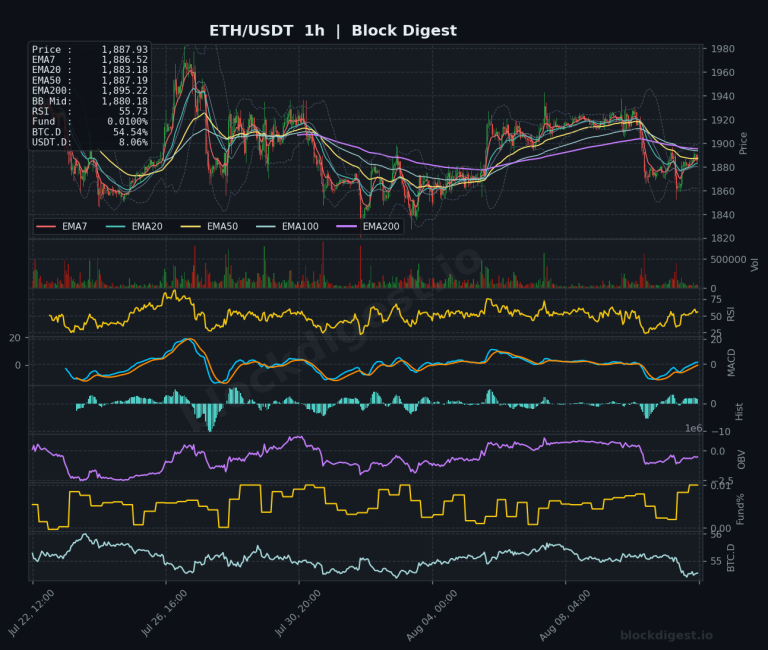
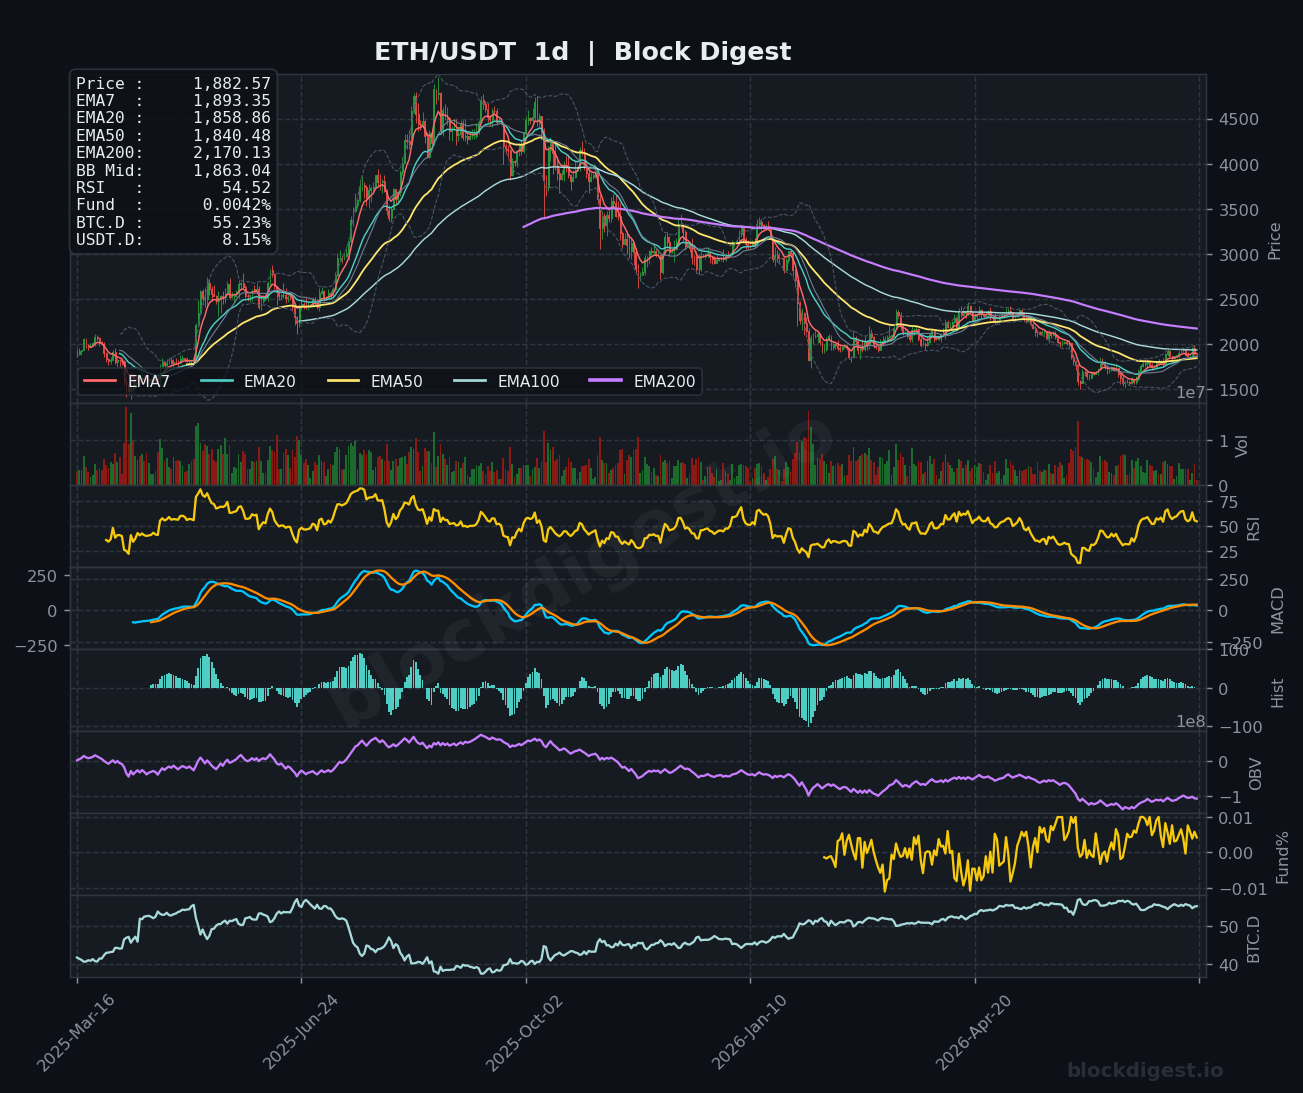
Ethereum is trading at $1,872 on July 28, 2026, extending a 3.52% decline over the past 24 hours as sellers regained control following a brief rally to the $1,945 area the prior session. On the daily timeframe, price sits below the EMA7 ($1,893) and is testing the BB midline at $1,863, signaling a loss of short-term bullish structure. The longer-term macro trend remains heavily bearish — the daily EMA200 sits far above at $2,170, acting as a formidable overhead barrier that ETH has not reclaimed since late 2025. While the recent recovery off the sub-$1,600 lows shows constructive base-building, the overall structure has not yet confirmed a sustained trend reversal.
Multi-Timeframe Confluence
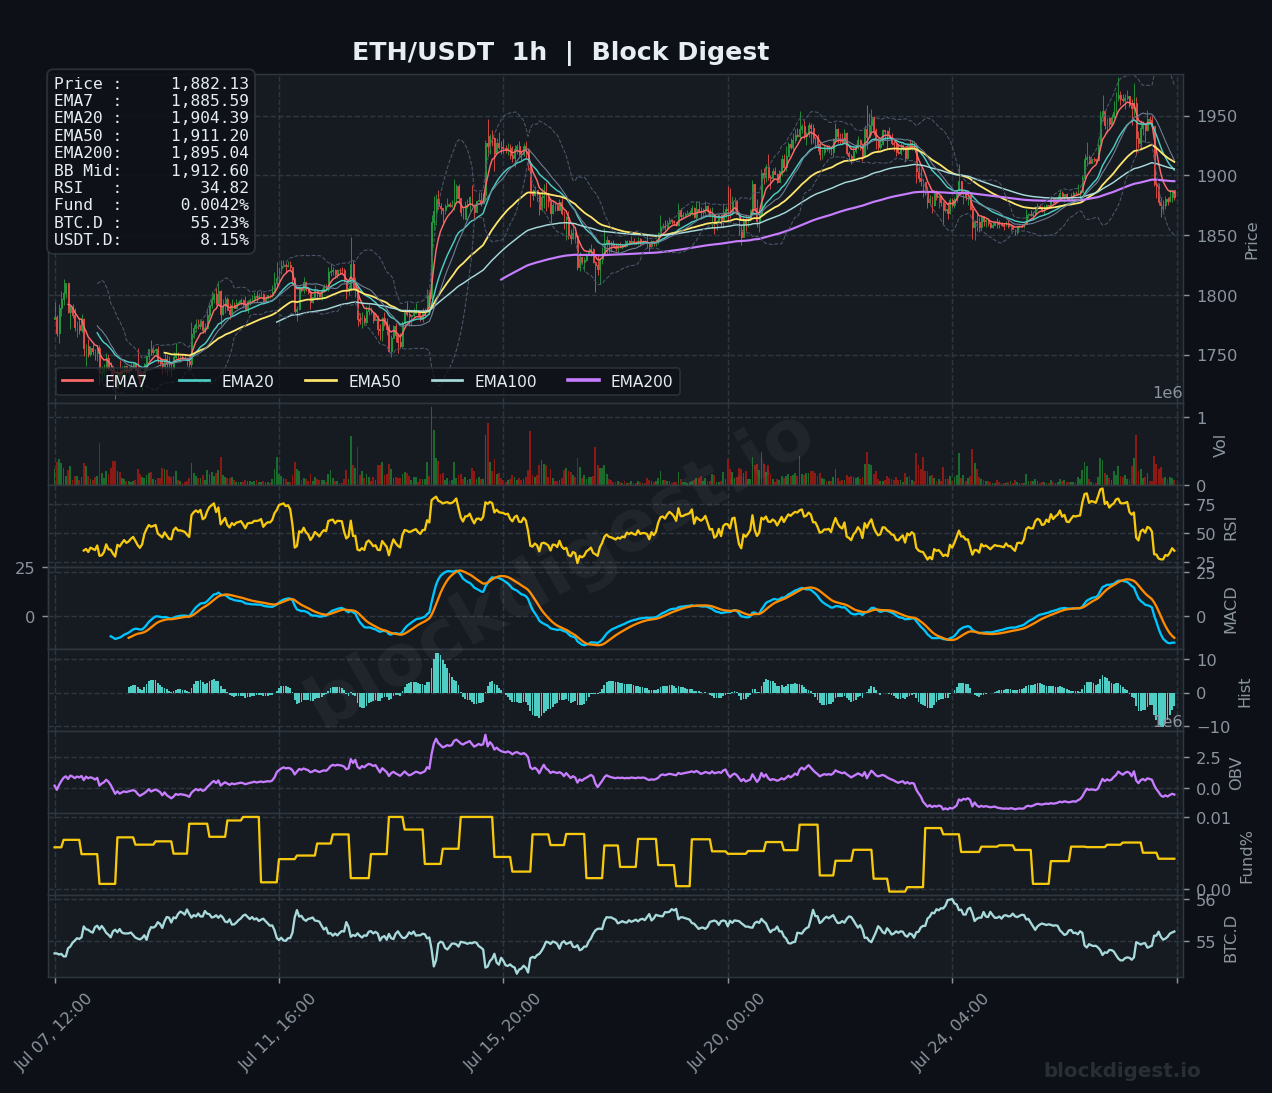
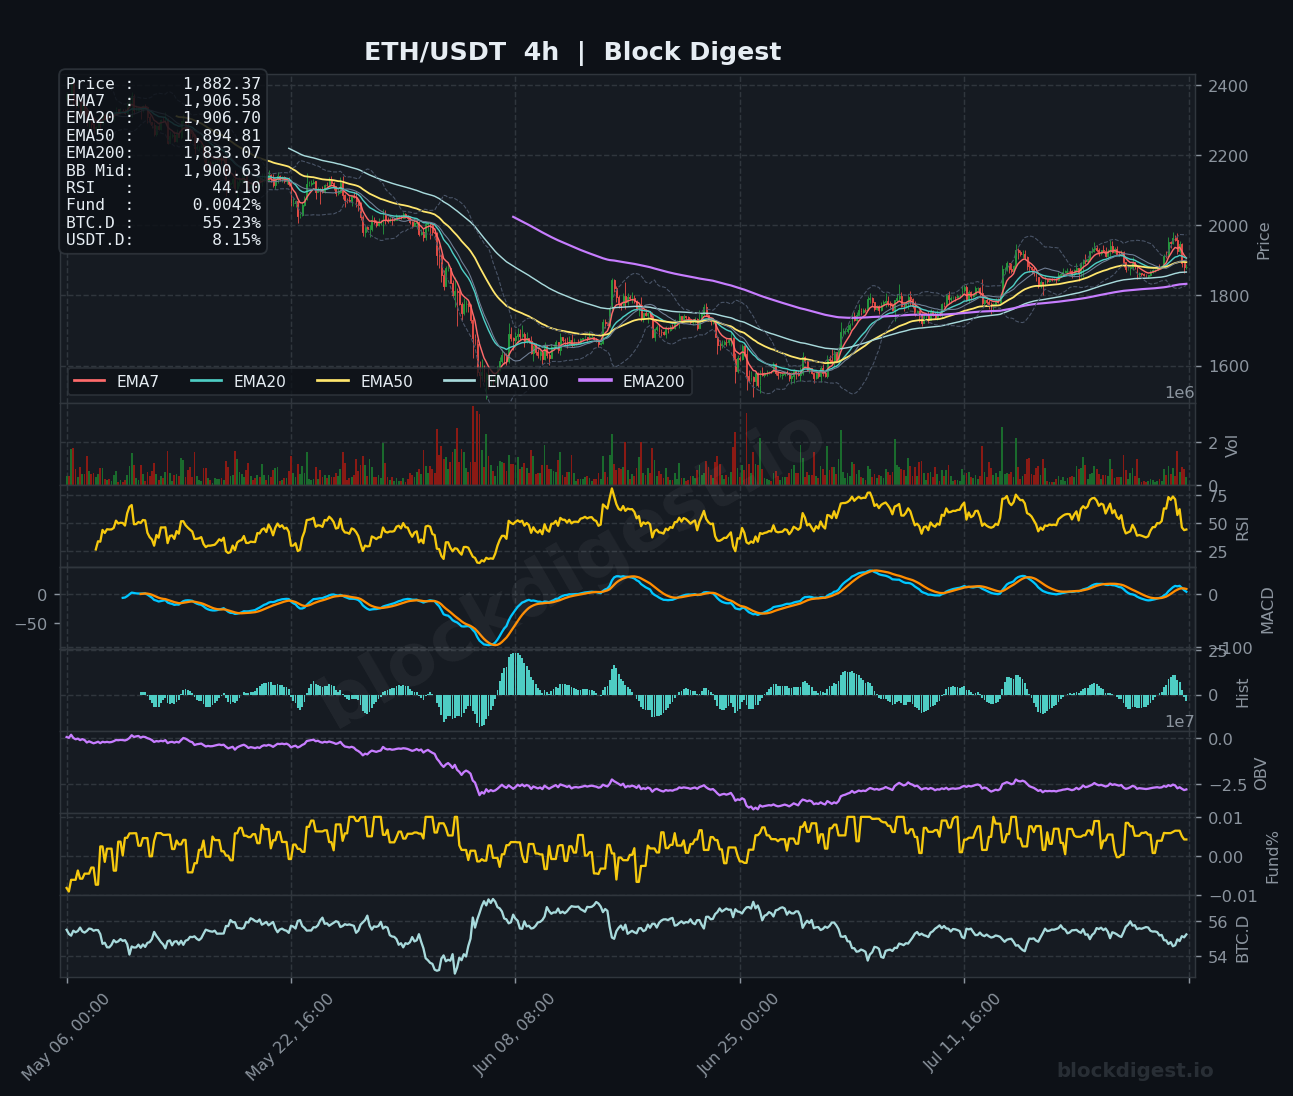
On the 1-hour chart, price has broken below all short-term EMAs (EMA7 at $1,885, EMA20 at $1,904, EMA50 at $1,911), with RSI collapsing to 34.82 — near oversold territory — confirming near-term bearish momentum. The 4-hour chart tells a similar story: price has slipped below the tightly clustered EMA7 ($1,906) and EMA20 ($1,906), with the BB midline at $1,900 now acting as immediate resistance rather than support. Notably, the 4-hour EMA50 at $1,894 and 1-hour EMA200 at $1,895 form a confluent support zone in the $1,893–$1,895 range that bulls need to defend. The daily timeframe shows price hovering just above its EMA20 ($1,858) and EMA50 ($1,840), suggesting the higher timeframe trend is approaching a meaningful decision point.
Key Levels to Watch
- Resistance:
- $1,906–$1,912: Clustered 4h EMA7/EMA20 and 1h BB midline — the first hurdle for any relief bounce
- $1,945–$1,950: Prior session high and recent swing peak; reclaiming this level would shift short-term bias back to neutral
- $2,000–$2,010: Psychologically significant round number coinciding with the upper Bollinger Band on the 4h chart; major structural resistance
- Support:
- $1,858–$1,863: Daily EMA20 and daily BB midline — a critical near-term floor; a daily close below here would be notably bearish
- $1,833–$1,840: 4h EMA200 at $1,833 and daily EMA50 at $1,840 converge to form a robust demand zone
- $1,790–$1,800: Round-number psychological support and the lower Bollinger Band region on the 4h chart; a breakdown to this area would represent a significant deterioration
Momentum & On-Chain Signals
Block Digest’s proprietary BD Pulse Score sits at 39/100, firmly in bearish territory, corroborating the price action deterioration seen across all three timeframes. On the 1-hour chart, MACD has crossed bearish with the histogram deepening into negative territory, indicating accelerating downside momentum in the short term. The 4-hour MACD shows a similar deterioration — both lines are curling lower after failing to sustain a bullish cross — while the daily MACD histogram remains marginally positive but is shrinking, warning that the medium-term recovery impulse may be fading. Our BD Pulse OBV Trend registers -1, reflecting ongoing distribution pressure, though the daily OBV has shown a slight uptick from its June lows, meaning the longer-term selling exhaustion narrative hasn’t been entirely abandoned yet.
BTC Dominance & Market Sentiment
BTC dominance stands at 55.21% per both our BD Pulse data and chart readings, hovering near multi-month highs and signaling that capital continues to rotate defensively into Bitcoin at the expense of altcoins like ETH. With the Fear & Greed Index declining to 29 — firmly in “Fear” territory — and USDT.D at 8.15%, there is meaningful stablecoin positioning on the sidelines that could fuel a recovery if sentiment stabilizes, but it also reflects the cautious posture traders are maintaining given the current sell pressure. For ETH specifically, elevated BTC dominance historically suppresses ETH/BTC performance, limiting the magnitude of any near-term ETH bounce.
Risk Scenarios
- Bullish case: A reclaim of the $1,906–$1,912 EMA cluster on the 4-hour timeframe with increasing volume would signal a potential relief rally back toward $1,945–$1,950, with an extended target near $2,000 if macro sentiment improves. Sustained daily closes above the BB midline ($1,863) would be the minimum threshold needed to reassert any bullish structural thesis.
- Bearish case: A decisive daily close below $1,858 (daily EMA20) would open the door toward the $1,833–$1,840 confluence zone, and failure there could trigger a retest of $1,790–$1,800. A broader market deterioration with BTC falling below $62,000 would likely accelerate this scenario and bring the sub-$1,700 range back into play.
Outlook
ETH enters July 28 in a fragile state — the sharp reversal from yesterday’s $1,945 high back toward $1,872 reflects both profit-taking and broader market weakness, with the BD Pulse Score at 39 and an RSI of 46.57 on the composite view suggesting there is limited momentum buffer to absorb further selling. The $1,858–$1,863 daily EMA20/BB midline zone is the most critical level to monitor over the next 24–48 hours; holding it on a closing basis would keep the medium-term recovery narrative intact, while a breakdown would shift the bias decisively bearish toward $1,800. Bulls will need to see a volume-driven reclaim of $1,906 to stabilize confidence, and any improvement in the broader Fear & Greed reading above 35 would be a constructive supporting signal. Until those conditions materialize, the path of least resistance leans modestly lower.
—
Disclaimer: This analysis is for informational purposes only and does not constitute financial advice. Cryptocurrency markets are highly volatile and unpredictable. All trading decisions should be made based on your own research and risk tolerance. Block Digest is not responsible for any financial losses incurred as a result of acting on this content.