
Market Overview
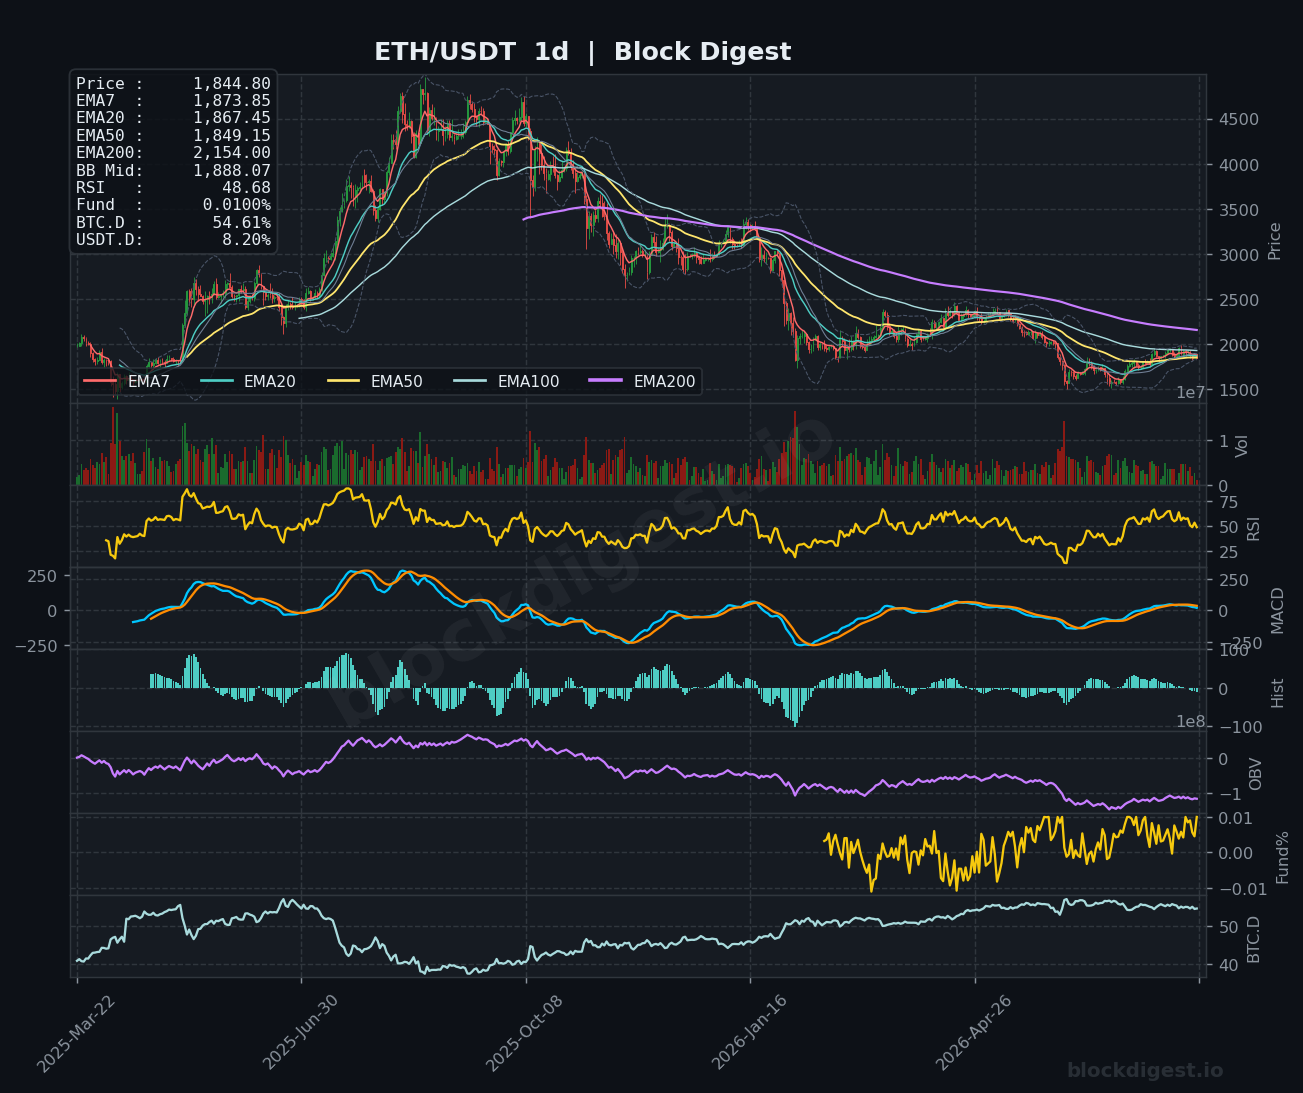
Ethereum is trading at $1,844.80 as of August 3, 2026, sitting beneath all key short-term EMAs on the daily timeframe — the EMA7 at $1,873.85, EMA20 at $1,867.45, and EMA50 at $1,849.15 — confirming that price has slipped into a bearish configuration on the near-term structure. The daily Bollinger Band midline at $1,888.07 now acts as overhead resistance, and with price printing below that level, the band is beginning to narrow in a way that could precede a directional move. The dominant daily trend remains structurally bearish when viewed against the EMA200 at $2,154.00, which looms far above current price, underscoring that the recovery from the multi-month lows earlier in 2026 remains incomplete and fragile. Price is currently consolidating near the lower half of the daily Bollinger Band, a position that historically favors continued downside unless a decisive reclaim of the midline materializes.
Multi-Timeframe Confluence
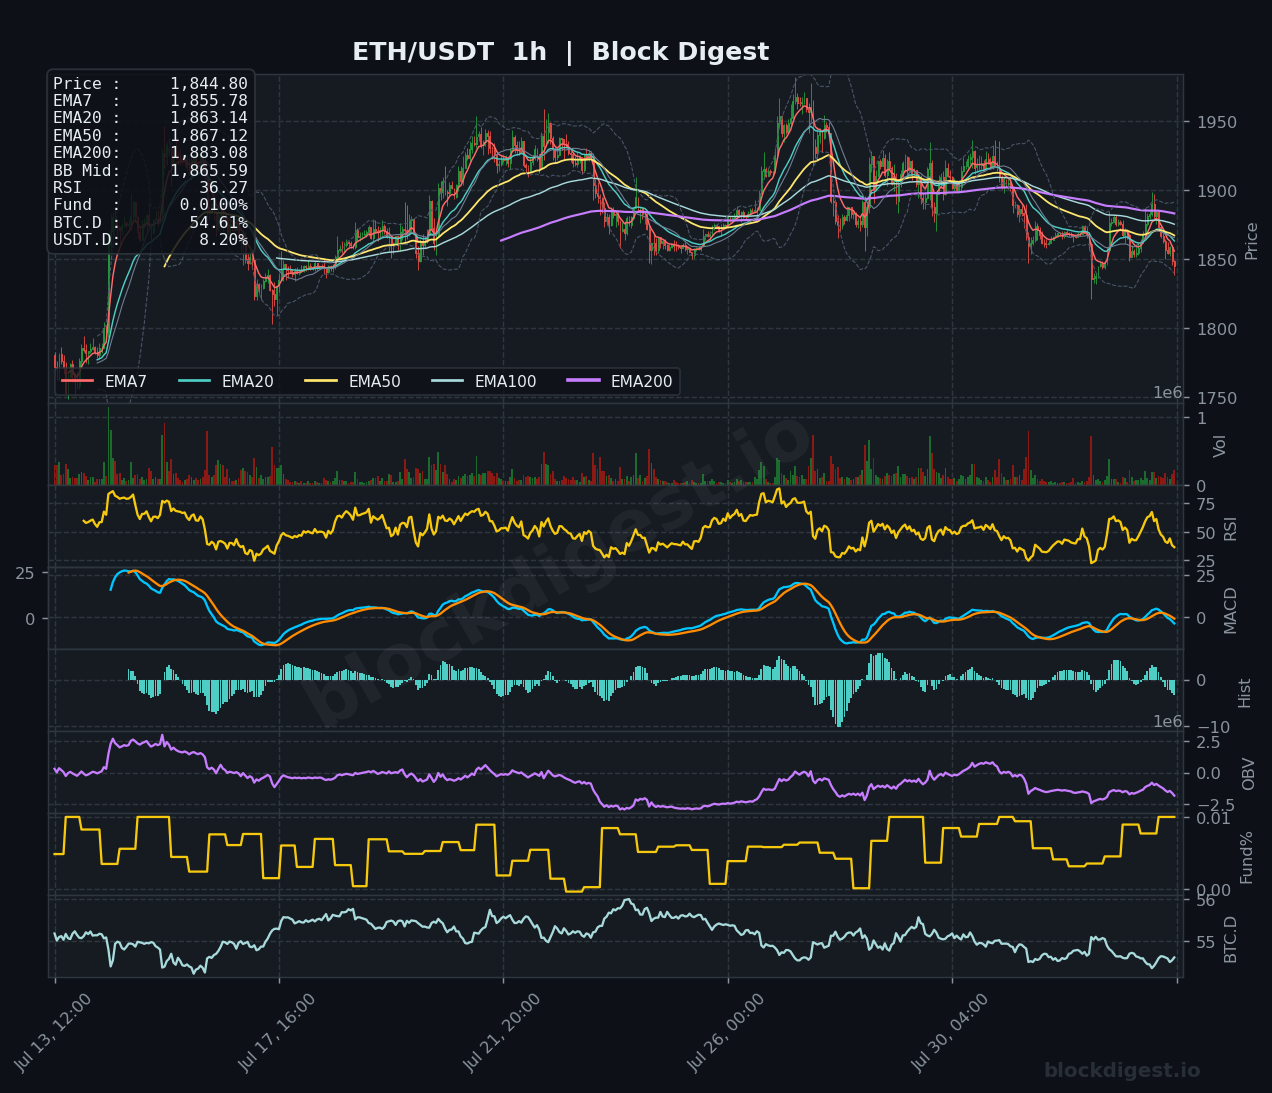
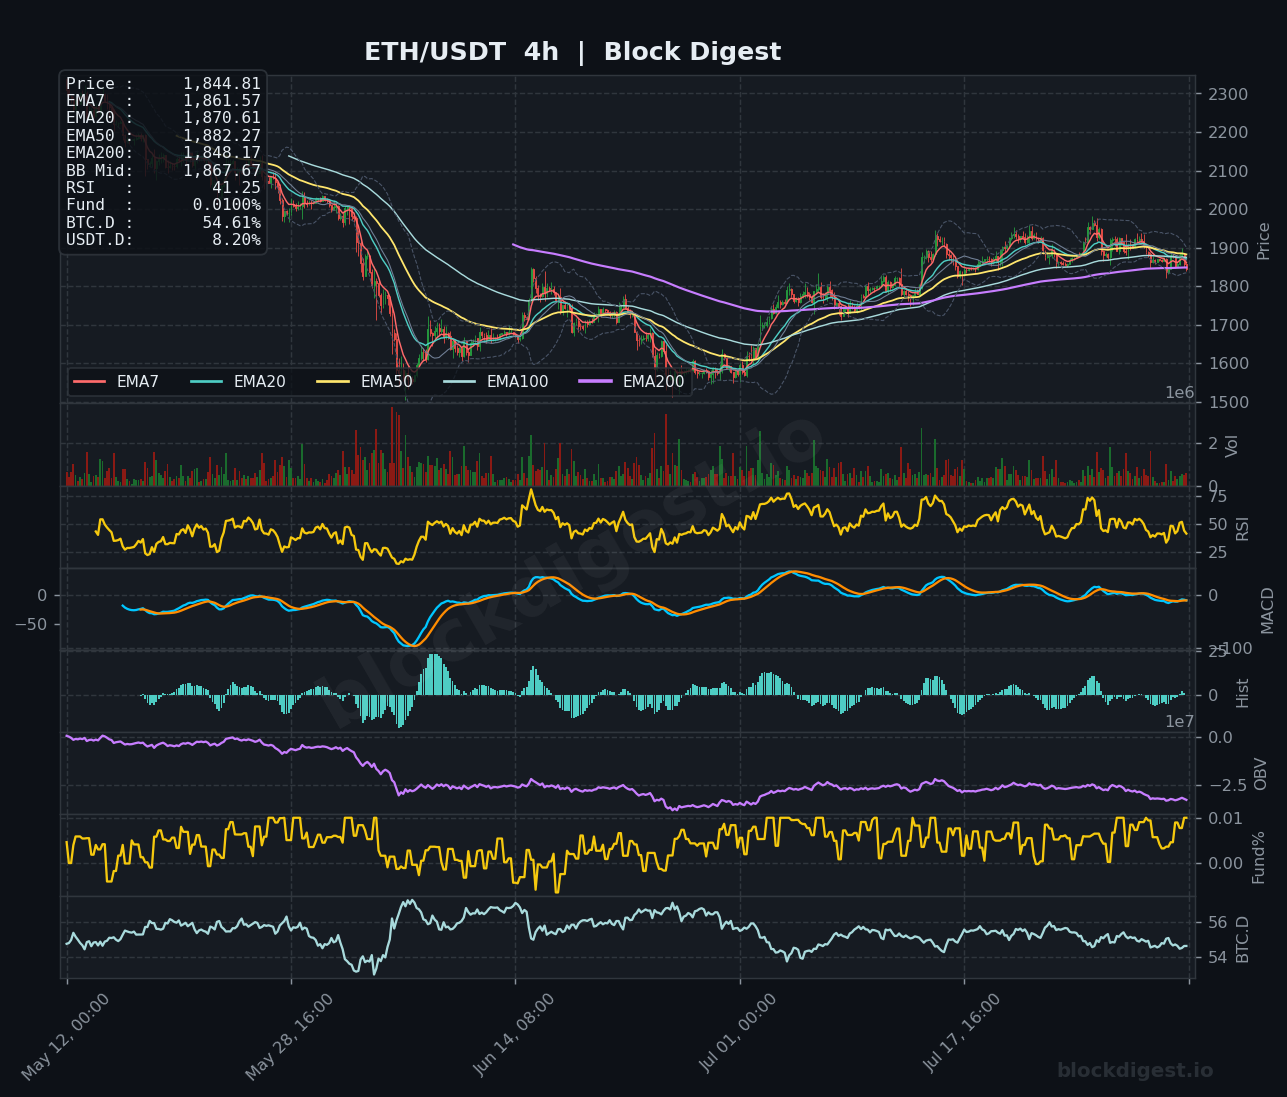
Across all three timeframes, the picture is notably aligned to the downside. On the 1-hour chart, price at $1,844.80 is trading below every EMA — EMA7 ($1,855.78), EMA20 ($1,863.14), EMA50 ($1,867.12), and EMA200 ($1,883.08) — with the stack in full bearish order, signaling that intraday momentum is firmly negative. The 4-hour chart echoes this structure: EMAs are similarly stacked bearishly (EMA7 $1,861.57, EMA20 $1,870.61, EMA50 $1,882.27), with price recently failing to sustain a push above the EMA200 on that timeframe at $1,848.17 — a level now providing a thin near-term battleground. The only modest divergence between timeframes is that the daily RSI at 48.68 remains closer to neutral than the deeply oversold 1-hour RSI at 36.27, suggesting the daily chart still has meaningful downside room before reaching an exhaustion level, while shorter timeframes may be approaching a short-term bounce zone.
Key Levels to Watch
- Resistance: $1,867–$1,870 — the 4-hour EMA20 and daily EMA20 cluster tightly here, making this the first meaningful ceiling any recovery must clear
- Resistance: $1,882–$1,888 — the 4-hour EMA50 and daily Bollinger Band midline converge in this zone, representing the key barrier separating consolidation from a genuine trend reversal attempt
- Resistance: $1,950–$1,960 — the recent swing high visible on the 1-hour chart; reclaiming this area would shift the short-term structure back to bullish
- Support: $1,840–$1,848 — the daily EMA50 at $1,849.15 and 4-hour EMA200 at $1,848.17 form a critical confluence zone; a confirmed close below this area accelerates selling
- Support: $1,800 — a psychologically significant round number that previously acted as resistance-turned-support during the mid-year recovery phase
- Support: $1,750–$1,760 — the next substantial demand zone visible on the 4-hour chart, where price based during a prior accumulation period before the recovery leg higher
Momentum & On-Chain Signals
Block Digest’s proprietary BD Pulse indicator is currently reading 34/100 — firmly in bearish territory — and the RSI on our model sitting at 43.74 corroborates the weakening momentum story, with the 1-hour RSI at 36.27 approaching oversold conditions without yet triggering a meaningful relief bounce. The 4-hour MACD is trending near the zero line with a marginally negative histogram, indicating momentum is decelerating but has not yet generated a clear bearish crossover to confirm the next leg lower. On the 1-hour chart, the MACD histogram is firmly negative and expanding slightly, consistent with fresh short-term selling pressure. OBV on the daily timeframe has been in a gradual downtrend since the recovery peak, suggesting that the recent price strength seen in July was not supported by commensurate volume accumulation — distribution, rather than accumulation, appears to be the dominant on-chain flow. The funding rate at +0.0089% is mildly positive, meaning longs are still paying shorts; given the bearish price action, this creates a modest squeeze risk to the downside if longs begin to unwind.
BTC Dominance & Market Sentiment
BTC dominance is sitting at 54.65%, a level that has been elevated for several months and continues to suggest that capital remains relatively concentrated in Bitcoin rather than rotating broadly into altcoins. While ETH has outperformed BTC by approximately 21.6% over the past month — a notable divergence — today’s session shows that outperformance is under pressure, and any acceleration in BTC dominance from current levels would likely weigh disproportionately on ETH. USDT dominance at 8.20% remains elevated, reflecting a persistent defensive posture from market participants and limited appetite for fresh risk deployment.
Risk Scenarios
- Bullish case: A convincing hourly close back above $1,867–$1,870 — reclaiming the 4-hour EMA20 and daily EMA20 cluster — would signal that buyers have absorbed the recent selling and could trigger a move toward $1,888 and potentially $1,950 if volume confirms. A sustained hold above the $1,848 EMA50/EMA200 confluence on elevated volume over the next 24 hours would be the minimum condition to shift the short-term bias neutral.
- Bearish case: A daily close below the $1,840–$1,848 confluence zone — particularly the daily EMA50 — would represent a meaningful technical deterioration, opening a path toward $1,800 and subsequently the $1,750–$1,760 demand zone. Continued expansion of the 1-hour MACD histogram to the downside alongside a funding rate flush would confirm capitulation selling is underway.
Outlook
The technical setup for ETH on August 3, 2026, carries a cautious bearish bias in the near term, with price trading below all key short-term EMAs across the 1-hour and 4-hour timeframes and momentum indicators broadly pointing lower. The $1,848–$1,849 zone — where the daily EMA50 and 4-hour EMA200 converge — is the single most important level to monitor over the next 24–48 hours; holding above it keeps the broader recovery structure intact, while a clean break below opens a more significant corrective move. The BD Pulse reading of 34/100 reinforces the view that this is not a moment for aggressive positioning, and traders should wait for either a confirmed reclaim of $1,870 or a flush toward $1,800 before reassessing. Until price clears $1,888 on meaningful volume, the path of least resistance remains to the downside.
—
Disclaimer: This analysis is for informational purposes only and does not constitute financial advice. Cryptocurrency markets are highly volatile and unpredictable. All trading decisions should be made based on your own research and risk tolerance. Block Digest is not responsible for any financial losses incurred as a result of acting on this content.
Stay Ahead of the Market
Follow BlockDigest for crypto market intelligence, research and real-time updates.


