
Market Context
The altcoin market shows mixed conditions with Bitcoin dominance at 55.95% and USDT dominance at 7.15%, suggesting modest risk appetite across the space. Most major altcoins remain below key moving averages, though several are displaying stabilization after recent weakness. The relatively elevated USDT.D reading indicates some defensive positioning, while the moderate BTC.D level suggests altcoins retain room for selective outperformance should broader market conditions improve.
Solana (SOL)
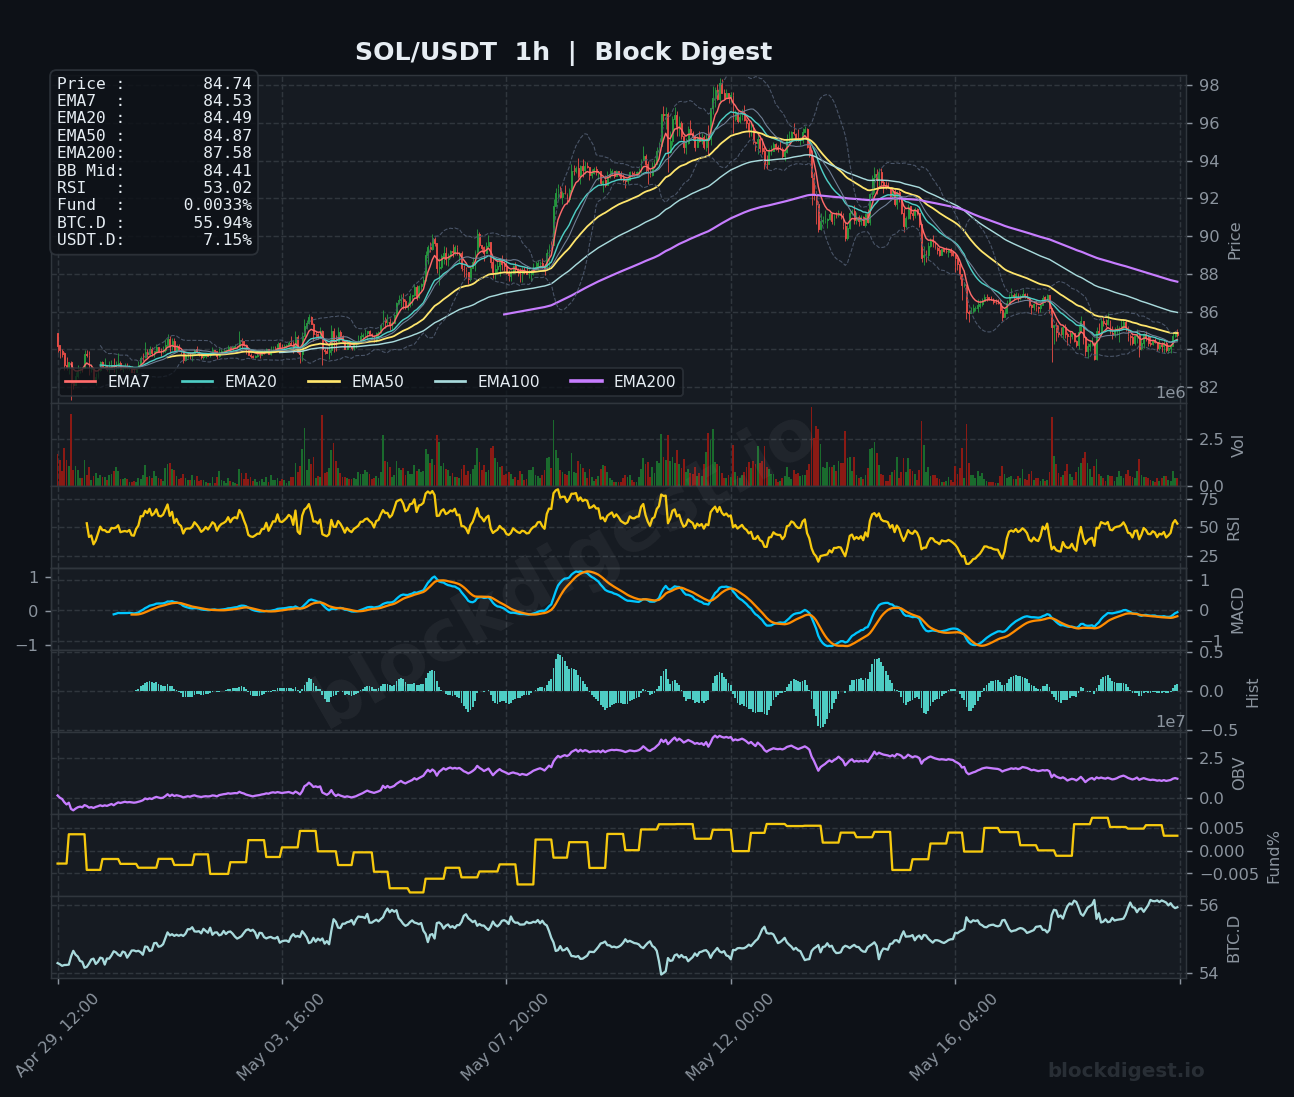
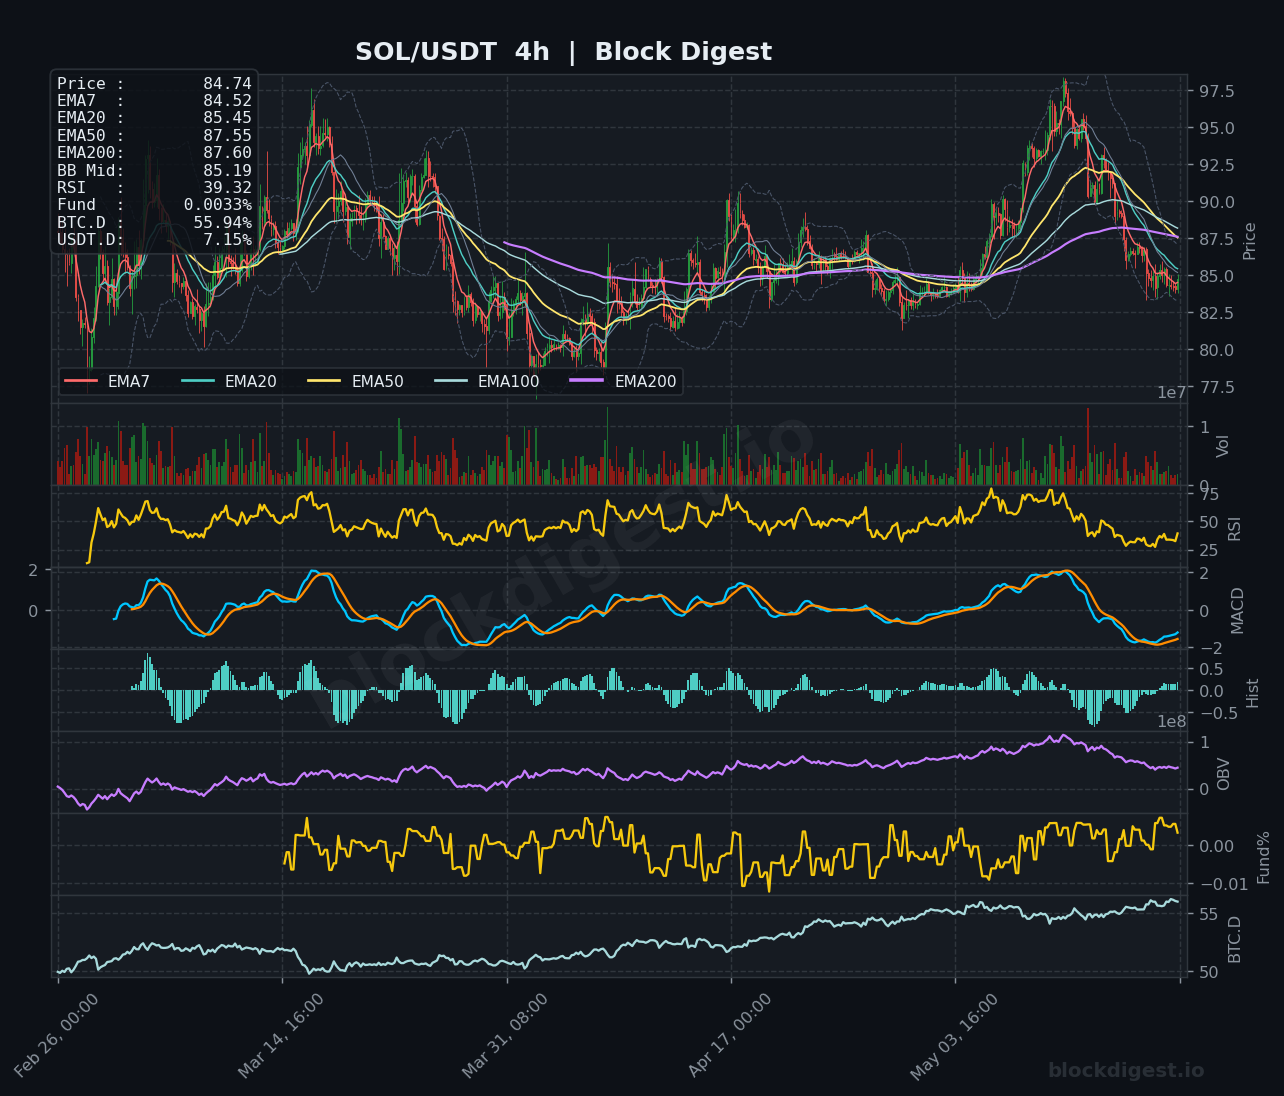
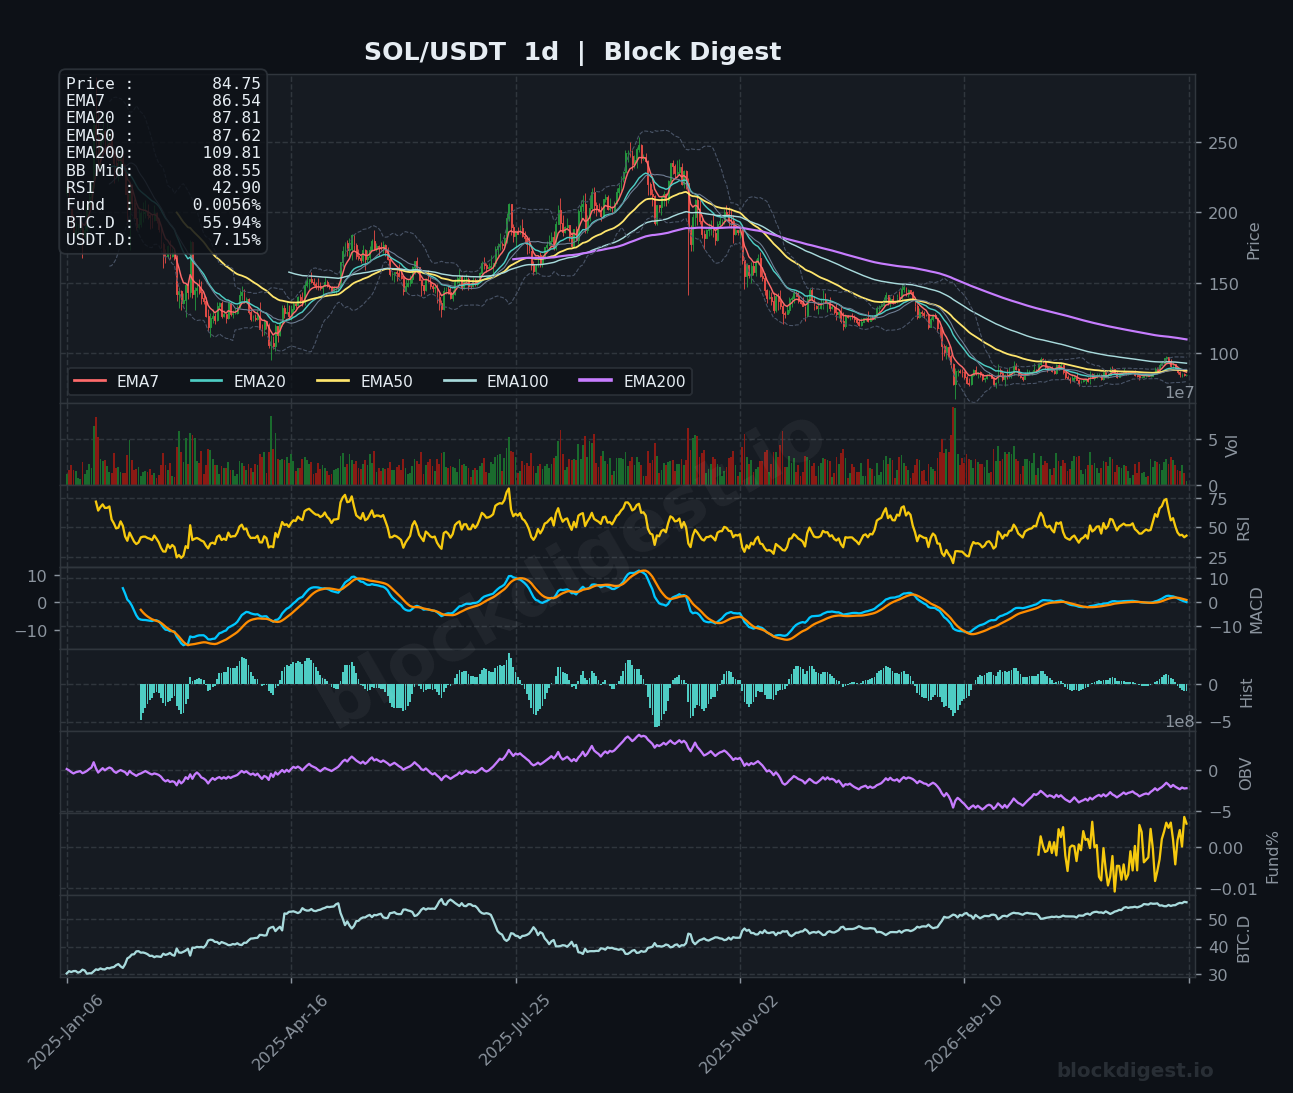
Solana trades at $84.74, consolidating below its 200-day EMA at $87.60 after failing to sustain recent recovery attempts. The 1-hour chart shows price compressed between $84-$85.50, with the RSI at 53.02 indicating neutral momentum. On the 4-hour timeframe, SOL is testing support at the $84.50 level with RSI at 39.32 showing oversold conditions developing. The MACD remains in bearish territory across timeframes, though histogram bars are narrowing, suggesting diminishing downside momentum. A decisive break above $87.60 would signal renewed bullish structure, while failure to hold $84 risks further decline toward the $80 support zone.
XRP (XRP)
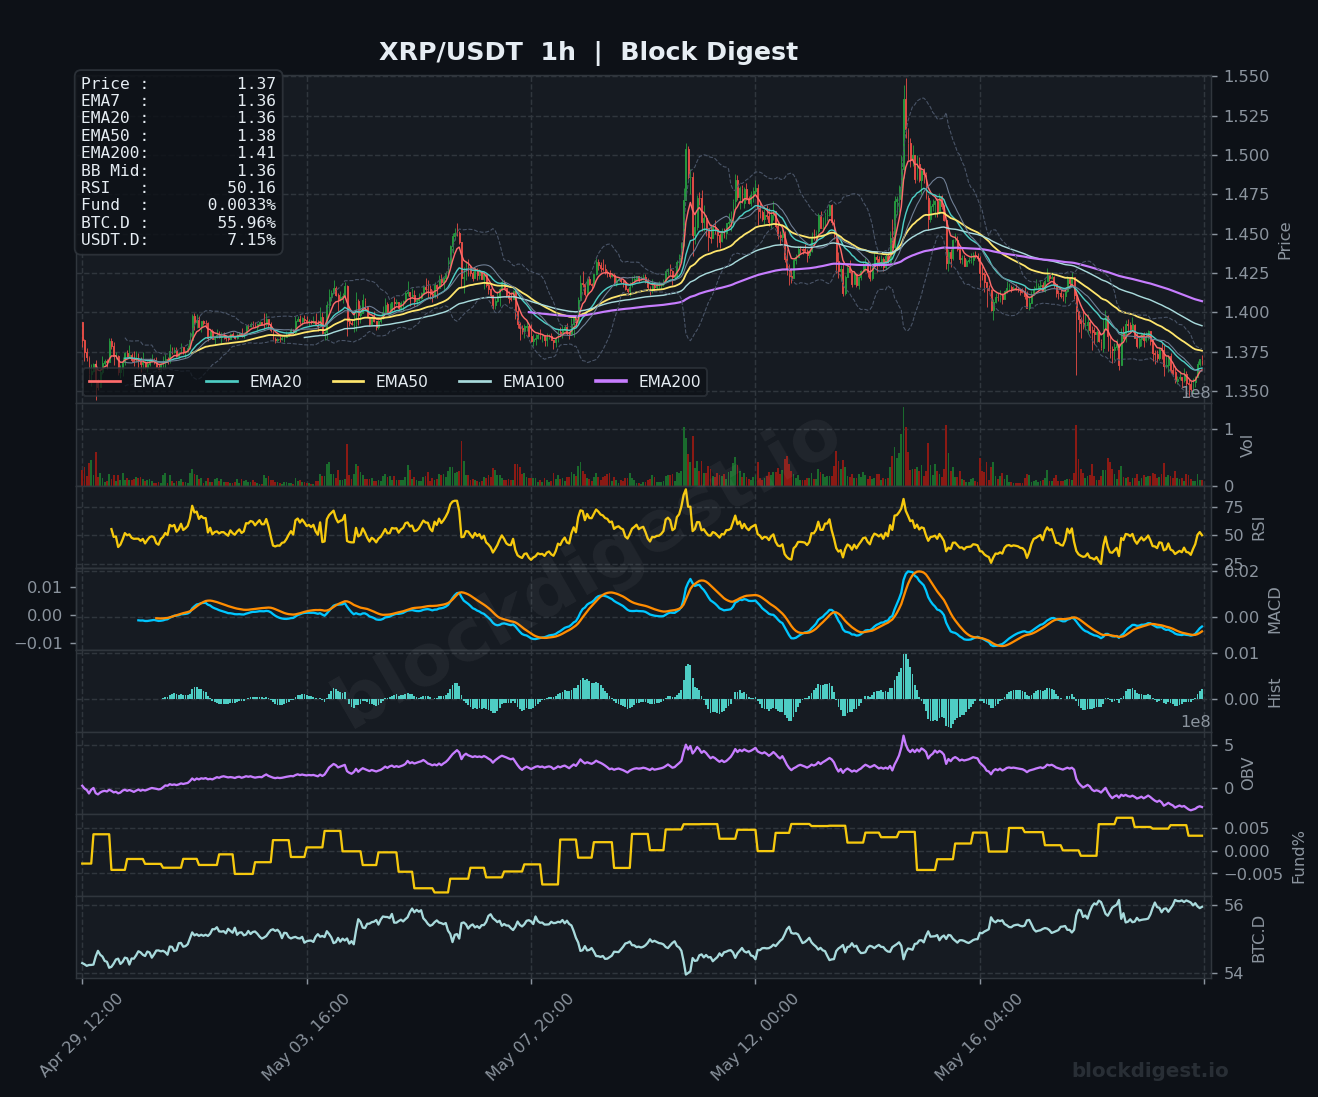
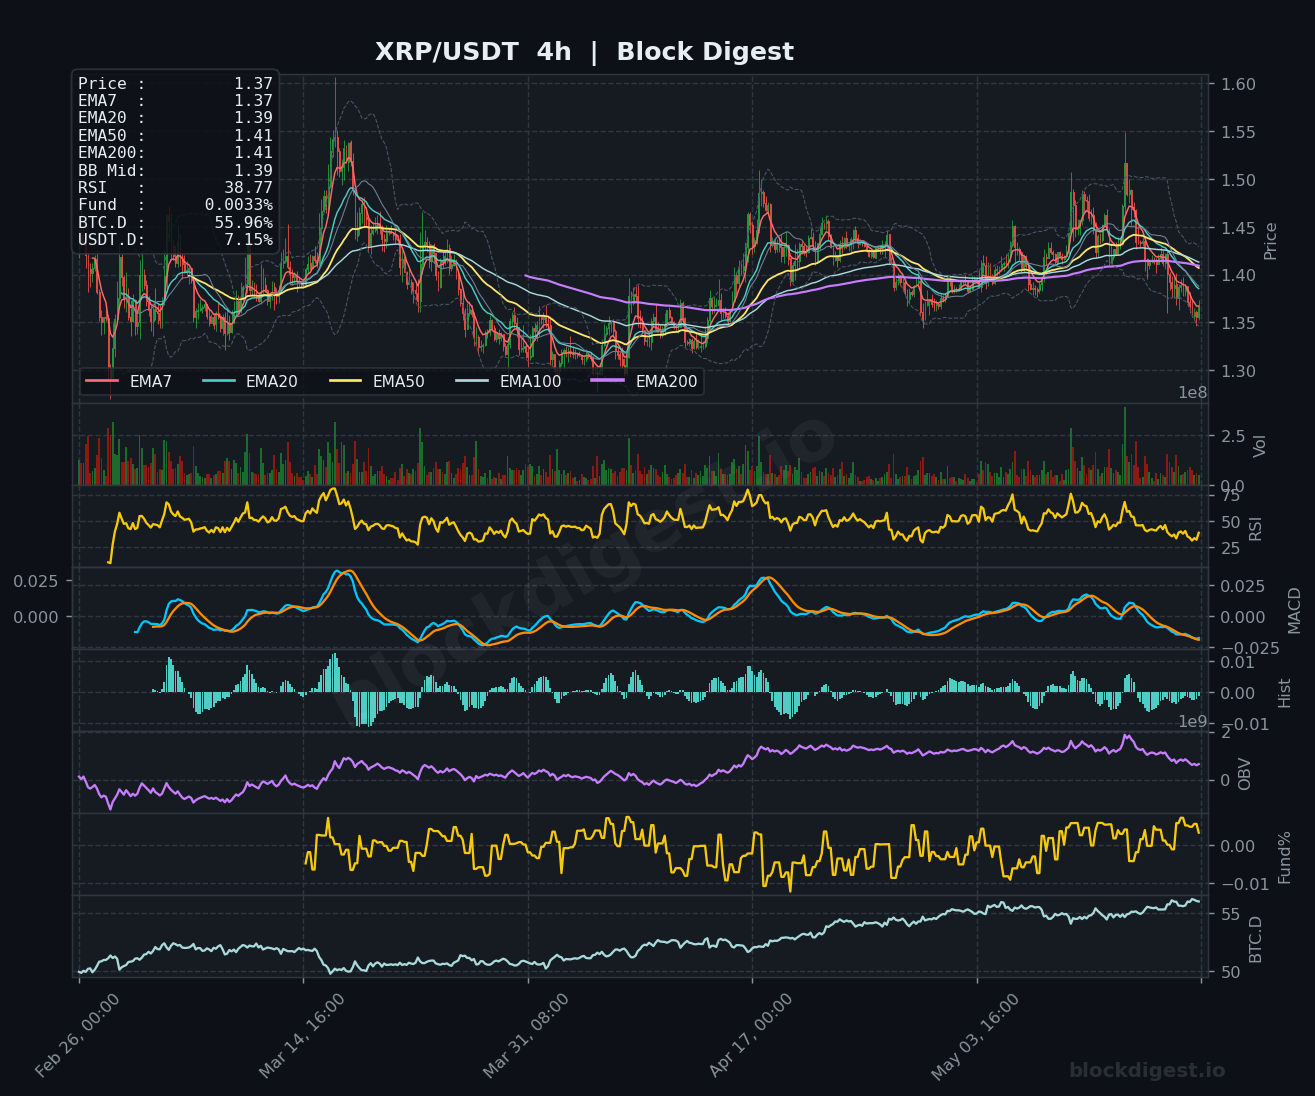
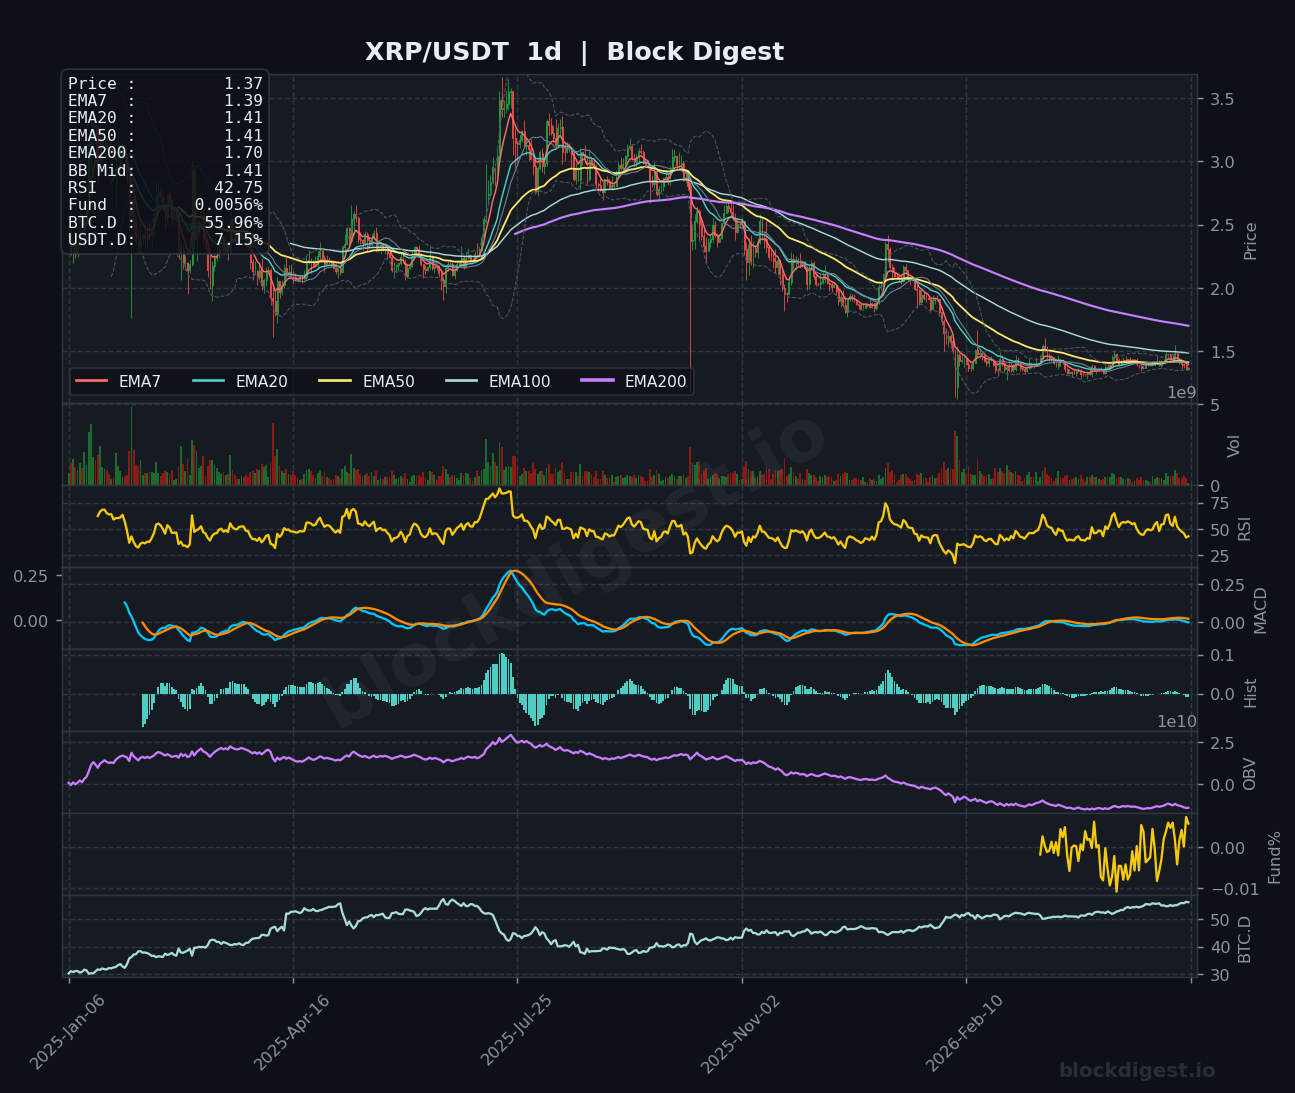
XRP continues its downtrend at $1.37, trading well below all major moving averages with bearish structure intact. The token failed to reclaim the $1.41 resistance (EMA200) and has steadily declined, with the 1-hour RSI at 50.16 showing neutral momentum after recent weakness. The 4-hour chart reveals RSI at 38.77, approaching oversold territory, while the MACD remains negative with bearish crossover intact. Daily charts show XRP at $1.37, down significantly from recent highs, with RSI at 42.75 suggesting room for further downside before reaching oversold extremes. Key support lies at $1.30, with resistance at $1.41-$1.50 capping recovery attempts.
BNB (BNB)
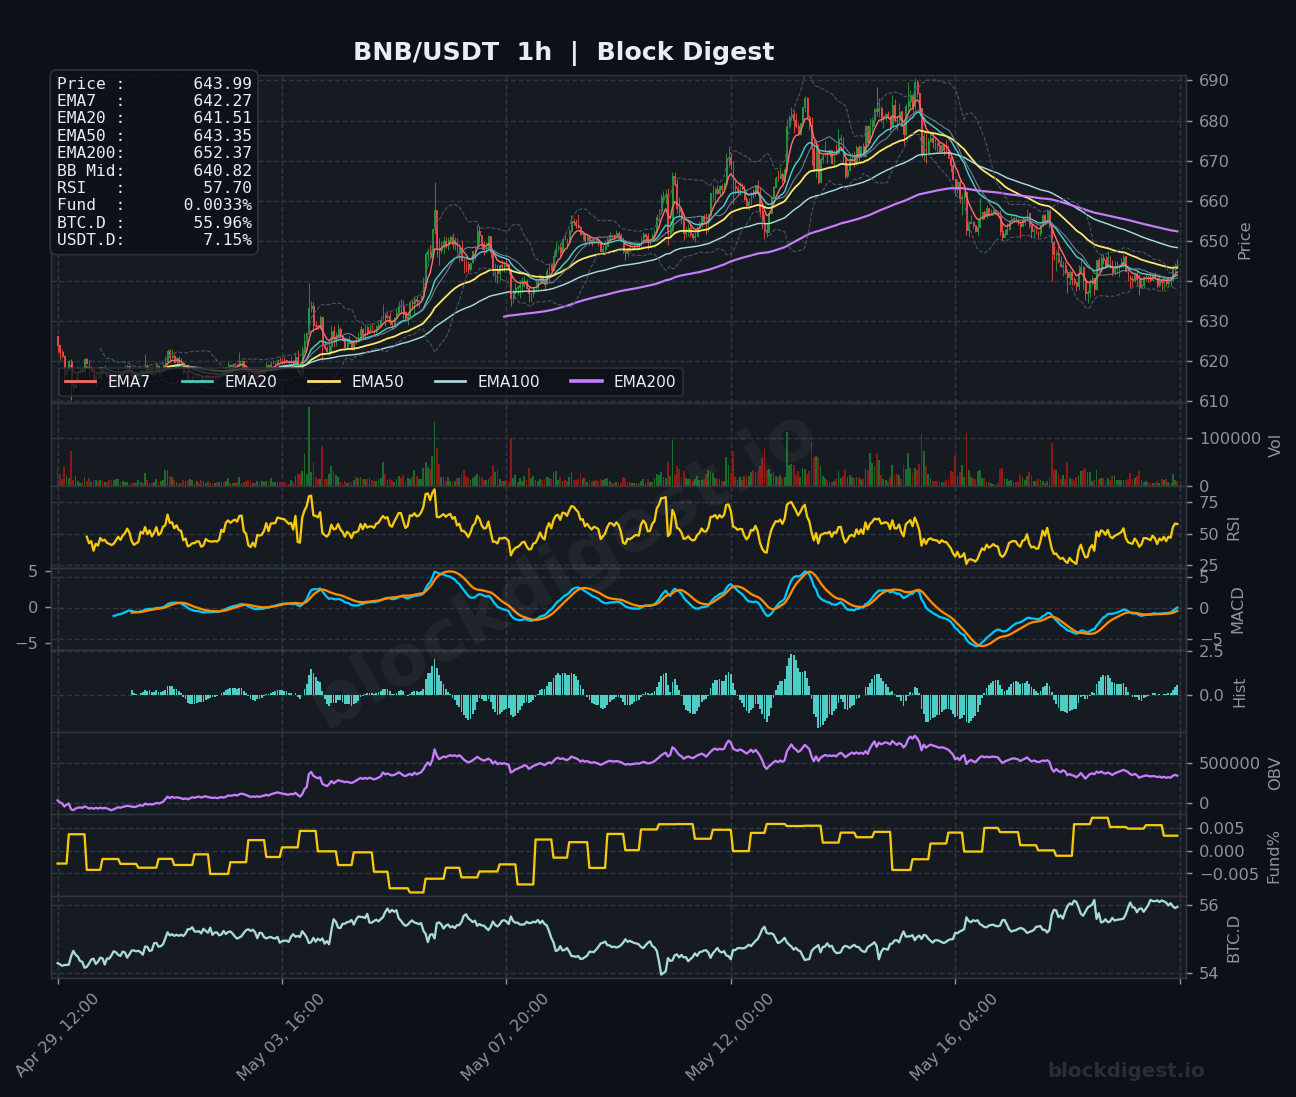
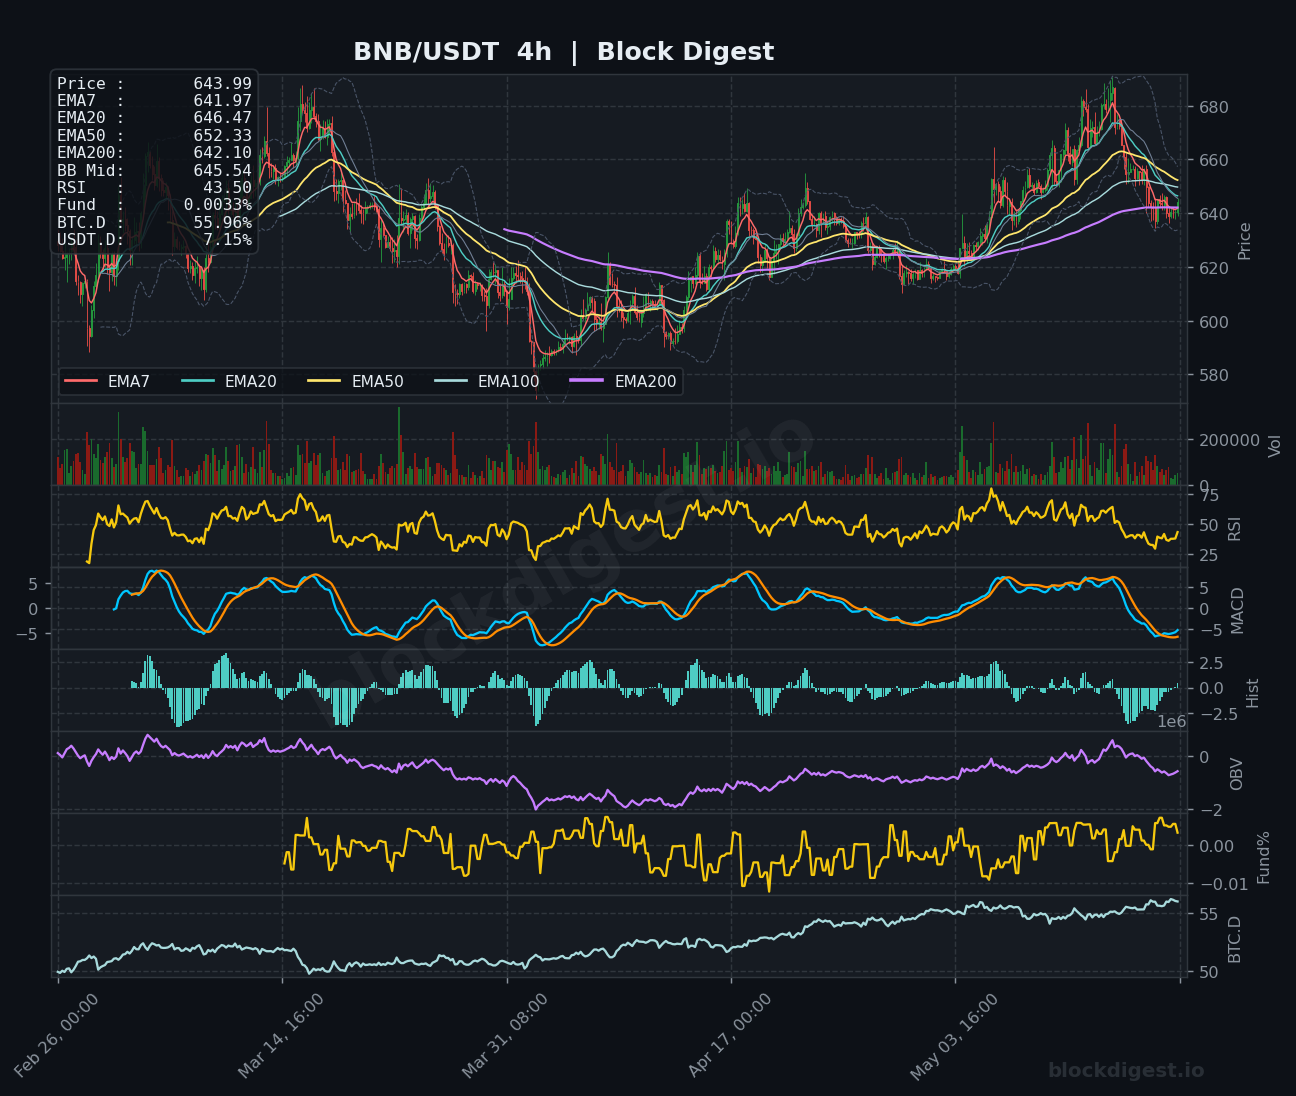
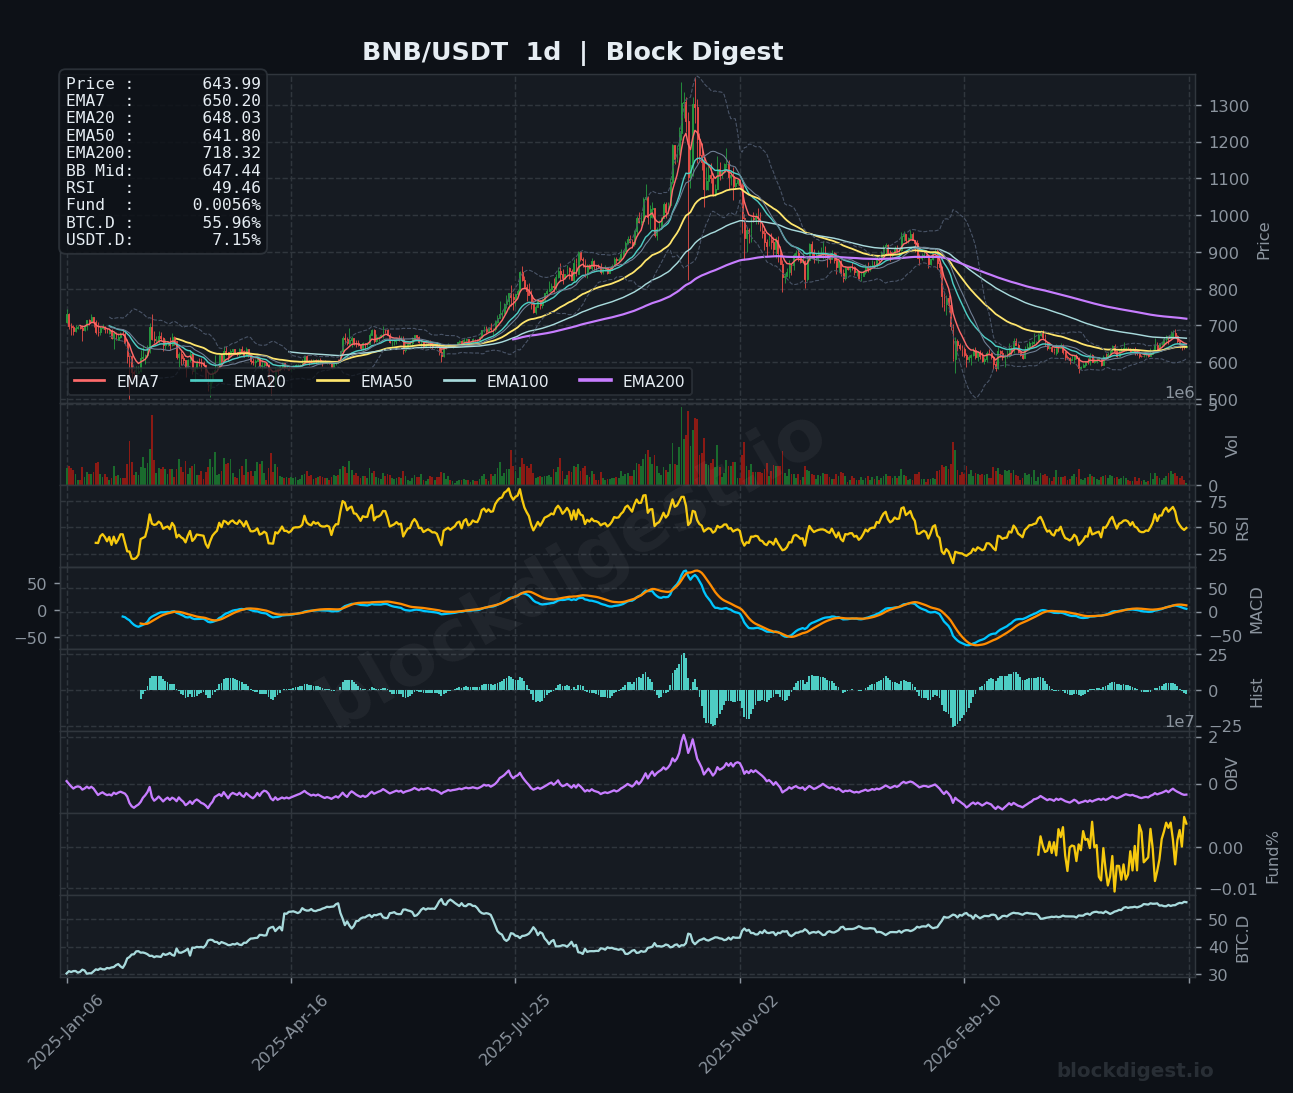
BNB trades at $643.99, consolidating in a tight range around the $640-$650 level after recent volatility. The 1-hour chart shows price hovering near the BB midpoint with RSI at 57.70, indicating balanced momentum. On the 4-hour timeframe, BNB has recovered from the $640 support with RSI at 43.50, though still below neutral, suggesting cautious buyer interest. The daily chart reveals BNB trading below the 200-day EMA at $718.32 with RSI at 49.46, reflecting indecisive conditions. The MACD shows flattening bearish momentum, potentially setting up for a bullish crossover if buying pressure sustains above $640 support.
Dogecoin (DOGE)
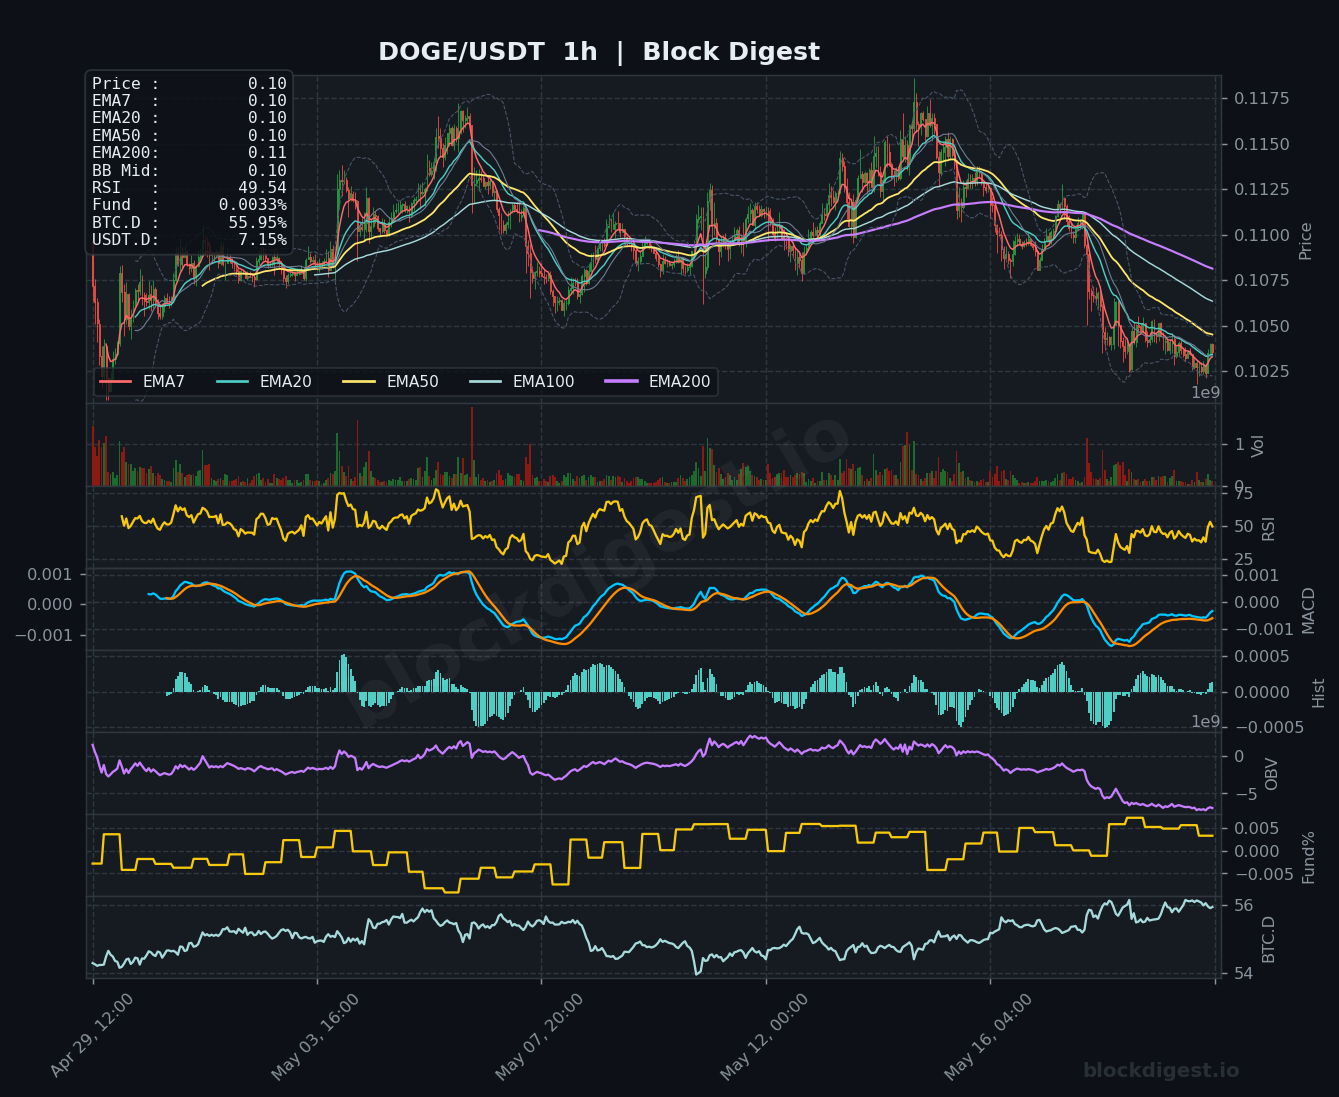
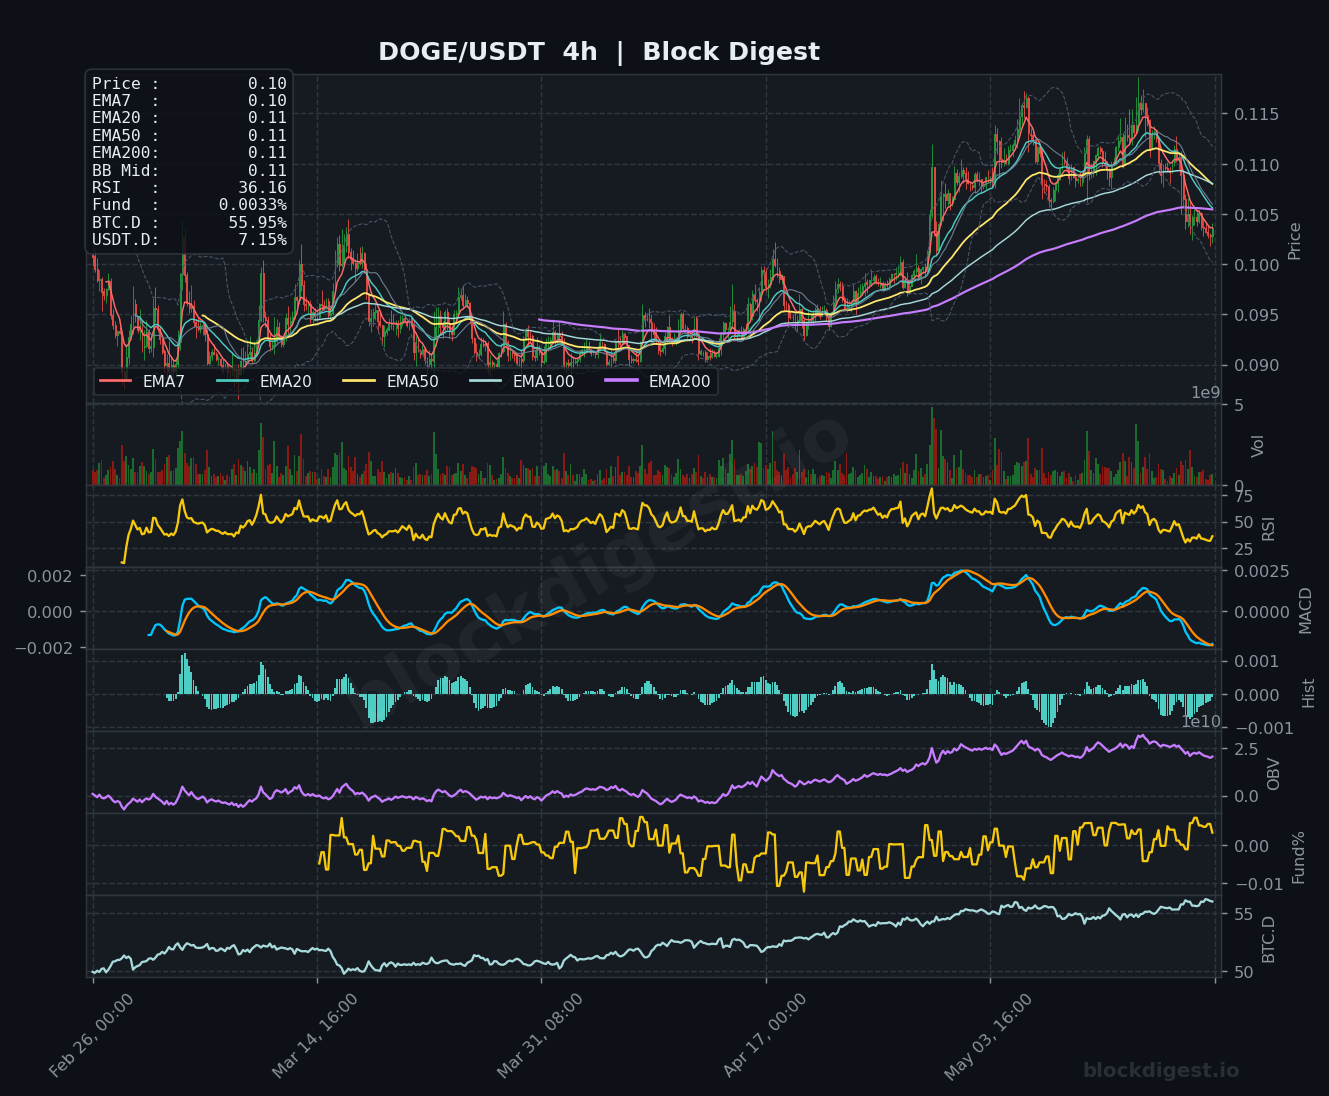
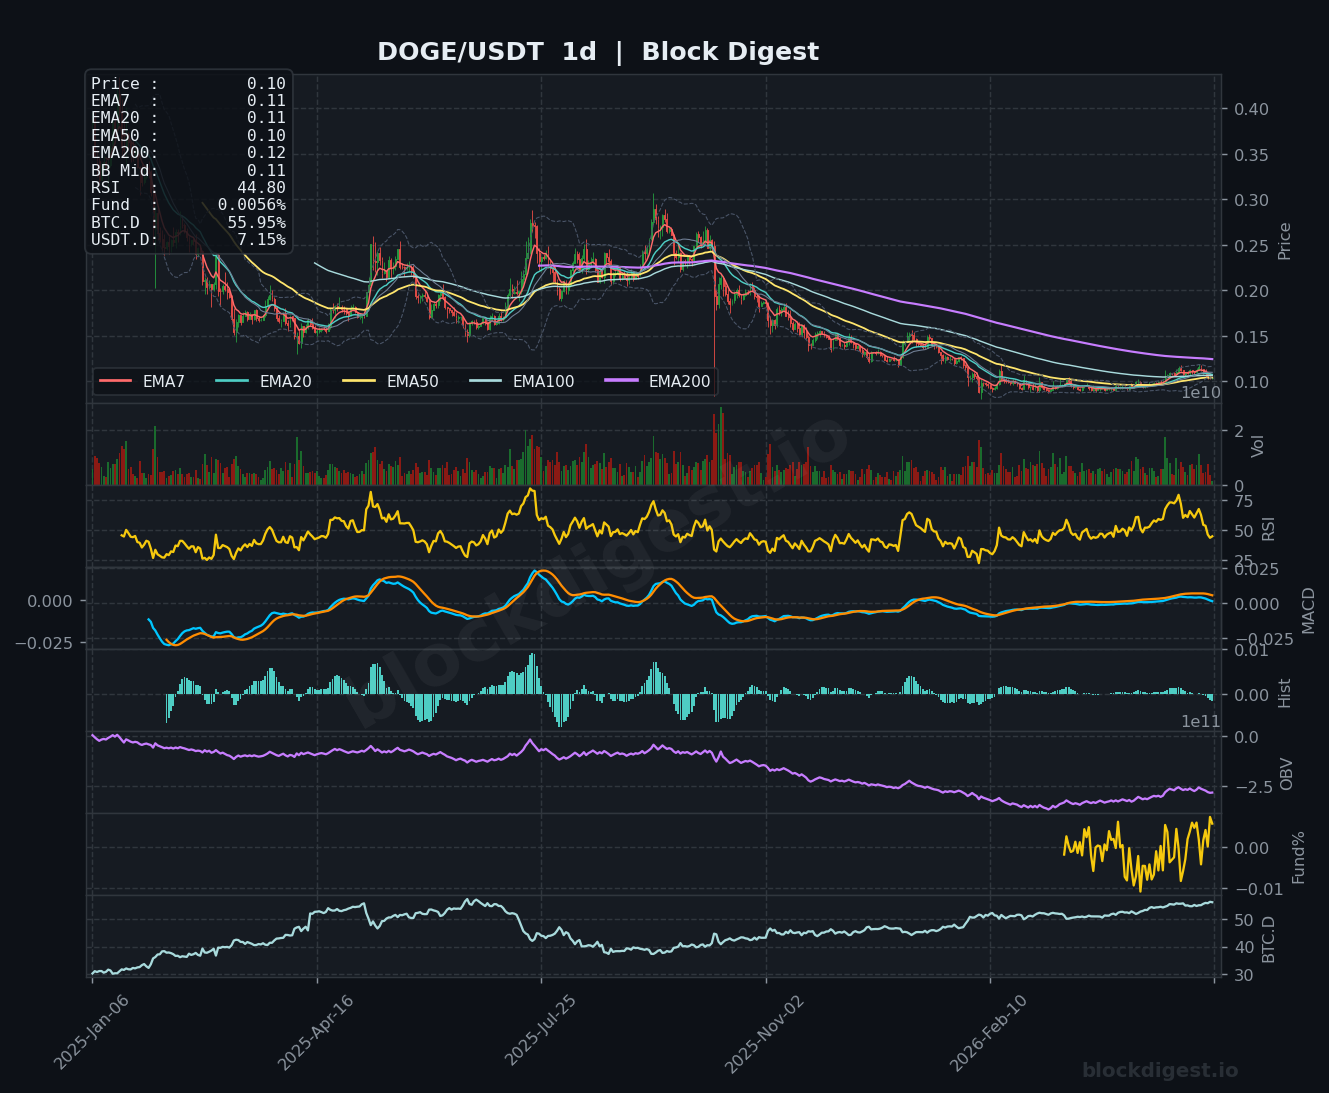
Dogecoin remains under pressure at $0.104, trading below all significant moving averages with a clear downtrend in place. The 1-hour RSI at 49.54 shows neutral momentum after recent stabilization attempts, while the 4-hour chart displays RSI at 36.16, nearing oversold conditions. Price action shows compression between $0.102-$0.105, with the MACD deeply negative across all timeframes, indicating sustained bearish pressure. The daily RSI at 44.80 suggests further downside risk before reaching capitulation levels. Critical support sits at $0.100, a psychological level that could attract buying interest, while resistance lies at $0.110-$0.115.
Litecoin (LTC)
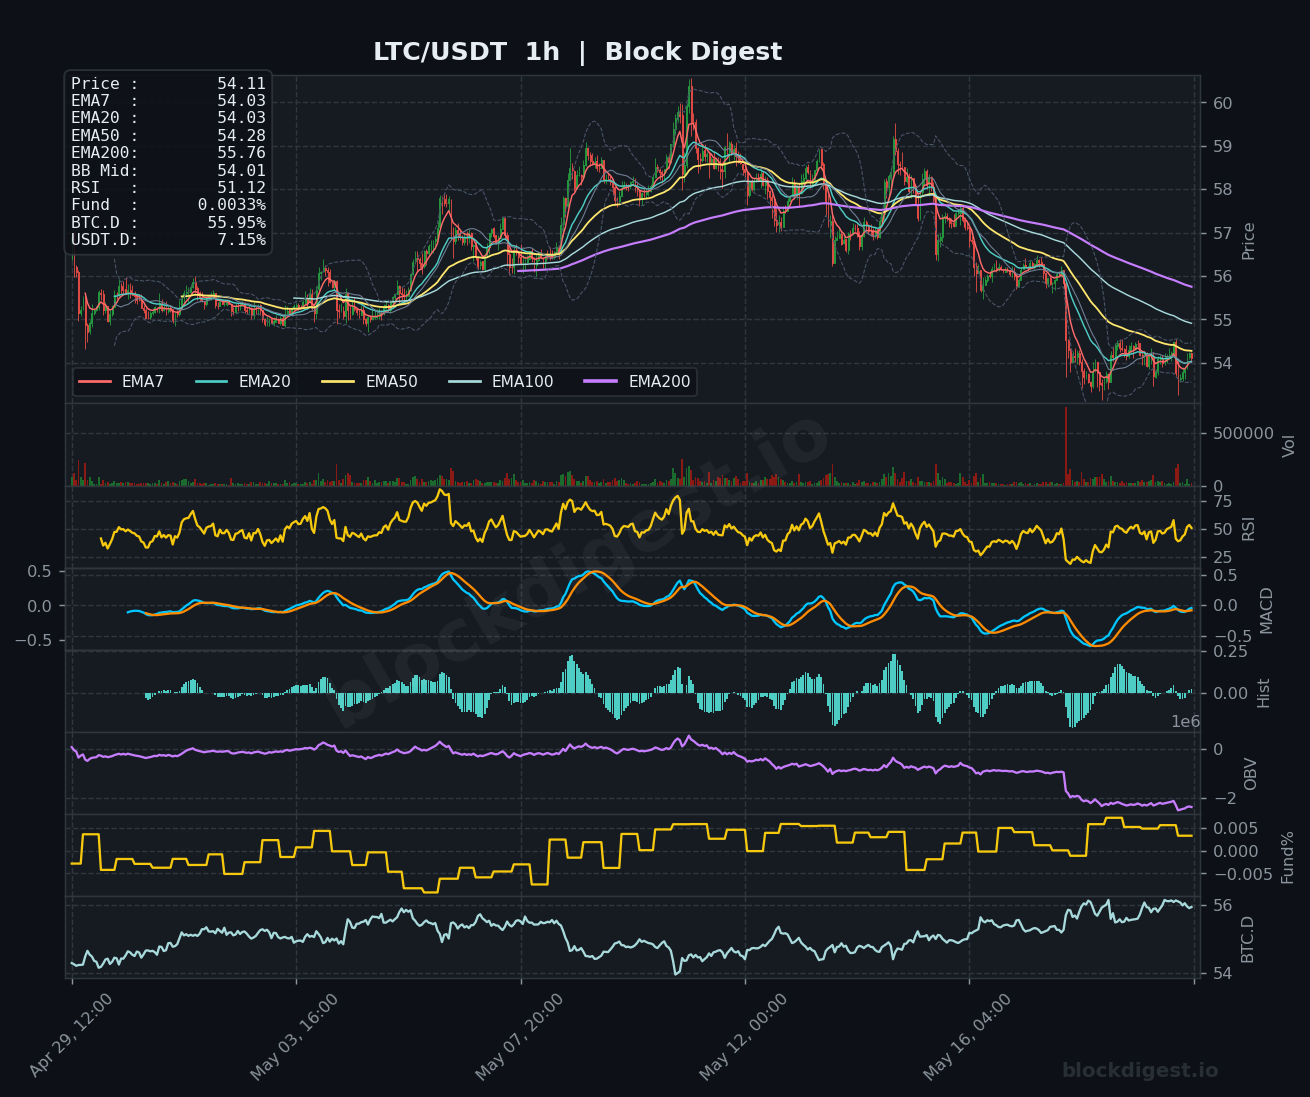
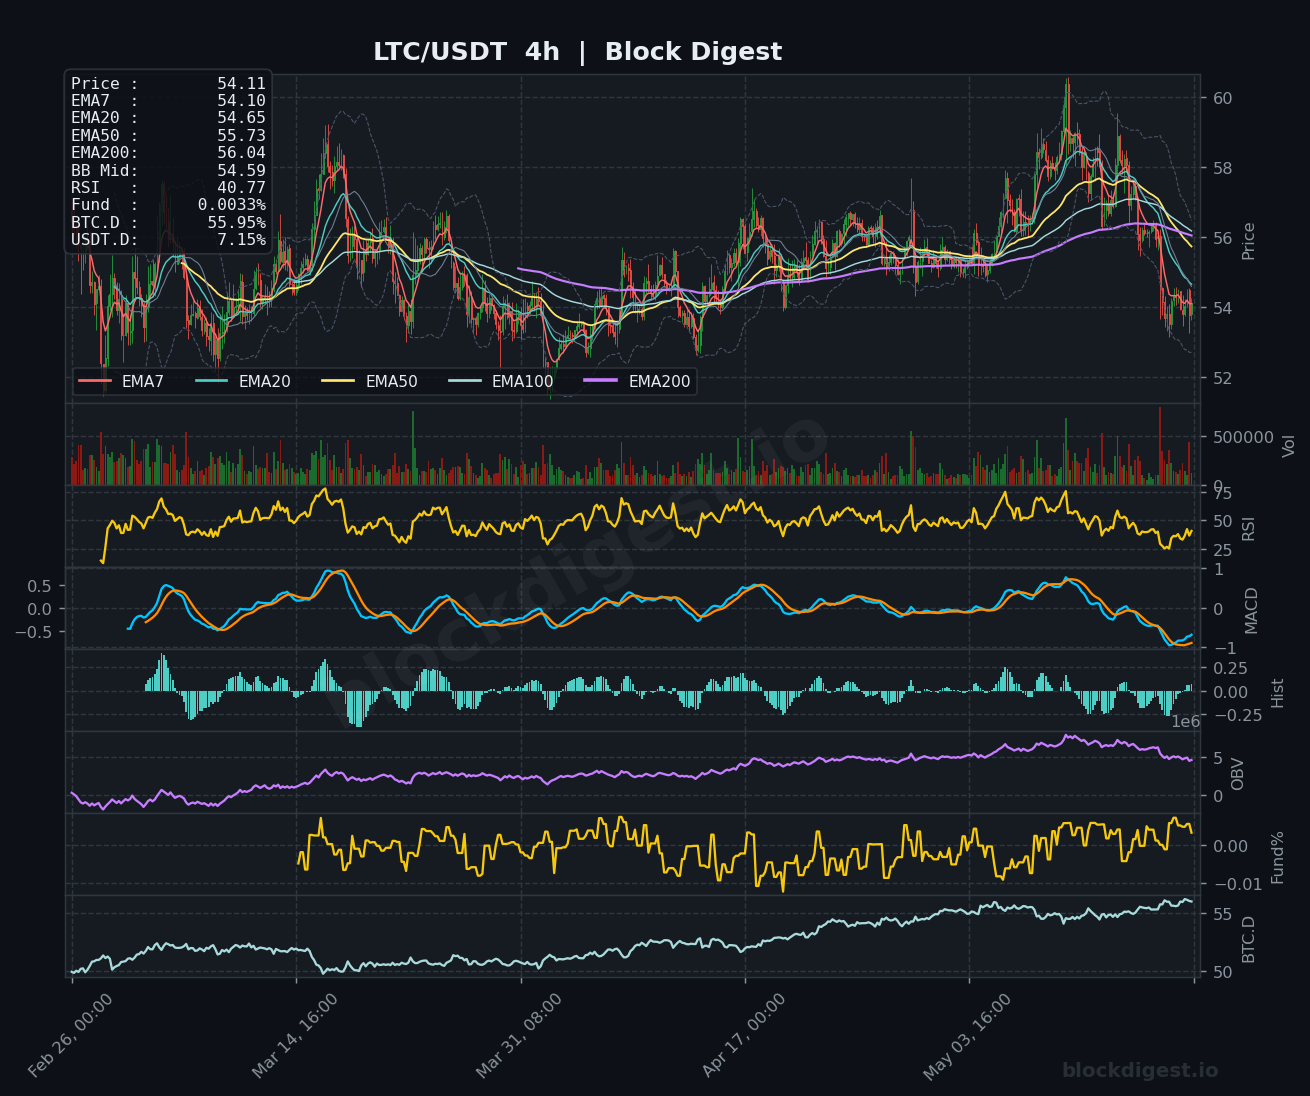
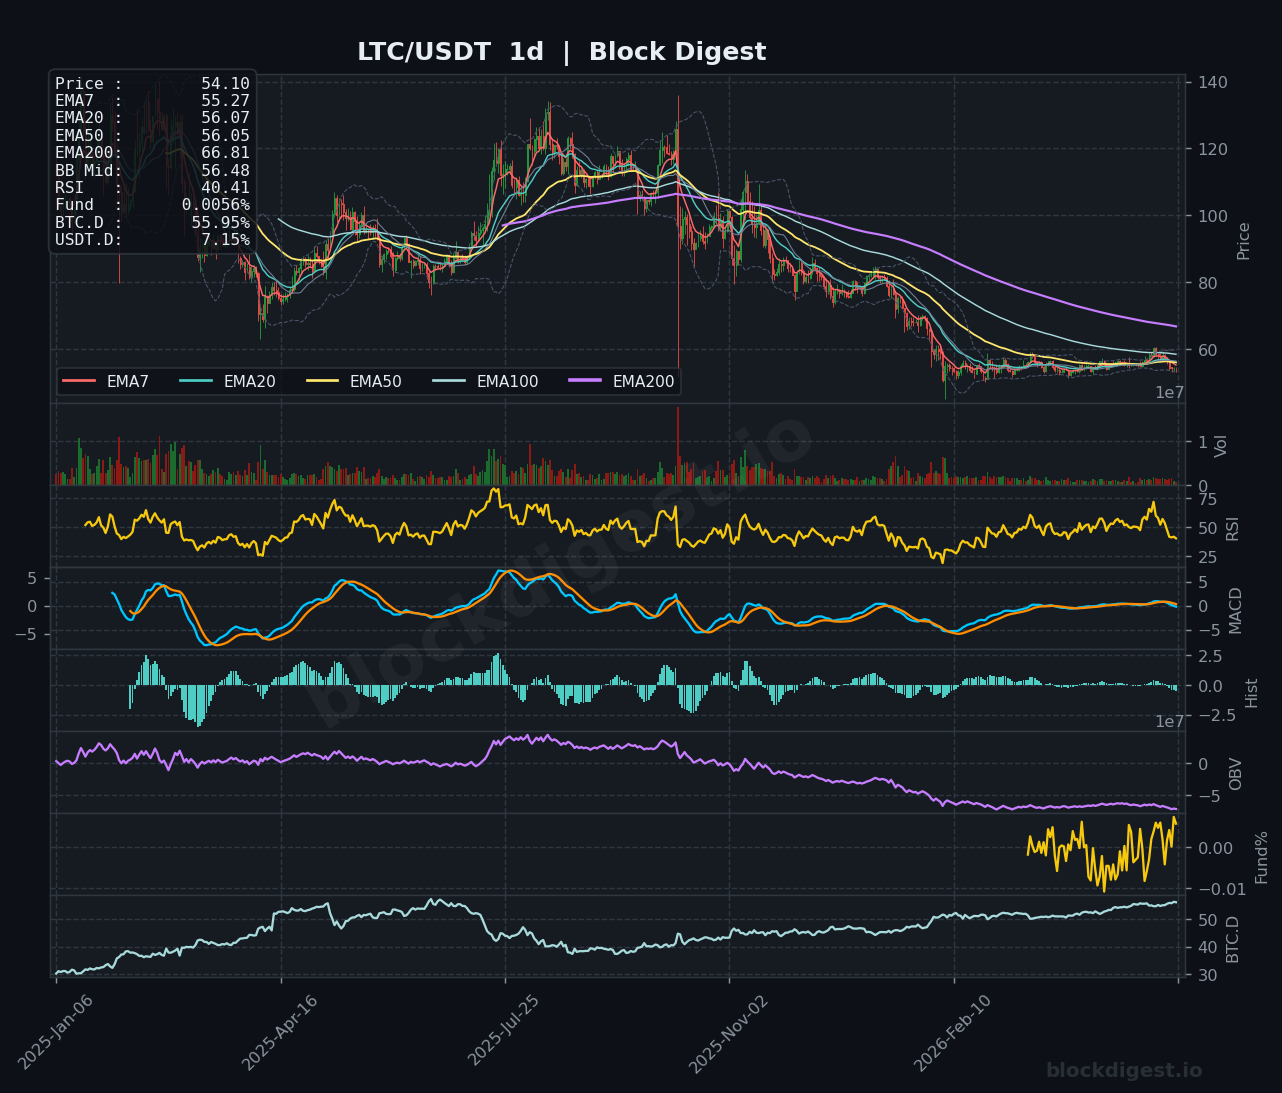
Litecoin trades at $54.11, showing signs of stabilization after extended weakness, hovering near the cluster of short-term moving averages. The 1-hour chart displays RSI at 51.12 with price testing resistance at $54.30, while the 4-hour timeframe shows RSI at 40.77, reflecting oversold recovery momentum. LTC remains below its 200-day EMA at $66.81, trading at multi-month lows with RSI at 40.41 on the daily chart. The MACD is showing early signs of bullish divergence, with histogram bars narrowing despite continued negative territory. A sustained break above $55.75 could spark short-term relief, while failure to hold $53.50 risks accelerated selling toward $50.
TRON (TRX)
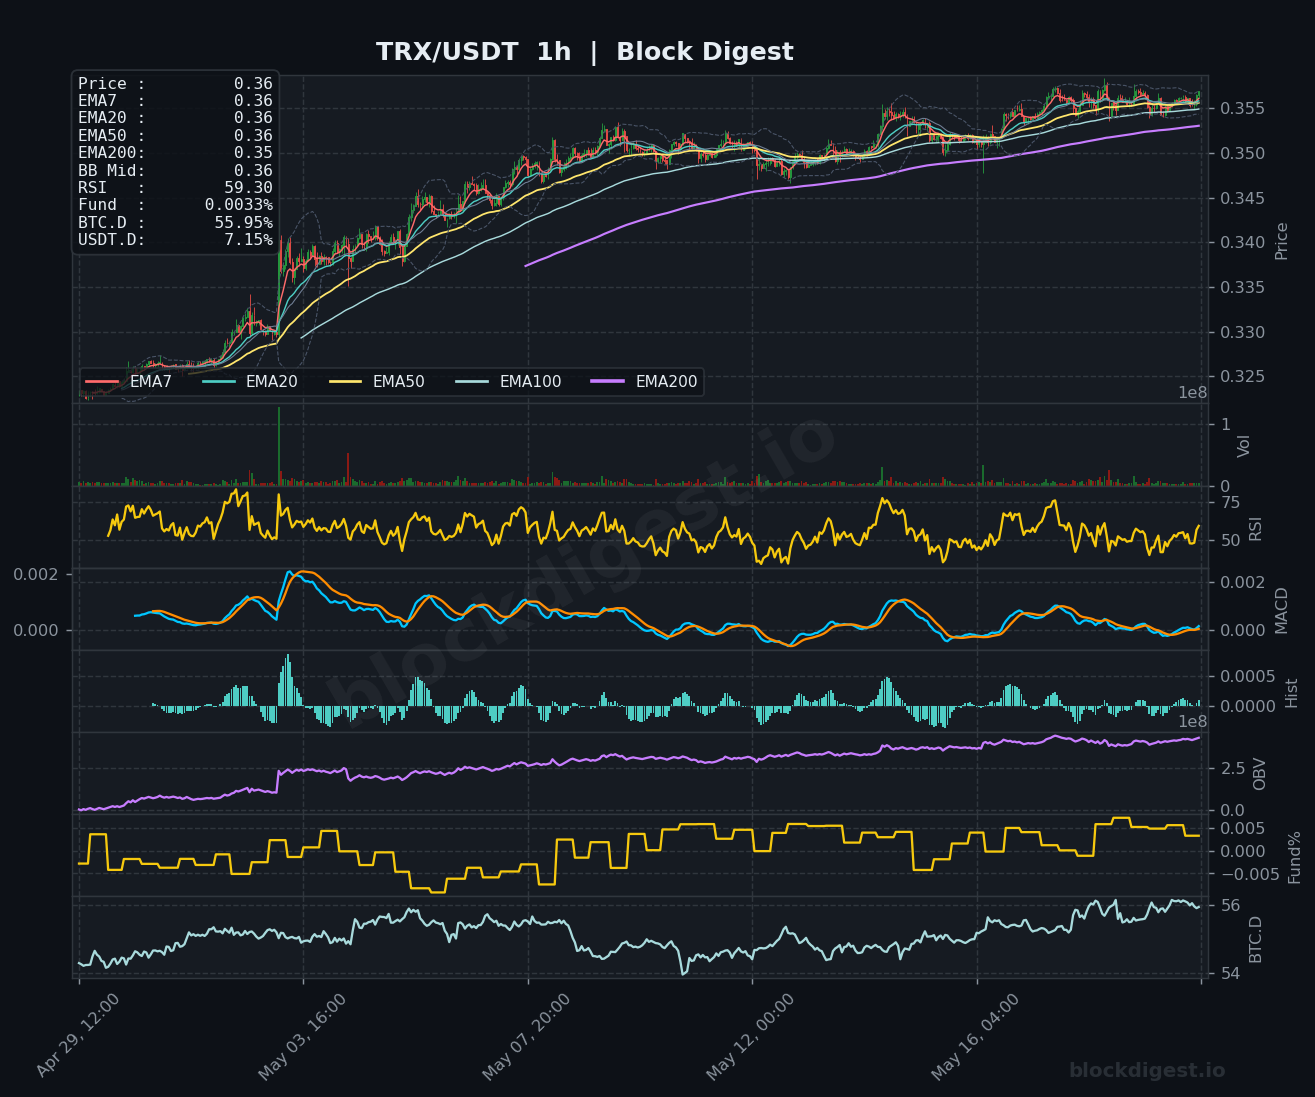
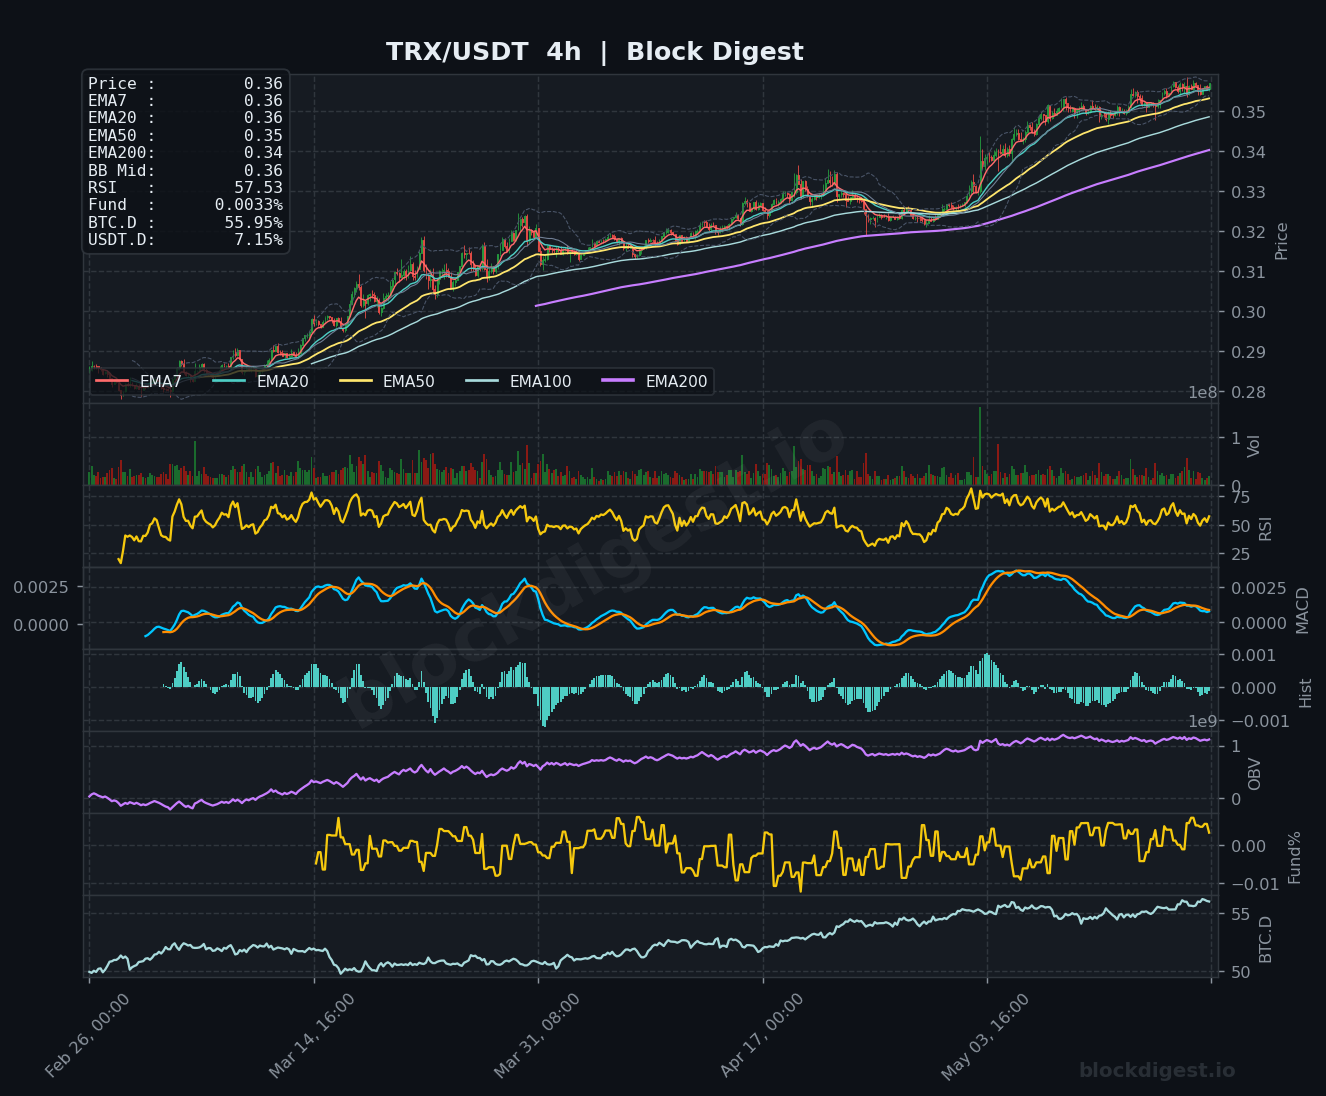
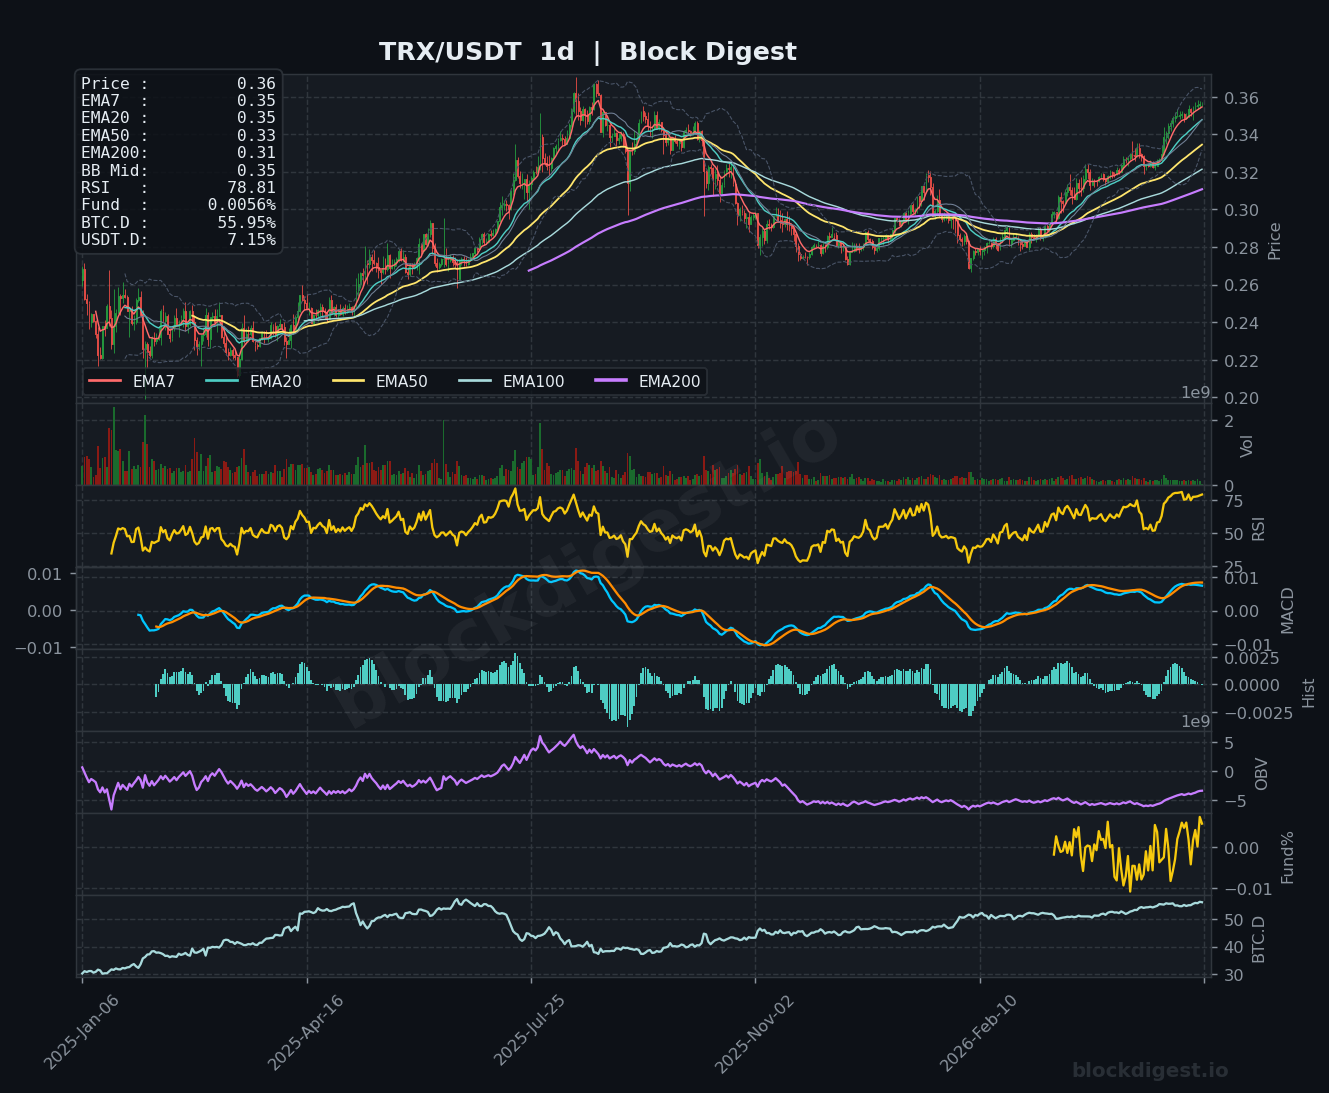
TRON emerges as a relative strength leader, trading at $0.36 with price above all key moving averages and maintaining a clear uptrend structure. The 1-hour chart shows RSI at 59.30 with price consolidating near highs around $0.355-$0.360, while the 4-hour timeframe displays RSI at 57.53, indicating healthy bullish momentum without overbought extremes. Most notably, the daily chart reveals TRX with RSI at 78.81, deeply overbought but maintaining strength above the rising 200-day EMA at $0.31. The MACD remains in strong positive territory across all timeframes with bullish crossovers intact. Near-term resistance sits at $0.365, with support at $0.350-$0.355 likely to hold on minor pullbacks.
Altcoin Outlook
The altcoin landscape presents a bifurcated picture, with most major tokens showing continued weakness while selective assets like TRX demonstrate independent strength. Momentum indicators suggest several coins (XRP, DOGE, LTC) are approaching oversold extremes, potentially setting up tactical bounce opportunities, though broader structure remains bearish without reclaiming key moving averages. TRX stands out with the strongest technical setup, maintaining uptrend integrity and positive momentum, though overbought conditions warrant caution on new entries. Market participants should monitor Bitcoin’s direction and USDT dominance—a decline in USDT.D below 7% alongside BTC stability could catalyze broader altcoin recovery, particularly for oversold large-caps.
Disclaimer: This analysis is for informational purposes only and does not constitute financial advice. Cryptocurrency markets are highly volatile and unpredictable. All trading decisions should be made based on your own research and risk tolerance. Block Digest is not responsible for any financial losses incurred as a result of acting on this content.
Stay Ahead of the Market
Follow BlockDigest for crypto market intelligence, research and real-time updates.


