BTC Daily Analysis — May 05, 2026
BTC Daily Analysis – May 05, 2026
Market Overview
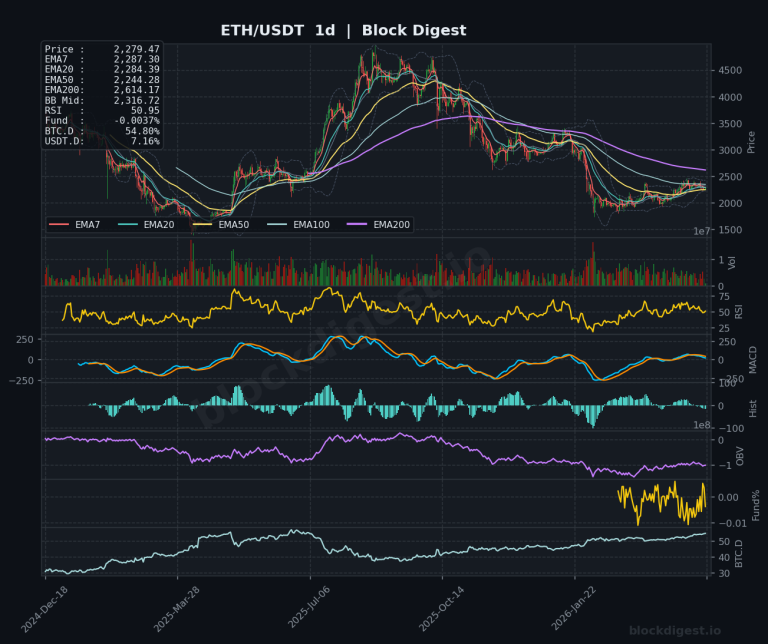
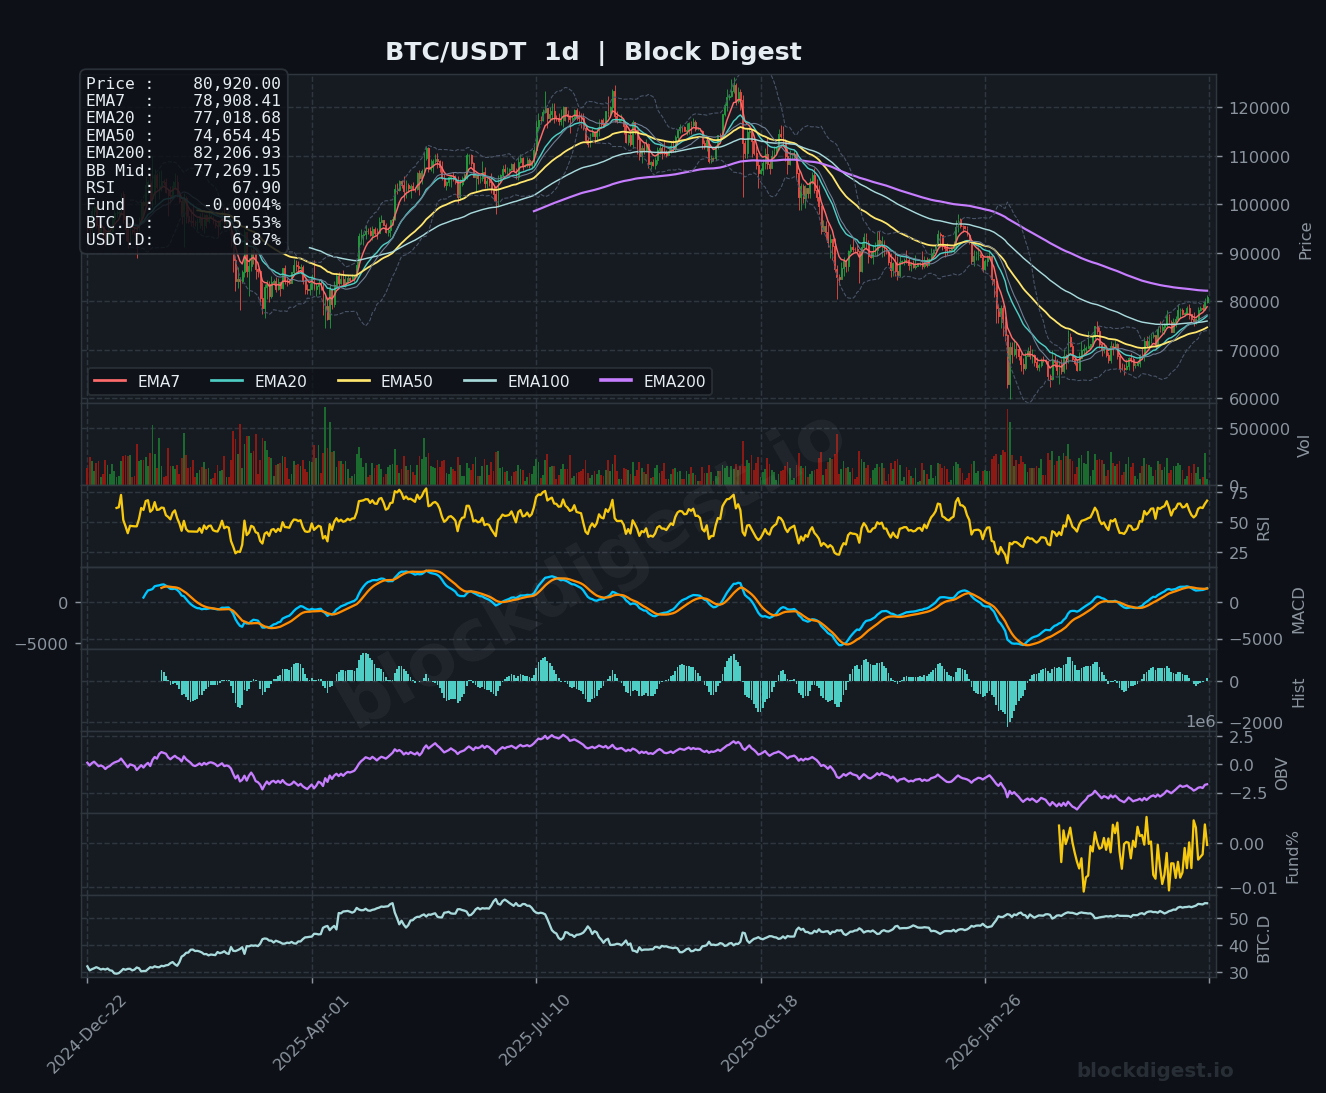
Bitcoin is trading at $80,920, exhibiting strong bullish momentum across all timeframes with price positioned above all major EMAs. On the daily chart, BTC has successfully reclaimed the EMA50 ($74,654) and is now testing the EMA20 ($77,018) as support, while trading near the upper Bollinger Band at $77,269. The price structure shows a clear recovery from the previous downtrend, with shorter-term EMAs (7 and 20) now crossing above longer-term averages. The current positioning suggests BTC is in a short-term uptrend within a broader recovery phase, though proximity to the EMA200 ($82,206) presents immediate overhead resistance.
Multi-Timeframe Confluence
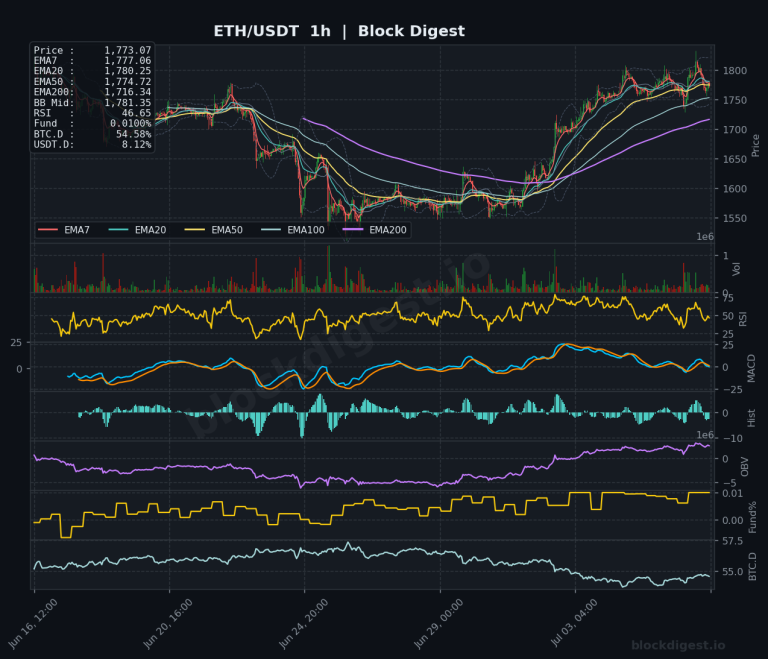
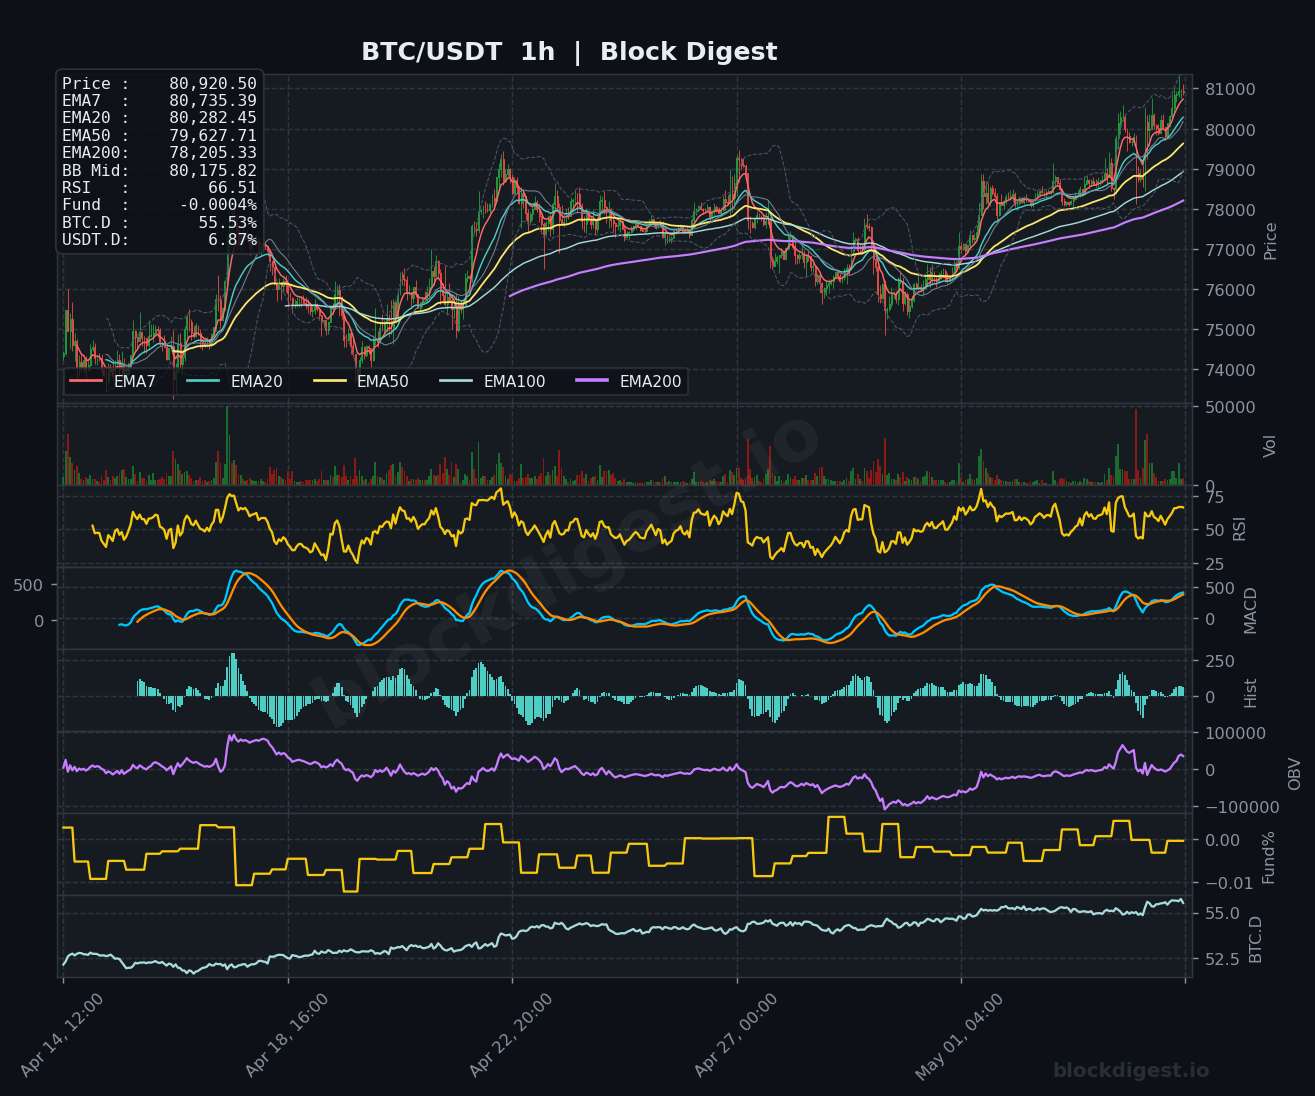
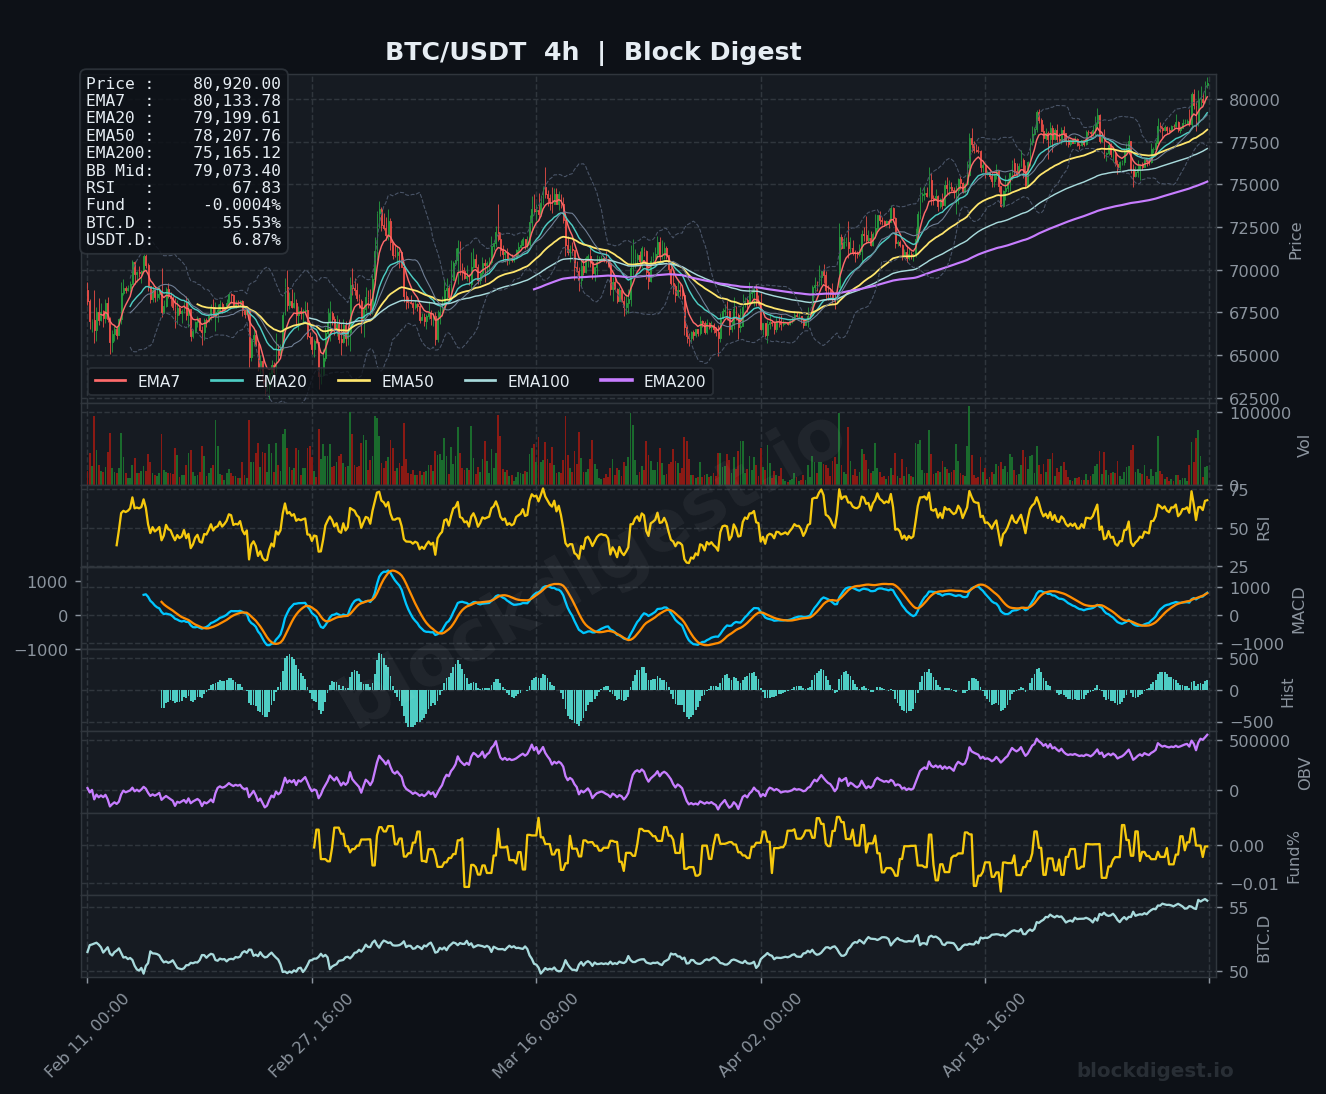
All three timeframes display bullish alignment, with price above ascending EMAs creating a supportive structure. The 1-hour chart shows price at $80,920 comfortably above EMA7 ($80,735), while the 4-hour timeframe confirms this with price at EMA7 ($80,133), both indicating sustained short-term momentum. However, the daily chart reveals that while the short-term trend is bullish, price remains below the EMA200 at $82,206, creating a critical resistance zone. The confluence of support appears strongest around $79,000-$79,500 where the 4-hour EMA20 ($79,199) and daily EMA7 ($78,908) cluster together.
Key Levels to Watch
Resistance:
- $82,200 – Daily EMA200, representing the most significant overhead resistance and a key level that would confirm trend reversal if decisively broken
- $81,000 – Psychological round number and recent swing high area, coinciding with upper Bollinger Band expansion on lower timeframes
- $80,700-$80,900 – Current price zone and 1-hour Bollinger Band mid-point, short-term consolidation ceiling
Support:
- $79,000-$79,500 – Critical support cluster featuring 4-hour EMA20 ($79,199), 4-hour EMA50 ($78,207), and daily EMA7 ($78,908)
- $77,000-$78,000 – Daily EMA20 ($77,018) and Bollinger Band mid-point ($77,269), representing the bull/bear pivot zone
- $74,600 – Daily EMA50, major structural support that marks the boundary between recovery and renewed downtrend
Momentum & On-Chain Signals
RSI readings show elevated but not overextended momentum: 66.51 on the 1-hour, 67.83 on the 4-hour, and 67.90 on the daily timeframe. These levels indicate bullish momentum with room for continuation before entering overbought territory above 70. The MACD across all timeframes shows bullish configuration with positive histogram readings and lines trending upward, though the daily MACD is approaching a potential resistance level where momentum could stall. OBV displays a consistent upward trajectory on the 1-hour and 4-hour charts, confirming accumulation and genuine buying pressure behind the rally. The funding rate at -0.0004% is slightly negative, suggesting shorts are paying longs marginally—an unusual condition during an uptrend that could indicate skepticism or potential short-squeeze fuel.
BTC Dominance & Market Sentiment
BTC.D stands at 55.53%, indicating Bitcoin’s strengthening position relative to altcoins, which typically signals risk-off behavior within crypto markets or the early stages of a Bitcoin-led rally. USDT.D at 6.87% shows relatively neutral stablecoin positioning, neither extremely high (panic) nor extremely low (euphoria). This combination suggests capital is rotating into Bitcoin specifically rather than flowing broadly across crypto or exiting to stablecoins, supporting the thesis that this is a BTC-centric move that may precede broader market participation if the rally continues.
Risk Scenarios
Bullish case: A decisive 4-hour close above $82,200 (daily EMA200) with accompanying volume expansion would confirm trend reversal and likely trigger momentum toward $85,000 and potentially $88,000-$90,000 psychological levels. Continued positive OBV divergence and RSI holding above 60 on pullbacks would validate this scenario.
Bearish case: Failure to break $82,200 followed by a breakdown below the $79,000 support cluster would negate the bullish structure and likely trigger cascading stops toward $77,000 and potentially $74,600. A daily close below EMA7 ($78,908) with increasing volume would be the first warning signal.
Outlook
Bitcoin maintains a constructive short-term outlook with bullish momentum intact across all timeframes, though the proximity to daily EMA200 at $82,200 creates a critical inflection point. The next 24-48 hours will be decisive as price tests this resistance—either breaking through to confirm trend reversal or rejecting to consolidate recent gains. Key triggers to monitor include the $82,200 level (breakout catalyst), the $79,000-$79,500 support zone (breakdown warning), and funding rate behavior (potential short-squeeze dynamics). A sustained move above $82,200 would shift the technical picture decisively bullish, while rejection could trigger healthy consolidation or deeper retracement. Overall, the risk/reward favors cautious bullish positioning with tight risk management around the $79,000 level.
Disclaimer: This analysis is for informational purposes only and does not constitute financial advice. Cryptocurrency markets are highly volatile and unpredictable. All trading decisions should be made based on your own research and risk tolerance. Block Digest is not responsible for any financial losses incurred as a result of acting on this content.