Bitcoin Daily Analysis: Bitcoin Falls Below $61.7K as EMA Stack Confirms Bearish Pressure
Market Overview
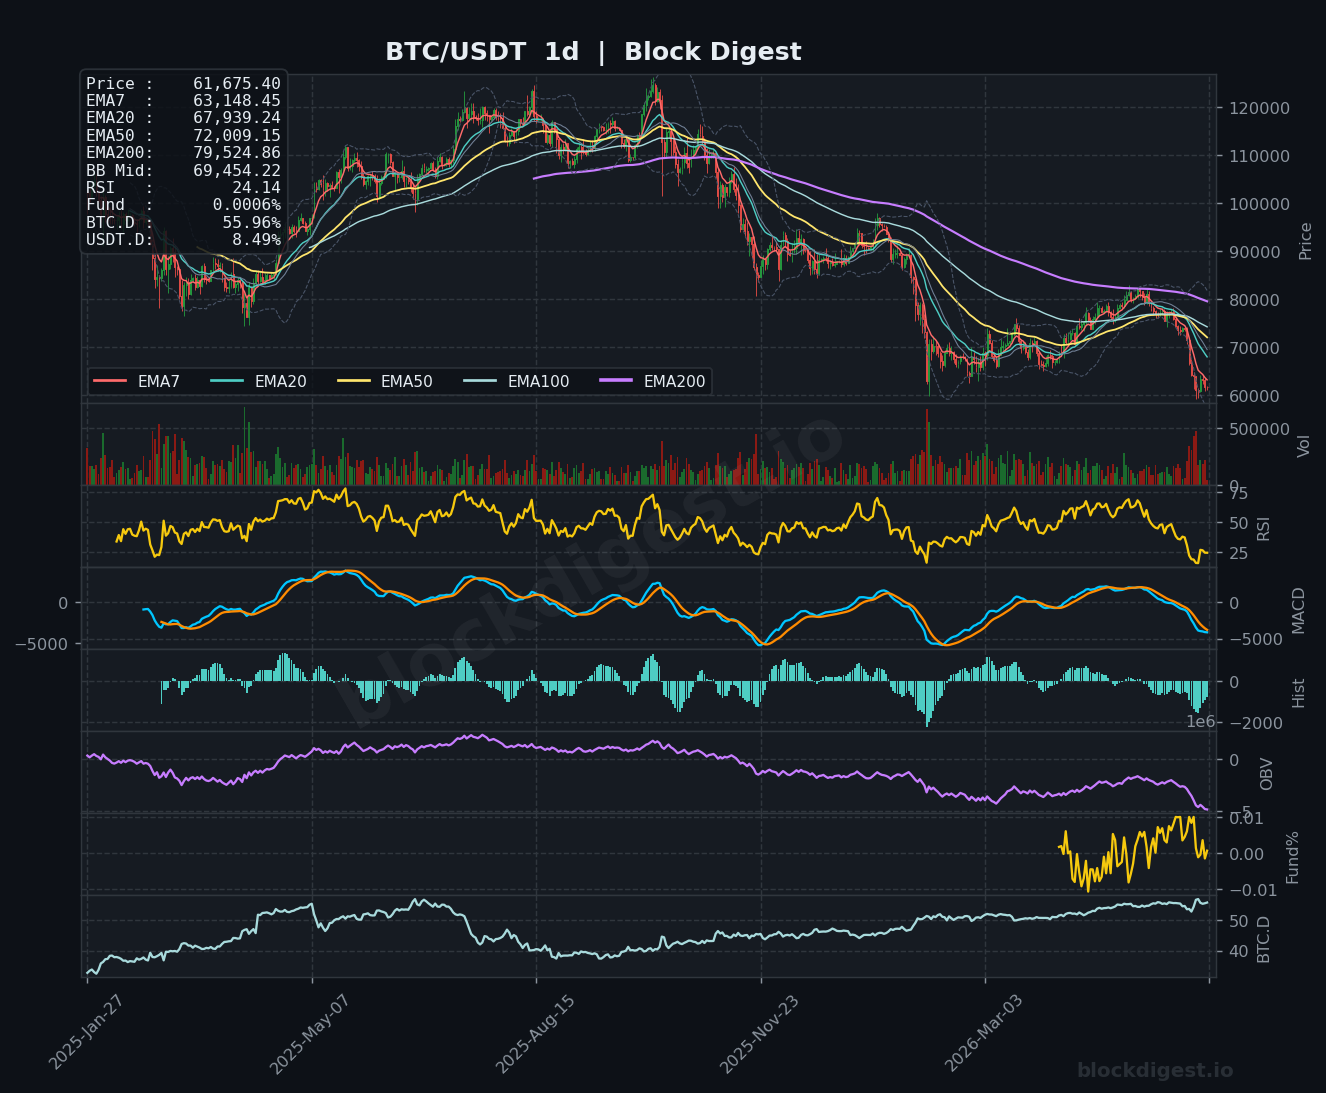
Bitcoin is trading at $61,675 as of June 10, 2026, sitting in deeply bearish territory across all major timeframes. On the daily chart, price has collapsed well below all key exponential moving averages — the EMA7 at $63,148, EMA20 at $67,939, EMA50 at $72,009, and EMA200 at $79,525 — forming a textbook bearish EMA stack with every average acting as overhead resistance. The daily Bollinger Band midline sits at $69,454, also well above current price, confirming that BTC is trading in the lower half of its longer-term range. Price recently tested the psychologically significant $60,000 zone and is attempting a modest consolidation, but the dominant daily trend remains firmly downward with no confirmed structural reversal yet in sight.
Multi-Timeframe Confluence
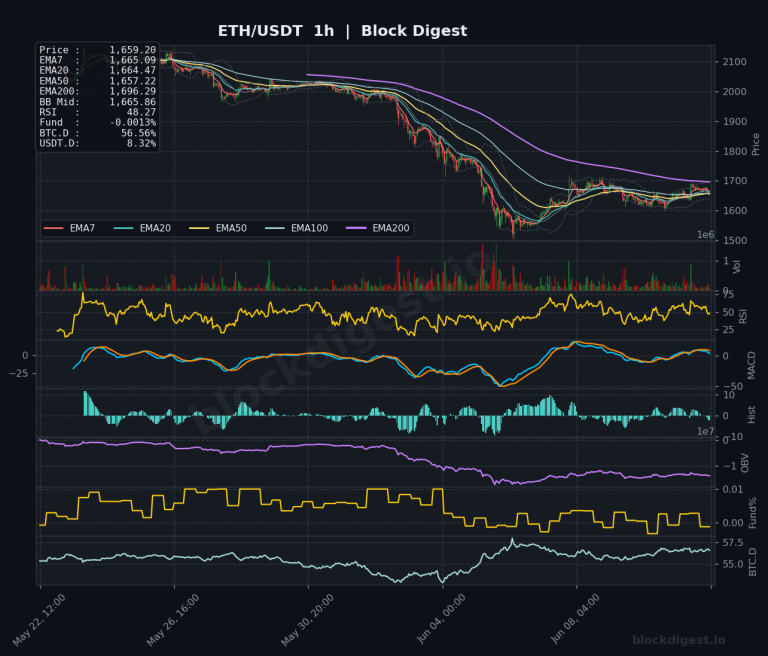
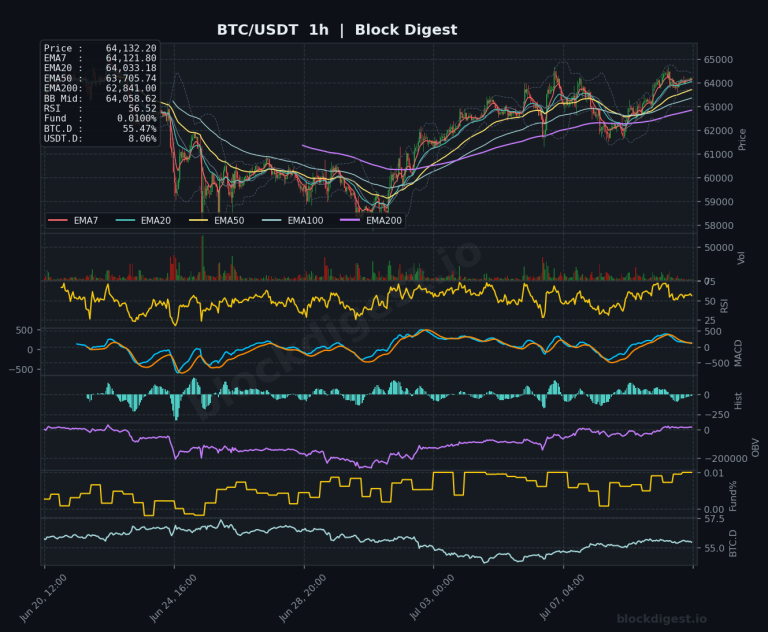
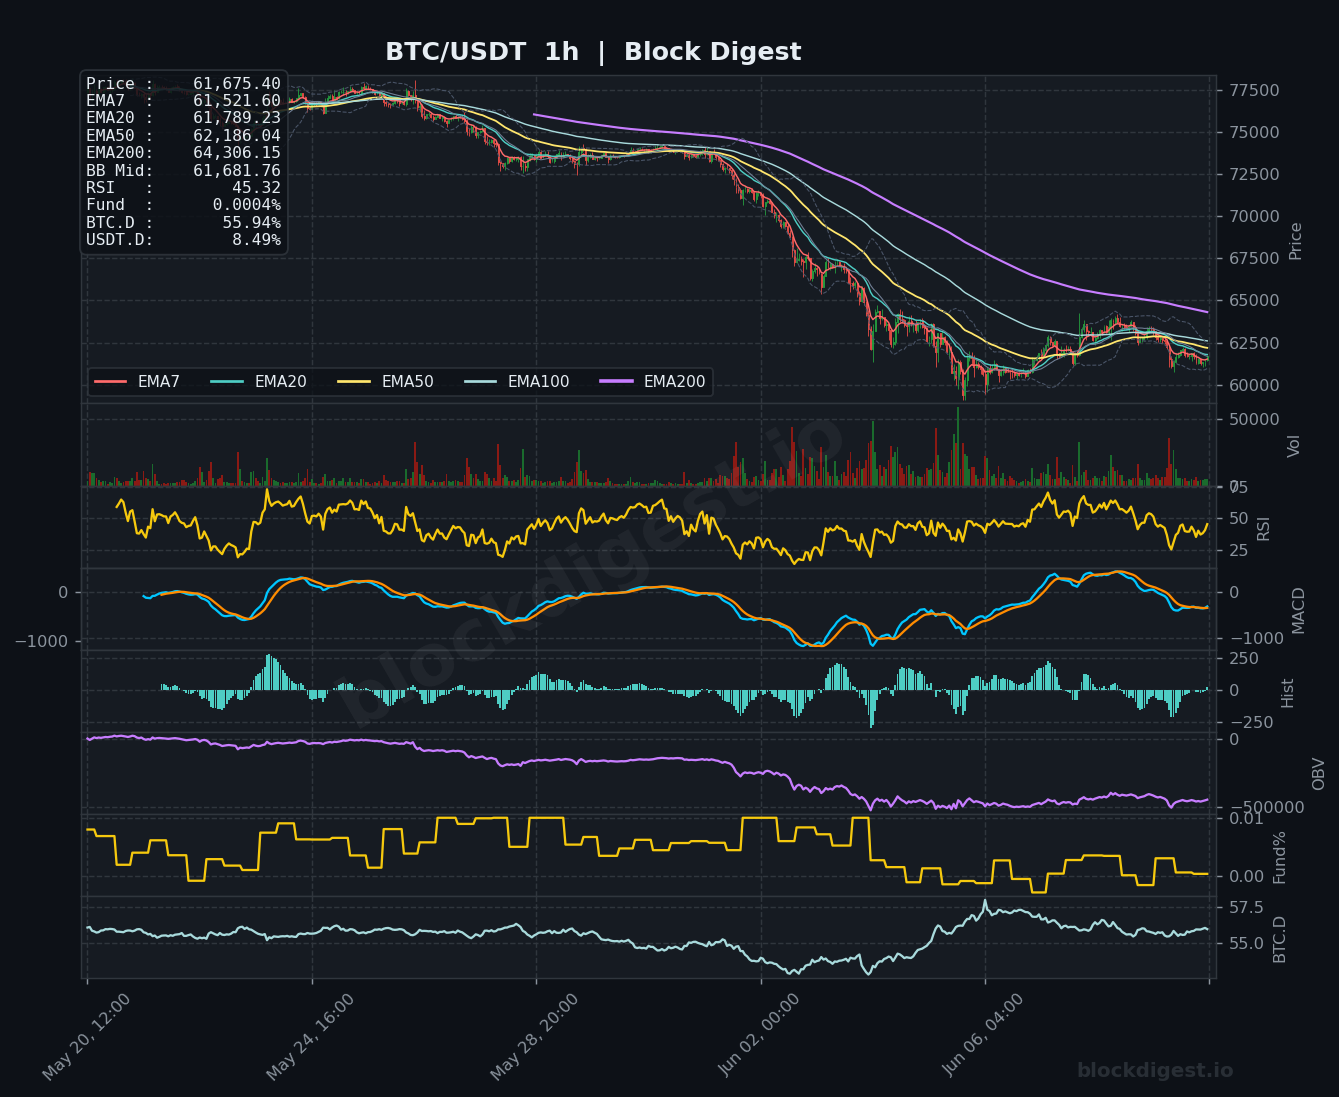
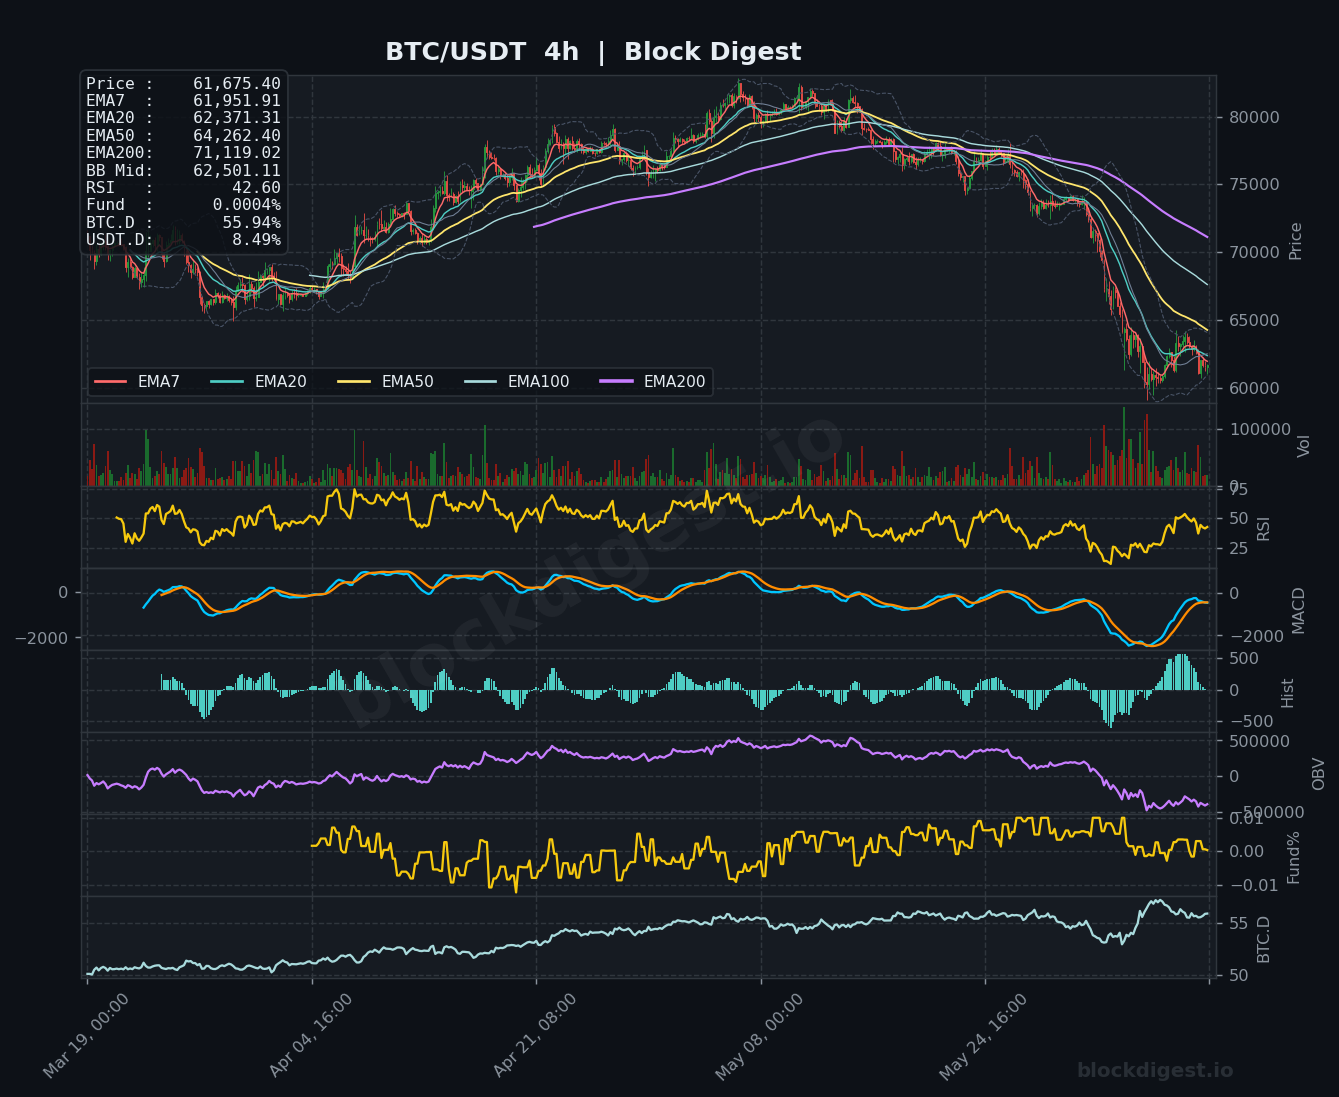
Across all three timeframes, the bearish structure is strikingly consistent, leaving little room for conflicting signals. On the 4-hour chart, price is trading below all EMAs — with the EMA50 at $64,262 and EMA200 at $71,119 both sloping aggressively downward — confirming the intermediate trend remains in distribution. The 1-hour chart shows a similarly bearish EMA alignment, with the EMA200 at $64,306 acting as a dynamic ceiling, although there are faint signs of short-term stabilization near the $61,500–$62,000 range. The one mildly constructive note is that on the 1-hour chart, the shorter EMAs (EMA7 at $61,522 and EMA20 at $61,789) are beginning to converge with price, potentially signaling a very early attempt at basing behavior — though this has not yet translated into higher timeframe confirmation.
Key Levels to Watch
- Resistance: $63,150 — Daily EMA7, the first dynamic overhead hurdle that bulls must reclaim to signal any near-term stabilization
- Resistance: $64,260–$64,306 — Confluence of the 4h EMA50 and 1h EMA200, representing a significant supply zone where sellers have repeatedly reasserted control
- Resistance: $67,939 — Daily EMA20, a critical medium-term recovery target; reclaiming this level would meaningfully shift the intermediate structure
- Support: $61,000–$61,500 — Immediate intraday support zone currently being tested, with the BB lower band nearby on the 1-hour chart
- Support: $60,000 — Major psychological and technical floor; a decisive close below this level would likely accelerate selling and open the door toward the mid-$50,000s
- Support: $56,000–$58,000 — Next meaningful structural demand region based on prior consolidation; aligns with analyst targets cited in current macro commentary
Momentum & On-Chain Signals
The daily RSI reading of 24.14 is firmly in oversold territory — a level not reached during the prior 2025 correction — which is notable and warrants close attention for potential capitulation signals or mean-reversion bounces, though oversold conditions can persist in sustained downtrends. The 4-hour RSI at 42.60 and 1-hour RSI at 45.32 are both below the 50 midline, confirming bearish momentum on shorter timeframes without yet reaching extreme oversold levels that would typically trigger aggressive dip-buying. The MACD on the daily is deeply negative with both lines trending below zero and the histogram printing sustained red bars, confirming macro-level bearish momentum with no crossover signal visible. The OBV across all timeframes — particularly the daily — is declining sharply, pointing to consistent net distribution and a lack of meaningful accumulation despite the recent price bounce attempt.
BTC Dominance & Market Sentiment
BTC dominance is currently at 55.94%–55.96%, having risen sharply in recent weeks from levels near 50%, which typically signals capital rotation out of altcoins and into Bitcoin as a relative safe haven within crypto — a classic risk-off dynamic within the digital asset space. USDT dominance at 8.49% is elevated and trending higher, reinforcing the picture of broad market participants moving toward stablecoins and reducing overall crypto exposure. Together, these readings suggest the wider altcoin market is under even greater pressure than BTC itself, and that conditions are not yet favorable for a sustained broad market recovery.
Risk Scenarios
- Bullish case: A decisive reclaim and close above $63,150 (daily EMA7) on elevated volume, accompanied by an RSI recovery above 30 on the daily, would suggest a short-term relief rally is underway, with a potential move toward the $67,000–$68,000 zone where the EMA20 and prior structure converge.
- Bearish case: A confirmed daily close below $60,000 would invalidate the current consolidation attempt and open downside risk toward the $56,000–$58,000 support cluster, with analyst consensus suggesting a further flush toward $56,000 if macro conditions deteriorate further amid geopolitical tensions and continued ETF outflows.
Outlook
The overall bias for BTC heading into the next 24–48 hours remains cautiously bearish, with the daily RSI at deeply oversold levels providing the only near-term counterbalance to an otherwise uniformly negative technical picture. The key trigger to watch is price behavior around the $60,000 level — this is where the market’s hand will be forced, either printing a higher low that could support a relief rally, or breaking down to accelerate the broader corrective move. A sustained recovery above $64,300 (4h EMA50 / 1h EMA200 confluence) would be required to shift short-term structure from bearish to neutral. Until that occurs, any intraday bounces should be treated as potential selling opportunities in the context of a market that remains in clear macro distribution, compounded by record ETF outflows, geopolitical risk, and deteriorating macro sentiment.
Disclaimer: This analysis is for informational purposes only and does not constitute financial advice. Cryptocurrency markets are highly volatile and unpredictable. All trading decisions should be made based on your own research and risk tolerance. Block Digest is not responsible for any financial losses incurred as a result of acting on this content.