Bitcoin Daily Analysis: BTC Below All Daily EMAs at $73,507
Market Overview
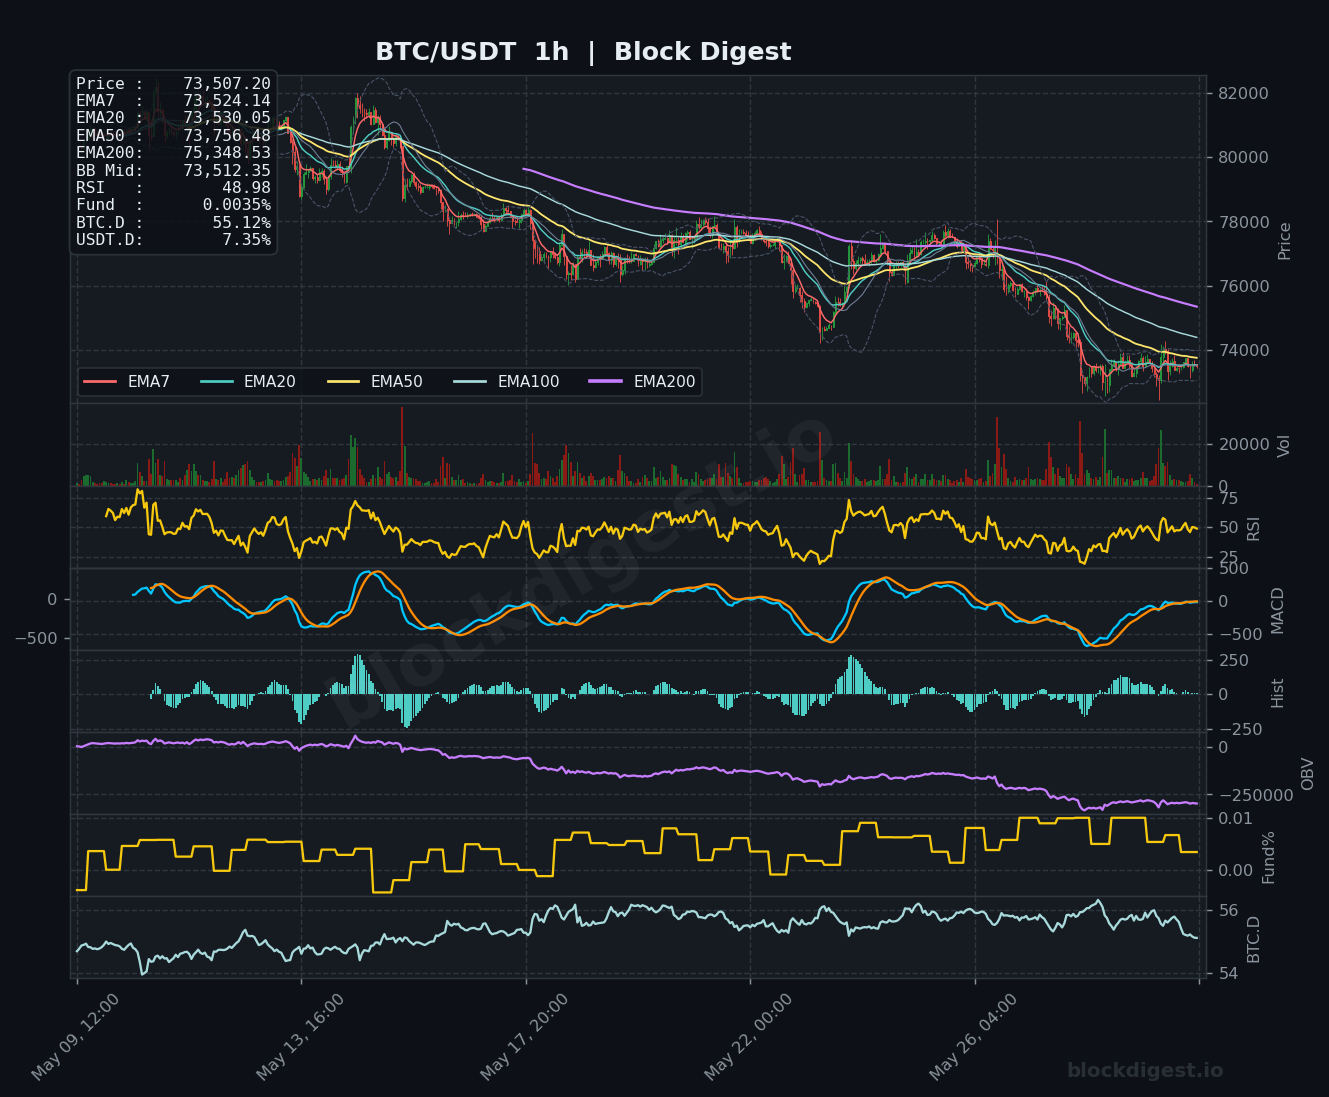
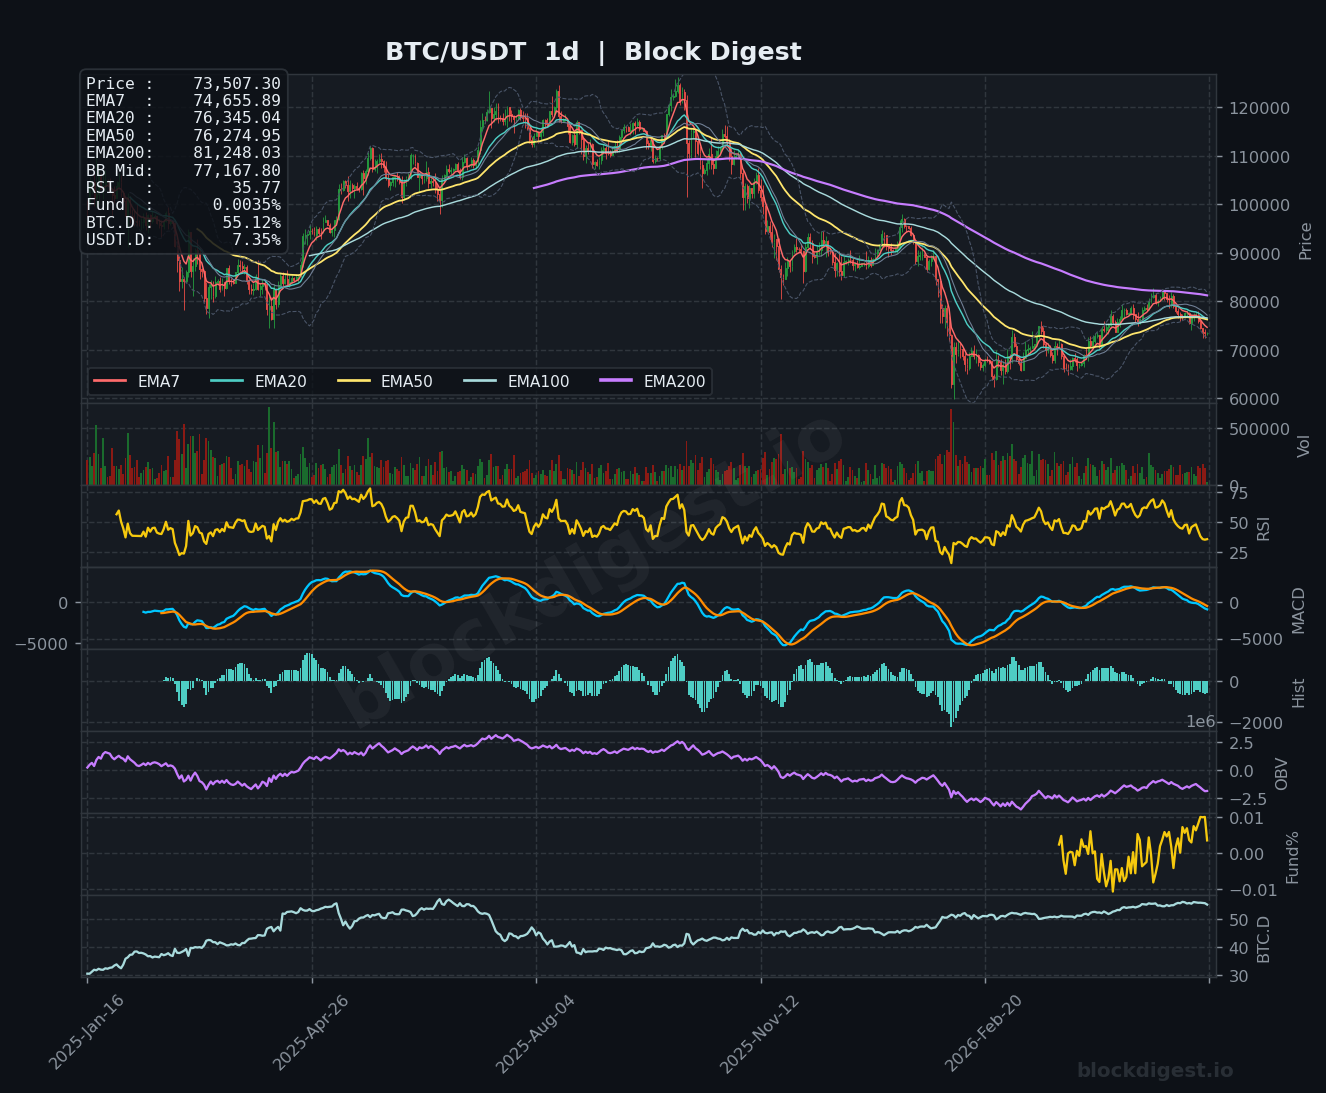
BTC/USDT is currently trading at $73,507, sitting below all major daily EMAs — EMA7 ($74,655), EMA20 ($76,345), EMA50 ($76,274), and the EMA200 ($81,248) — painting a clearly bearish structural picture on the daily timeframe. Price has been in a sustained downtrend since the October 2025 all-time high of $126,272, shedding roughly 42% of its value over that period. The daily Bollinger Band midline sits at $77,167, well above current price, confirming that BTC remains in the lower half of its Bollinger range and under consistent distribution pressure. The dominant daily trend is unambiguously bearish, with the EMA stack in full bearish alignment and no near-term signs of structural reversal.
Multi-Timeframe Confluence
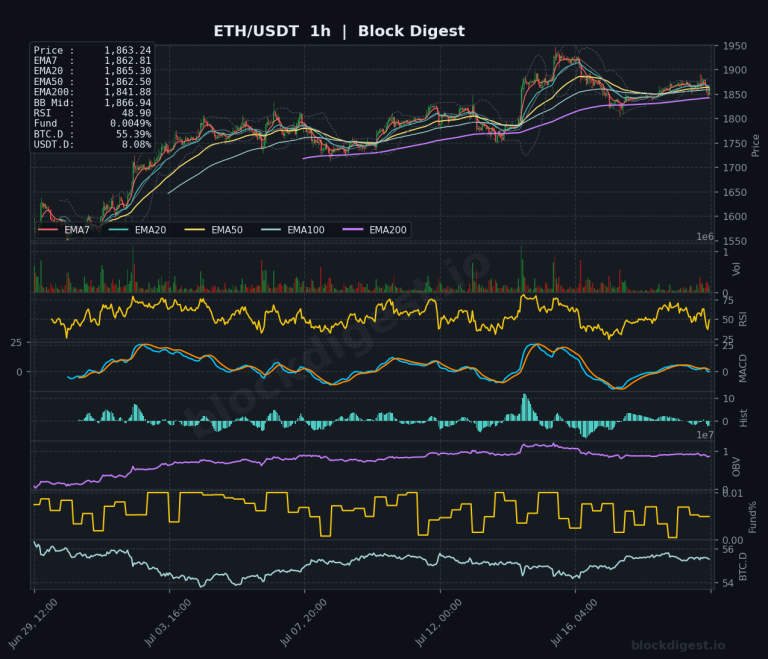
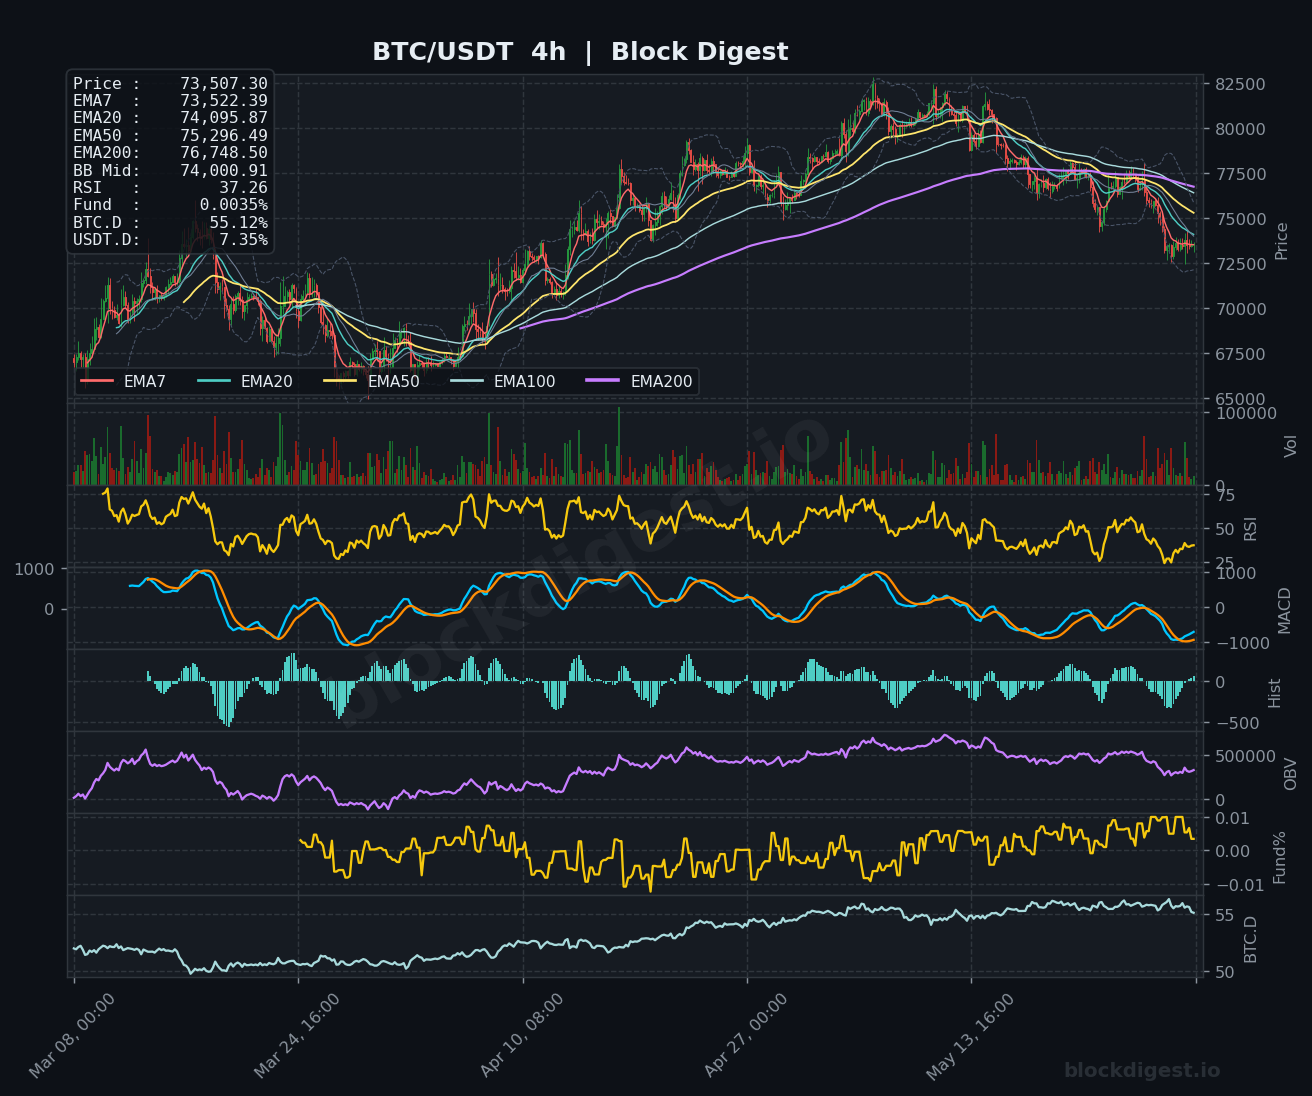
Across all three timeframes, the bearish thesis is consistent and reinforcing. On the 1-hour chart, price is compressed just below EMA7 ($73,524), EMA20 ($73,530), and EMA50 ($73,756), all of which have converged into a tight cluster acting as immediate overhead resistance. The 4-hour chart shows price has broken decisively below the EMA200 ($76,748), with the EMA7 ($73,522) and EMA20 ($74,095) both sloping sharply downward. There is no meaningful divergence between timeframes — short-term momentum is confirming, not contradicting, the higher timeframe trend. The only marginal note is that on the 1-hour chart, price is fractionally above the EMA200 ($75,348), suggesting the very short-term may attempt a local consolidation, but this is insufficient to alter the broader bias.
Key Levels to Watch
- Resistance: $73,756 — 1-hour EMA50, where the entire short-term EMA cluster converges and has repeatedly capped intraday bounces
- Resistance: $74,095–$74,655 — 4-hour EMA20 and daily EMA7 zone, representing the first meaningful overhead supply region that any recovery attempt must clear
- Resistance: $76,274–$76,345 — Confluence of the daily EMA50 and EMA20, a critical structural ceiling; reclaiming this zone would be a meaningful shift
- Support: $72,500–$73,000 — Recent local lows and the lower boundary of the current consolidation range visible on the 1-hour chart
- Support: $70,000 — Psychological round-number support and a historically significant level; a breach here would likely accelerate selling
- Support: $67,000–$68,000 — Prior structure support from earlier in the macro cycle; the next meaningful demand zone if $70K gives way
Momentum & On-Chain Signals
The RSI readings across timeframes present a consistently oversold-to-weak picture: the daily RSI sits at 35.77, approaching oversold territory but not yet at extreme levels that historically trigger strong reversals; the 4-hour RSI is more concerning at 37.26, while the 1-hour RSI at 48.98 suggests a minor intraday stabilization. The daily MACD remains in negative territory with both lines below zero and the histogram printing shallow negative bars, indicating sustained bearish momentum with no confirmed crossover in sight. On the 4-hour, MACD lines are deeply negative and converging slowly, which warrants monitoring for a potential relief signal but is not yet actionable. OBV on both the daily and 4-hour charts continues to trend downward, confirming that volume is flowing out of BTC and that distribution, not accumulation, remains the dominant on-chain flow. The funding rate at 0.0035% is near neutral, suggesting the market is not significantly overleveraged to the downside — which removes some short-squeeze fuel but also means there is no extreme positioning washout yet.
BTC Dominance & Market Sentiment
BTC dominance currently stands at 55.12%, a relatively elevated level that suggests capital has been rotating into Bitcoin rather than altcoins — a typical defensive behavior in risk-off crypto environments. USDT dominance at 7.35% reflects a notable degree of capital sitting on the sidelines in stablecoins, consistent with the extreme fear sentiment that has characterized much of 2026. Together, these readings suggest the broader market remains in a defensive posture, and a sustained BTC recovery would likely be needed before meaningful altcoin risk appetite returns.
Risk Scenarios
- Bullish case: A decisive hourly close above the $73,756–$74,095 EMA cluster, confirmed by RSI crossing back above 50 on the 4-hour and a positive MACD histogram crossover, could initiate a relief rally targeting the $76,274–$76,345 daily EMA50/EMA20 zone.
- Bearish case: A sustained breakdown below $72,500 on elevated volume, particularly if accompanied by a daily RSI drop below 30 and further OBV deterioration, would open the path toward the $70,000 psychological support and potentially the $67,000–$68,000 structural level.
Outlook
The directional bias as of May 30, 2026 remains bearish, with BTC trapped beneath a heavy overhead EMA structure on all meaningful timeframes and no credible technical catalyst for reversal yet visible. The most critical trigger to watch over the next 24–48 hours is whether price can reclaim and hold the $73,756–$74,095 zone; failure to do so would likely invite another leg lower toward $72,000–$72,500. A change in the thesis would require a daily close above $76,345 (daily EMA20), which would suggest the current decline is exhausting. Until that level is reclaimed, any intraday bounce should be treated as a corrective move within a broader downtrend rather than a structural reversal.
Disclaimer: This analysis is for informational purposes only and does not constitute financial advice. Cryptocurrency markets are highly volatile and unpredictable. All trading decisions should be made based on your own research and risk tolerance. Block Digest is not responsible for any financial losses incurred as a result of acting on this content.