
Market Context
The broader altcoin market is navigating a challenging environment as Bitcoin dominance holds firm at 55.47%, continuing to compress altcoin performance and limit meaningful capital rotation. USDT.D sitting at 7.16% reflects a market that remains cautiously positioned, with investors not yet committing aggressively to risk assets — a posture that keeps most altcoins range-bound or in mild downtrends. Until BTC.D begins a decisive rollover and USDT.D retreats meaningfully below 7%, broad altcoin rallies are likely to remain shallow and short-lived.
Solana (SOL)
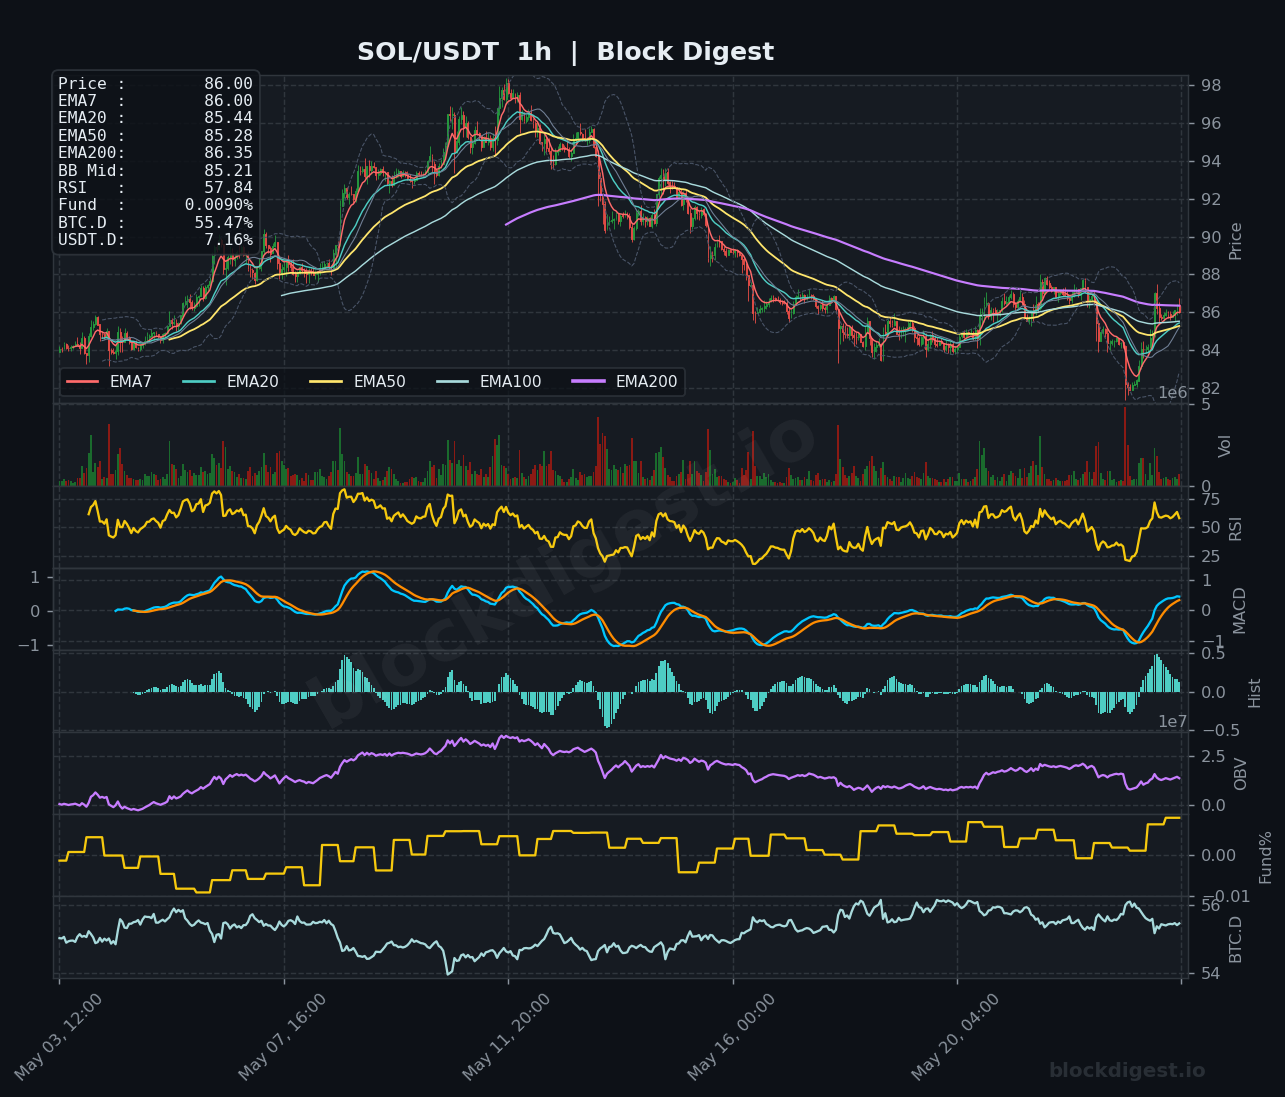
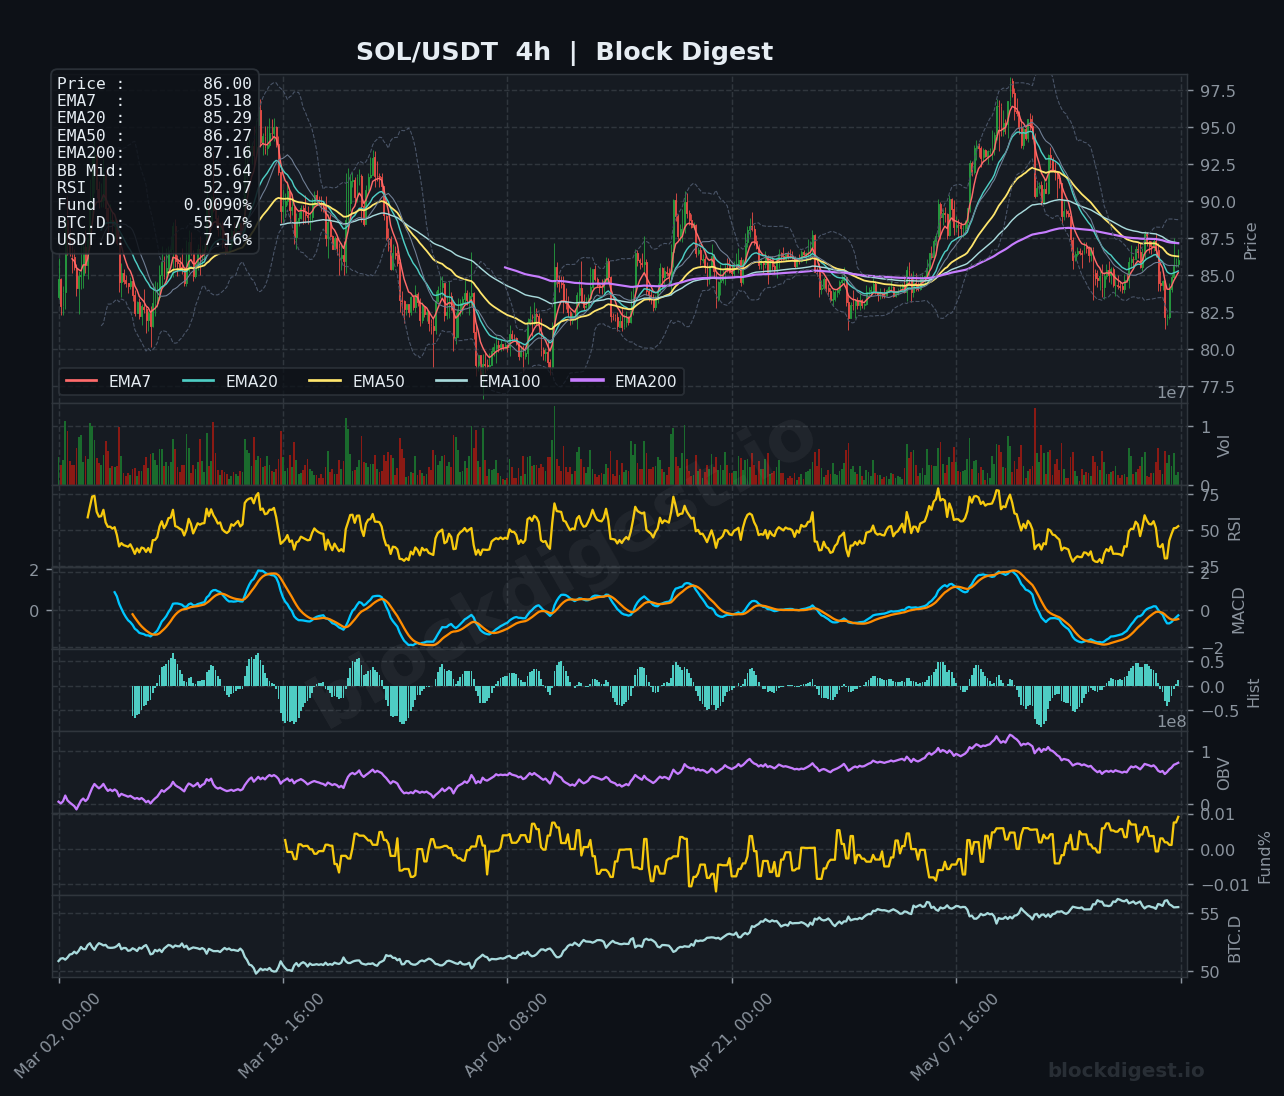
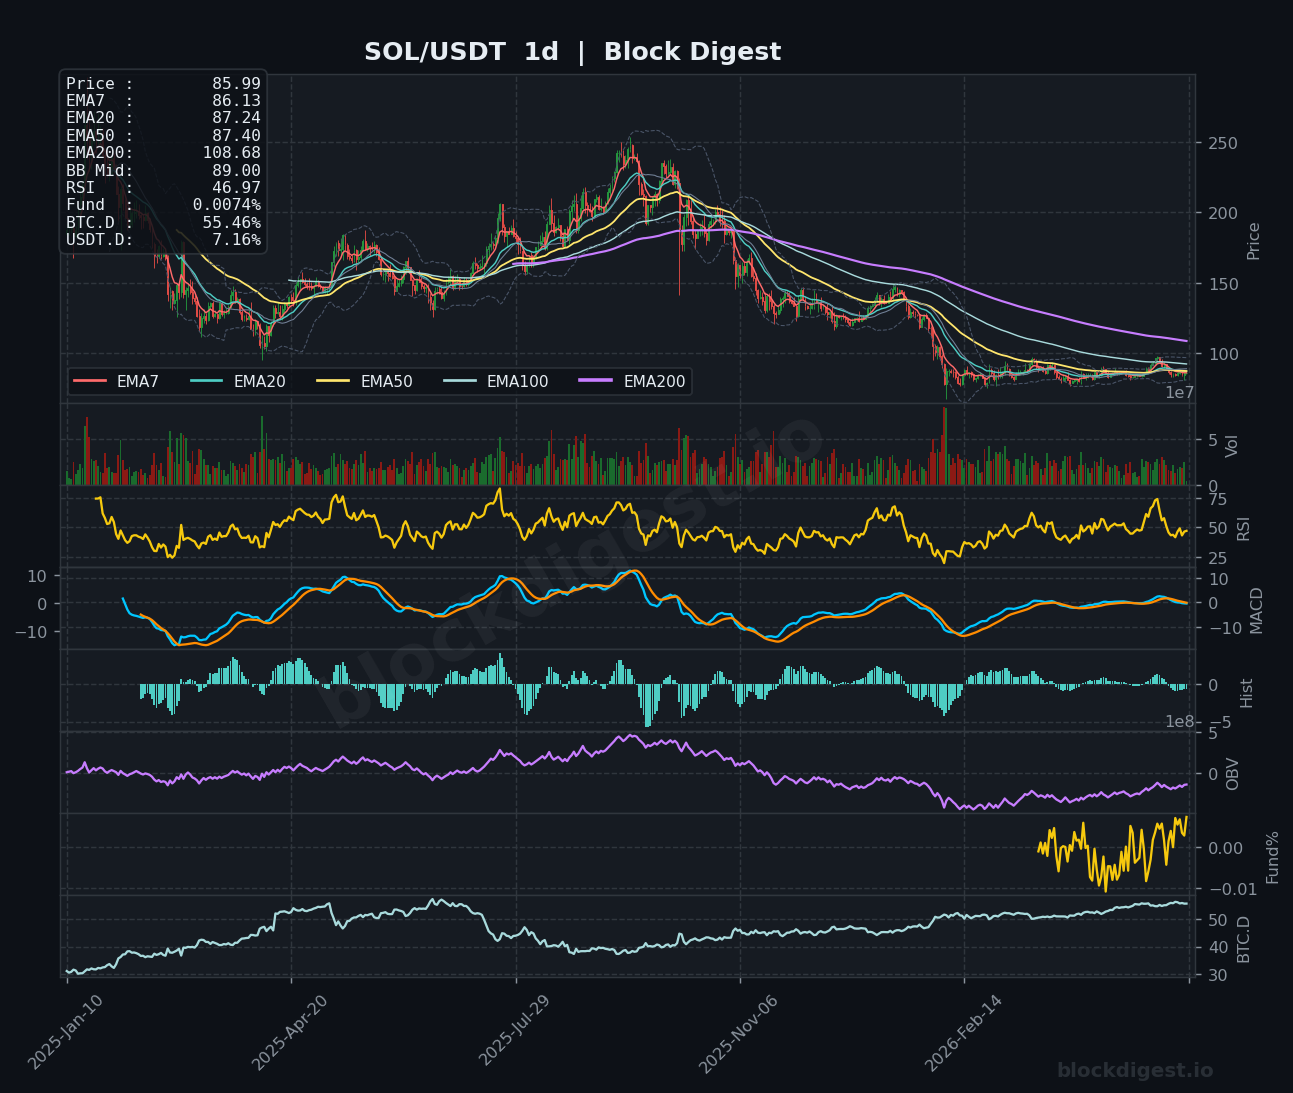
SOL is trading around $86.00, caught in a compressed range between its short-term EMAs (EMA7 at $86.00, EMA20 at $85.44, EMA50 at $85.28) while the EMA200 on the daily chart sits far above at $108.68, underscoring the depth of the macro downtrend. The 1h RSI at 57.84 shows a mild uptick in near-term momentum, and the 1h MACD is beginning to curl bullish following a sharp dip toward $82, but the 4h MACD remains in bearish territory with the signal line still below zero. On the daily chart, RSI at 46.97 and price trading below all major EMAs confirms the medium-term bias remains bearish, with resistance clustered between $87–$89 and the BB mid. A sustained reclaim of $88–$90 is required before bulls can claim any structural progress.
XRP (XRP)
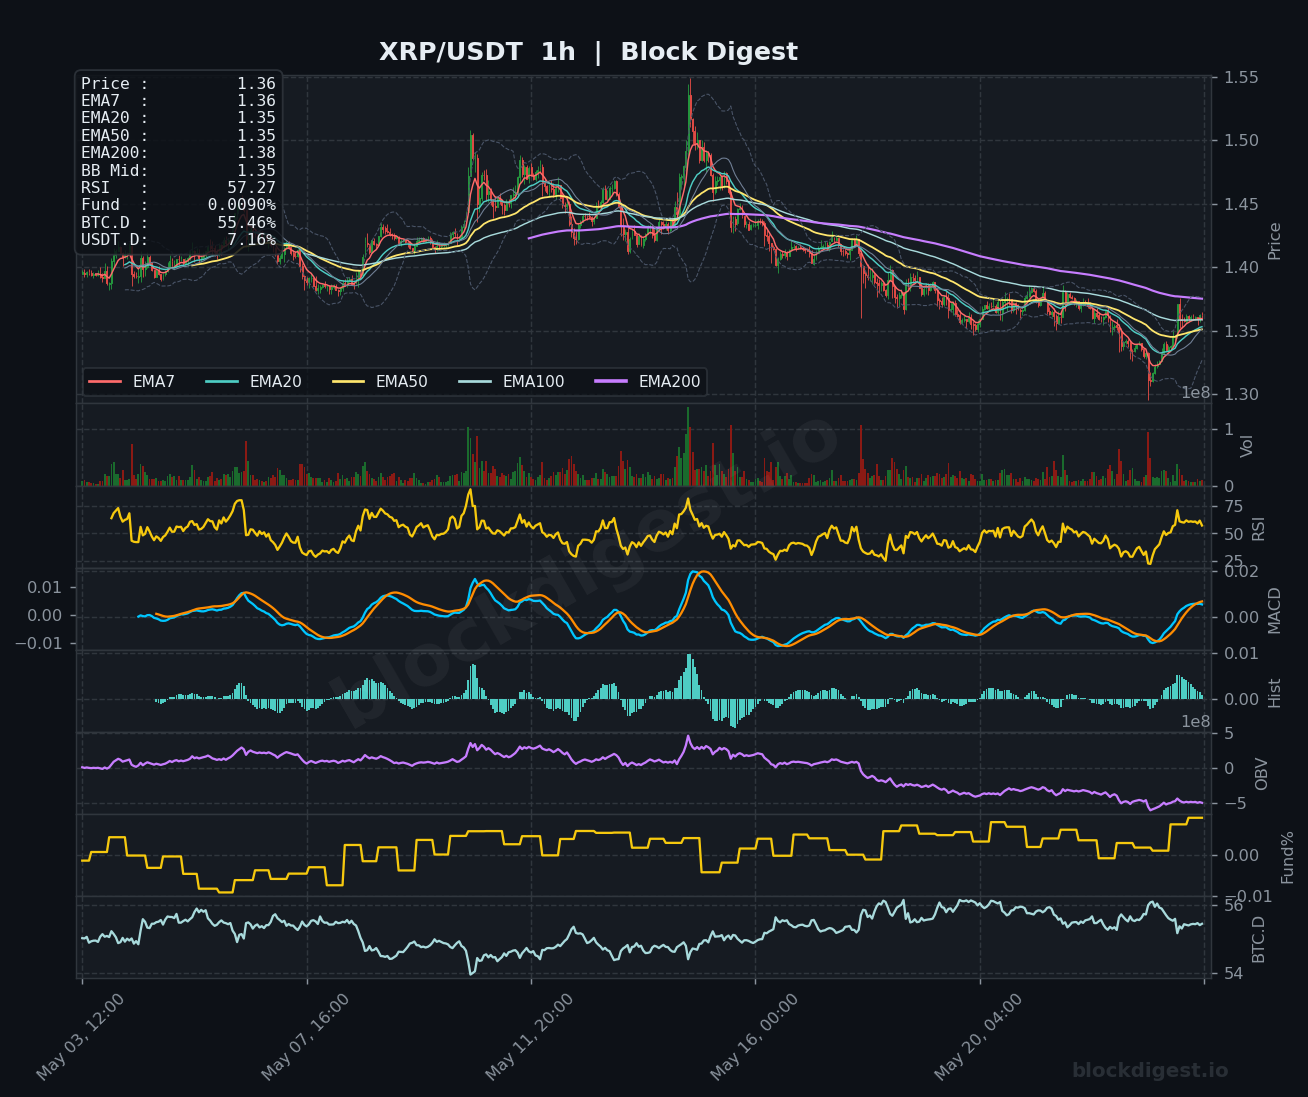
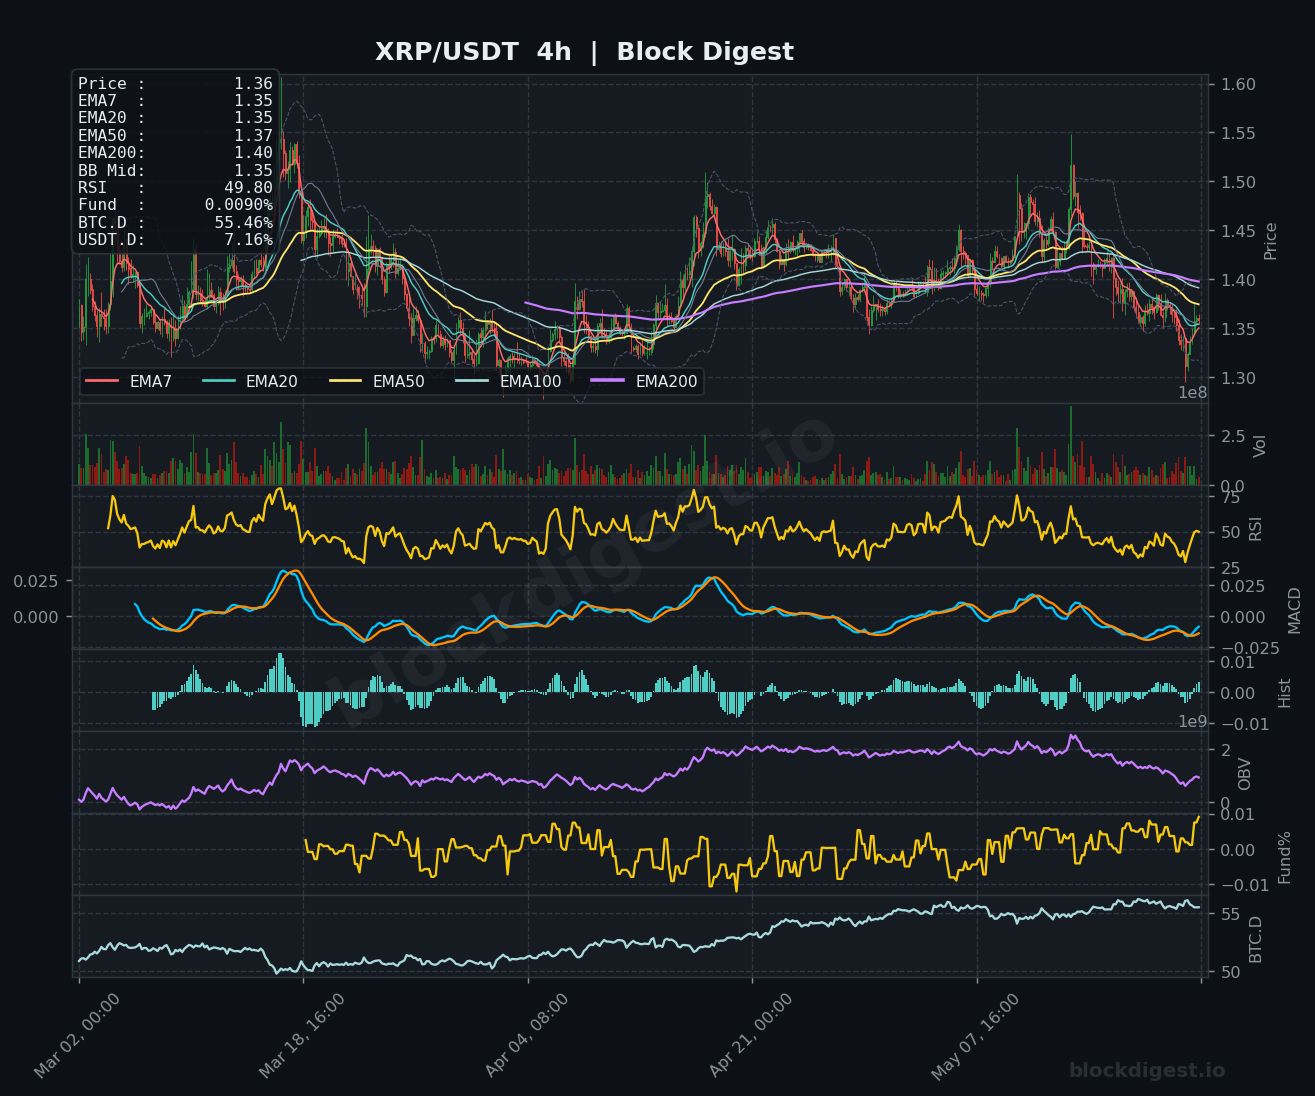
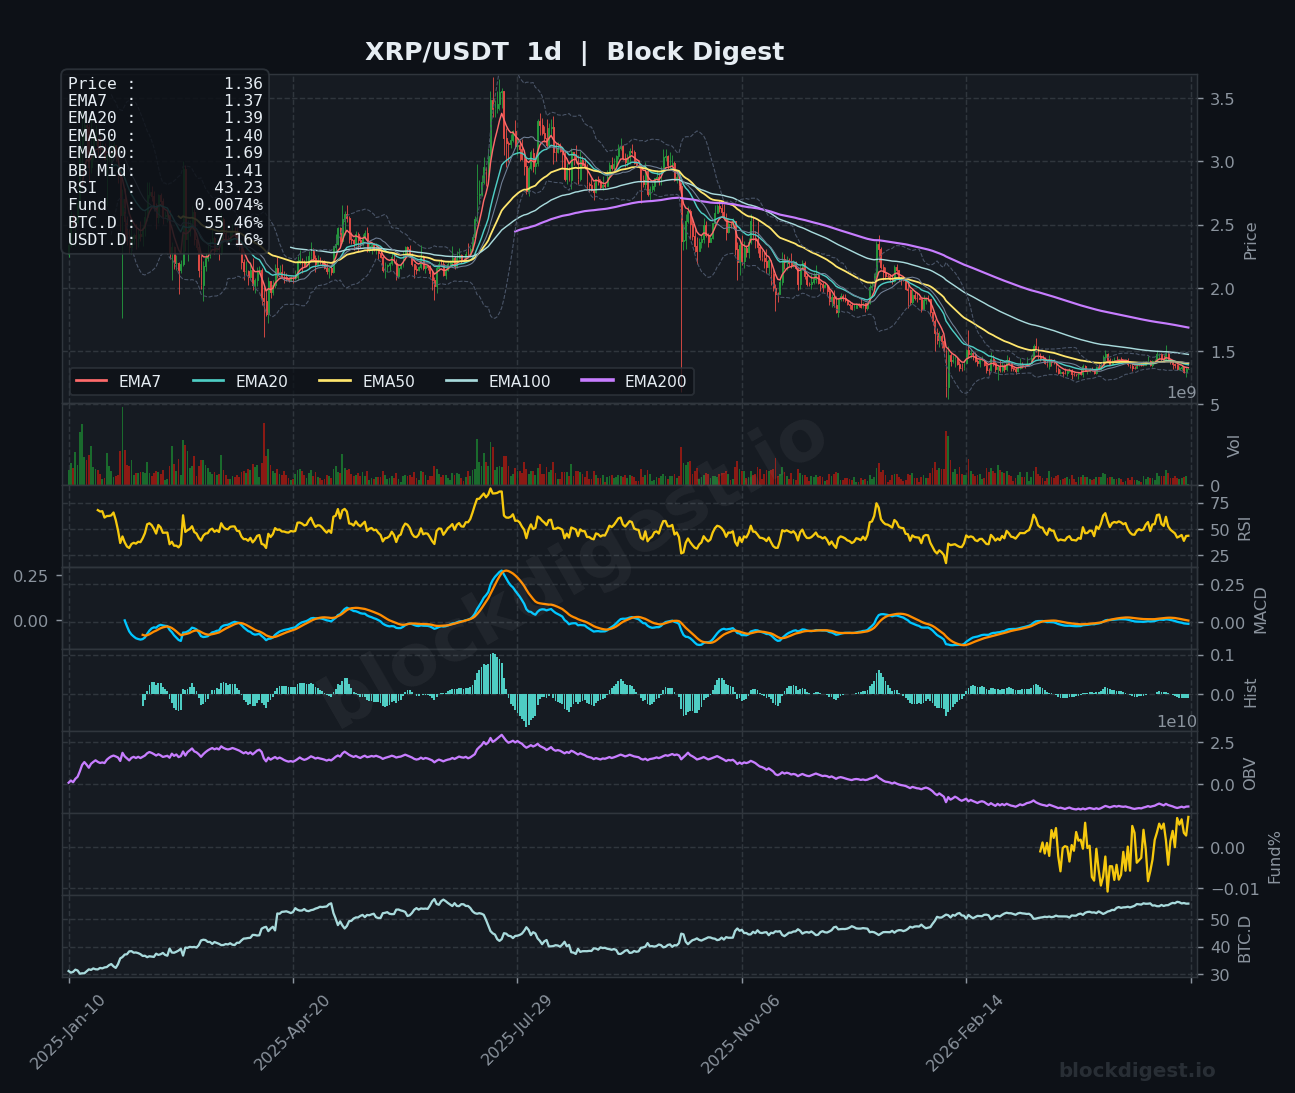
XRP is trading at $1.36, hovering just above critical near-term support as price has broken down from the $1.40–$1.50 range it previously occupied. The 1h RSI at 57.27 has bounced from oversold territory, and the MACD on the hourly is attempting a crossover, suggesting a brief relief rally may be underway from the recent $1.30 lows. However, the 4h RSI at 49.80 is neutral and the MACD there remains negative, while the daily RSI at 43.23 with price well below the EMA200 ($1.69) and EMA50 ($1.40) paints a bearish macro picture. Immediate resistance sits at $1.38–$1.40; failure to reclaim this zone on meaningful volume would leave $1.30 as the next key test.
BNB (BNB)
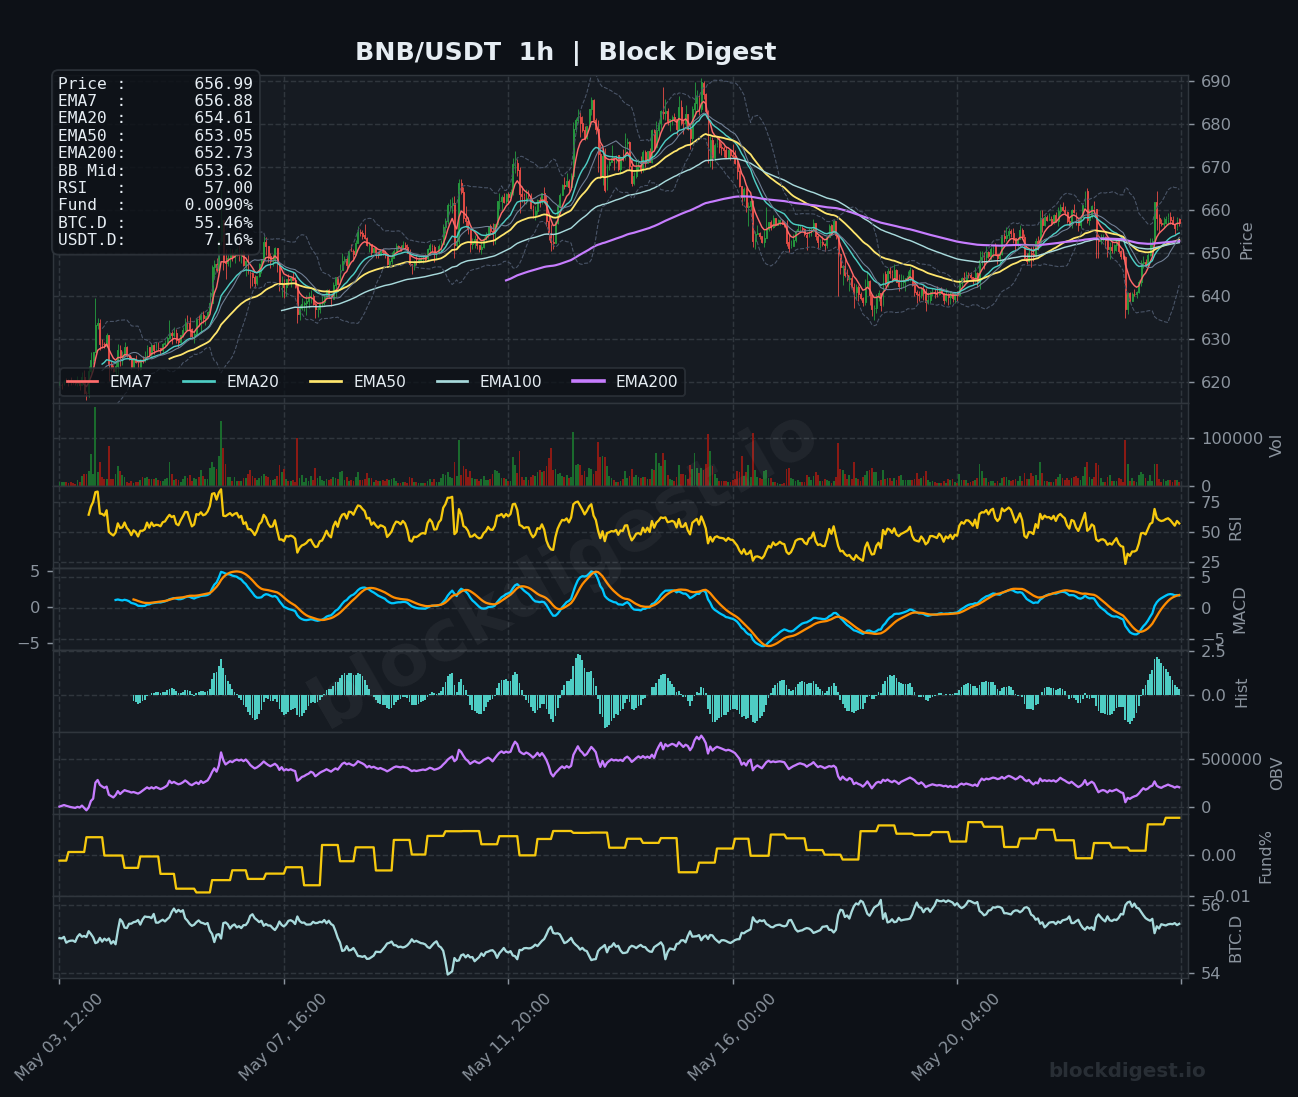
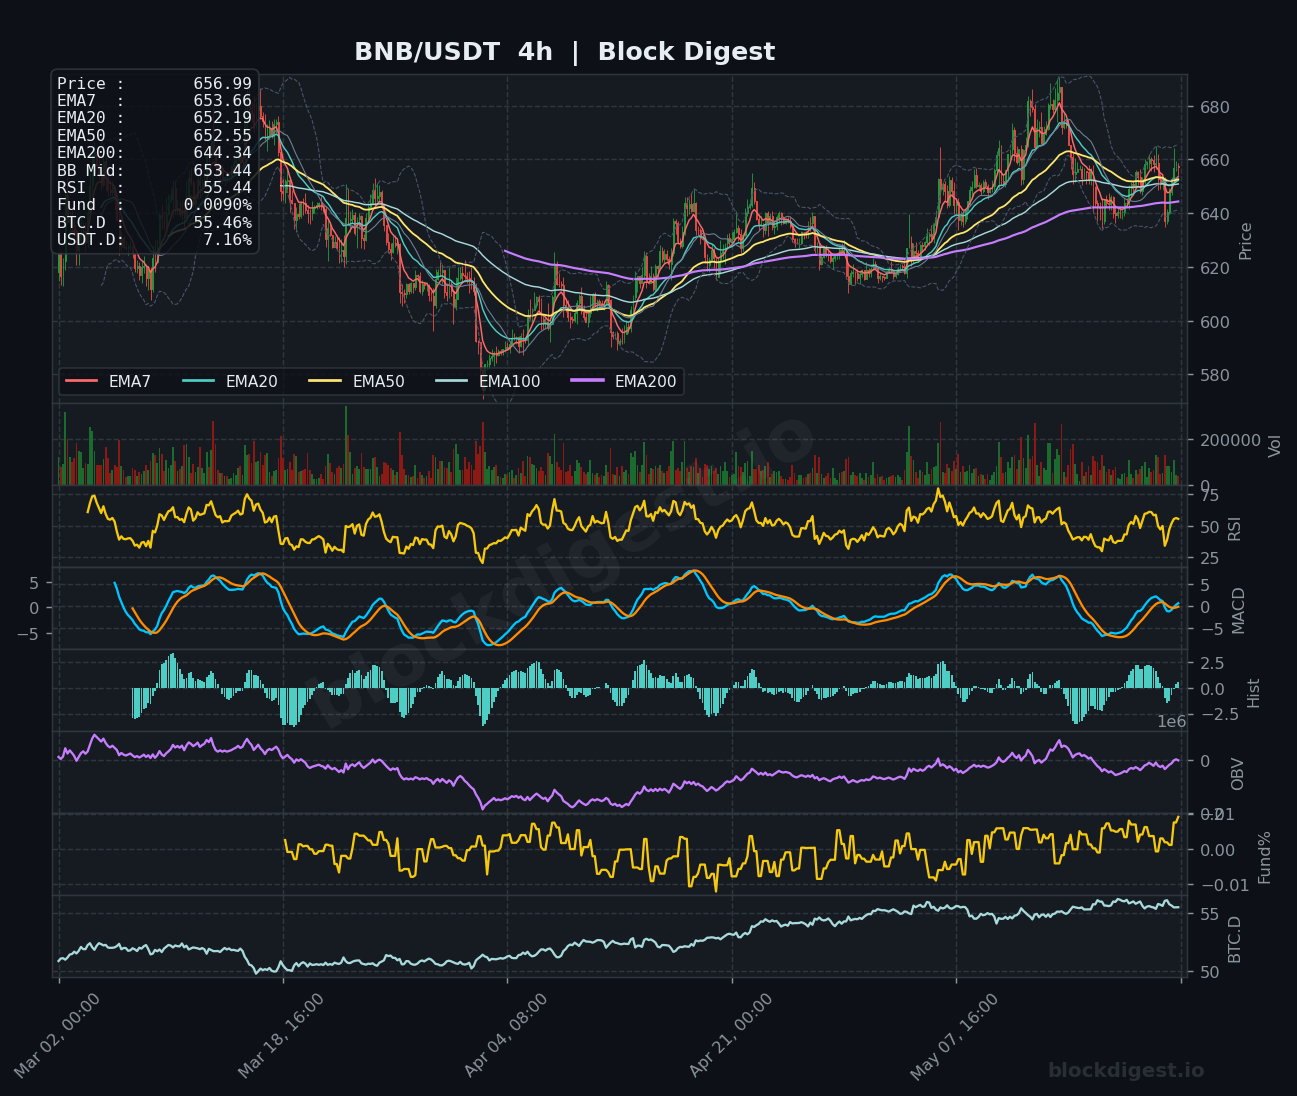
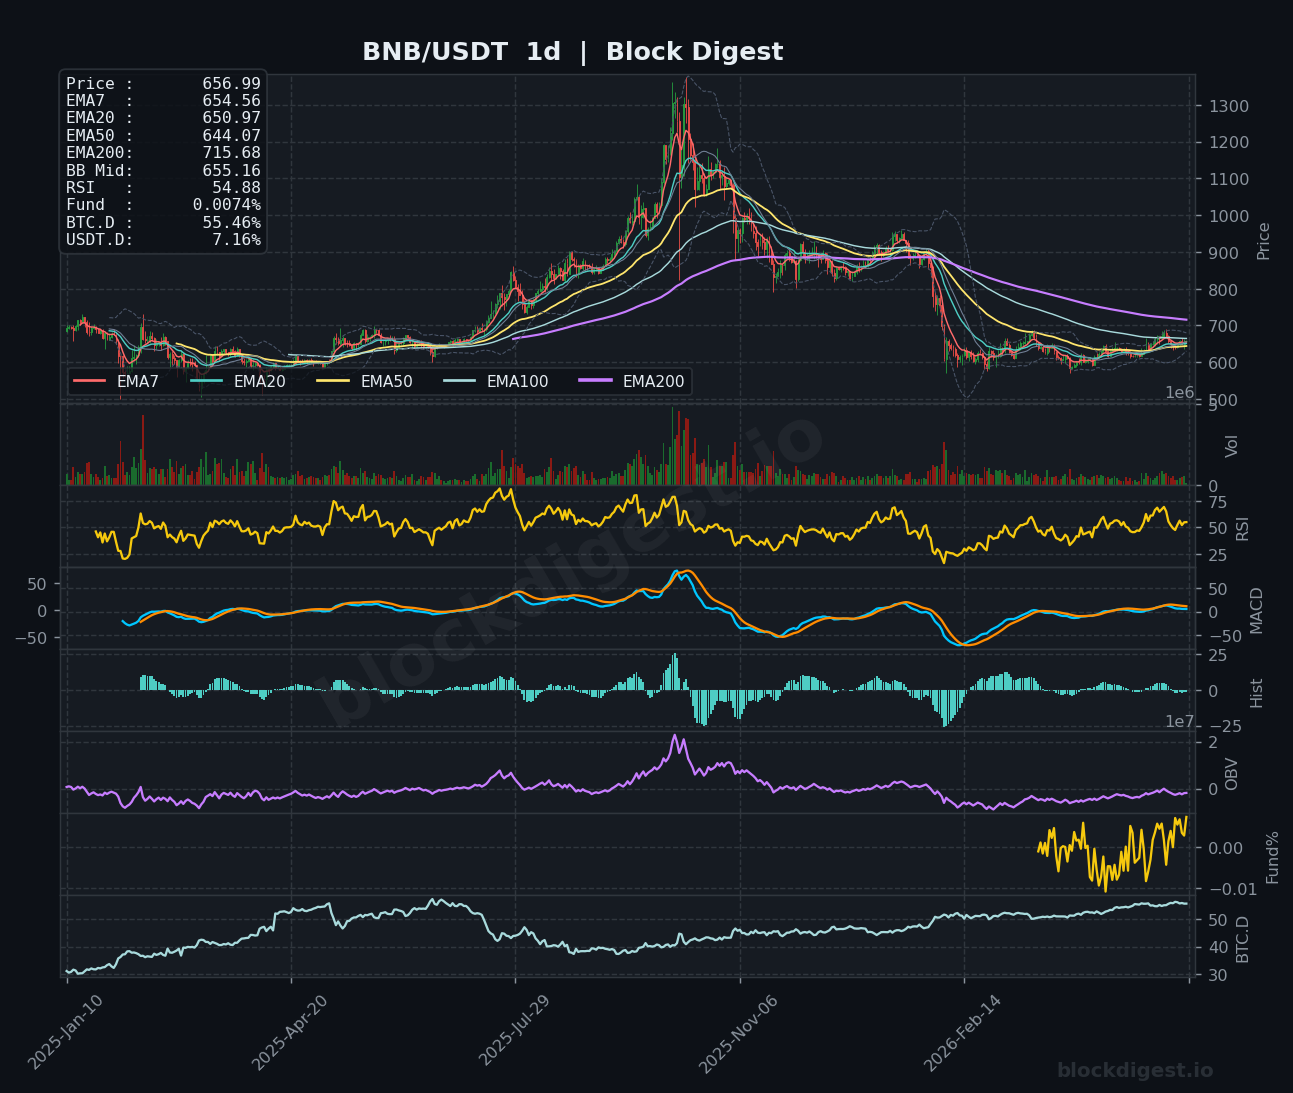
BNB is holding relatively firm at $656.99, with short-term EMAs tightly stacked and bullishly aligned on the 1h chart (EMA7 $656.88, EMA20 $654.61, EMA50 $653.05), and the 1h RSI at 57.00 pointing modestly higher. The 4h chart shows a more constructive picture than most altcoins — price has recovered from lows near $590 and is trading above the EMA200 ($644.34) on that timeframe, a notable show of relative strength. The daily RSI at 54.88 is the healthiest reading across this coverage group, and while the daily EMA200 at $715.68 remains a significant overhead obstacle, the shorter-term trend structure is more intact. Key support to watch is the $640–$644 zone; a hold there keeps the near-term bullish structure valid with a push toward $670–$680 possible.
Dogecoin (DOGE)
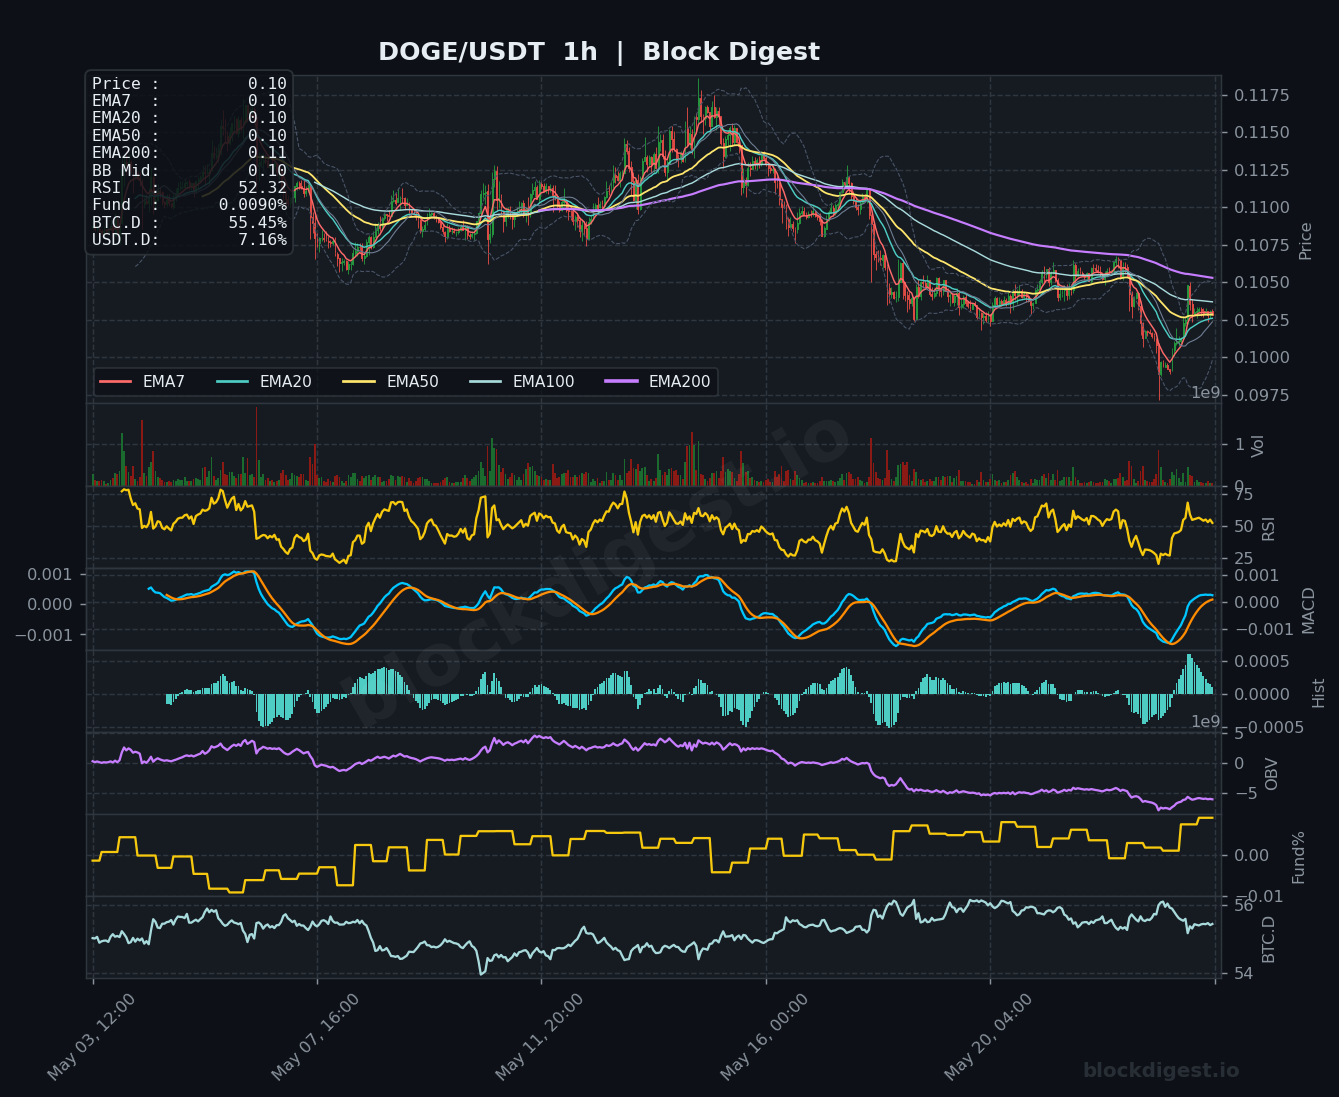
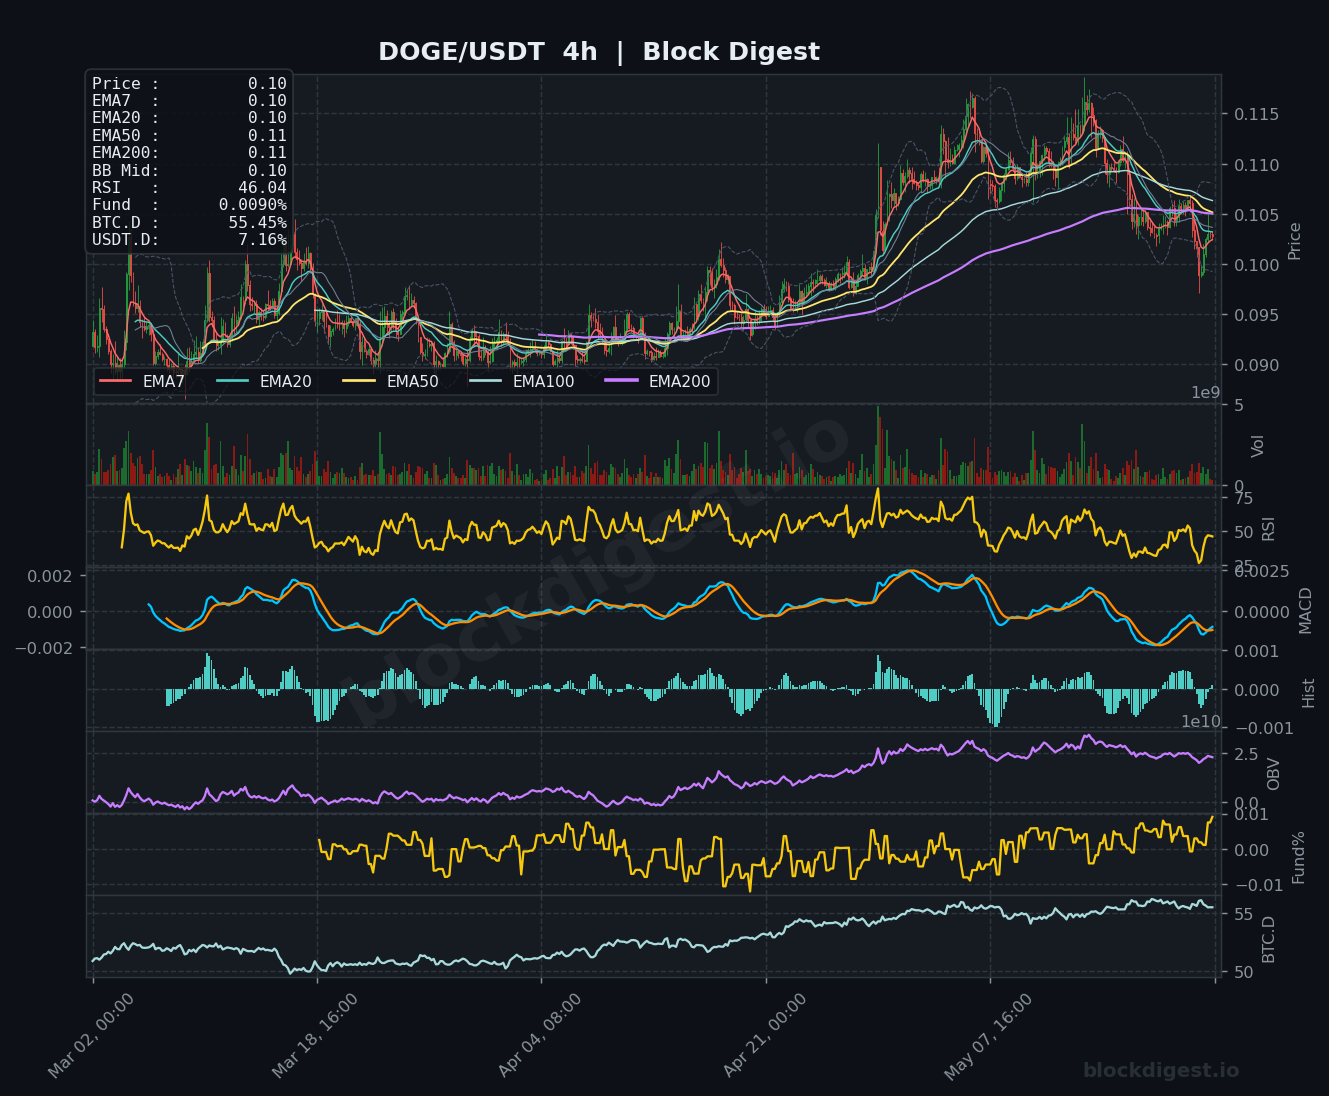
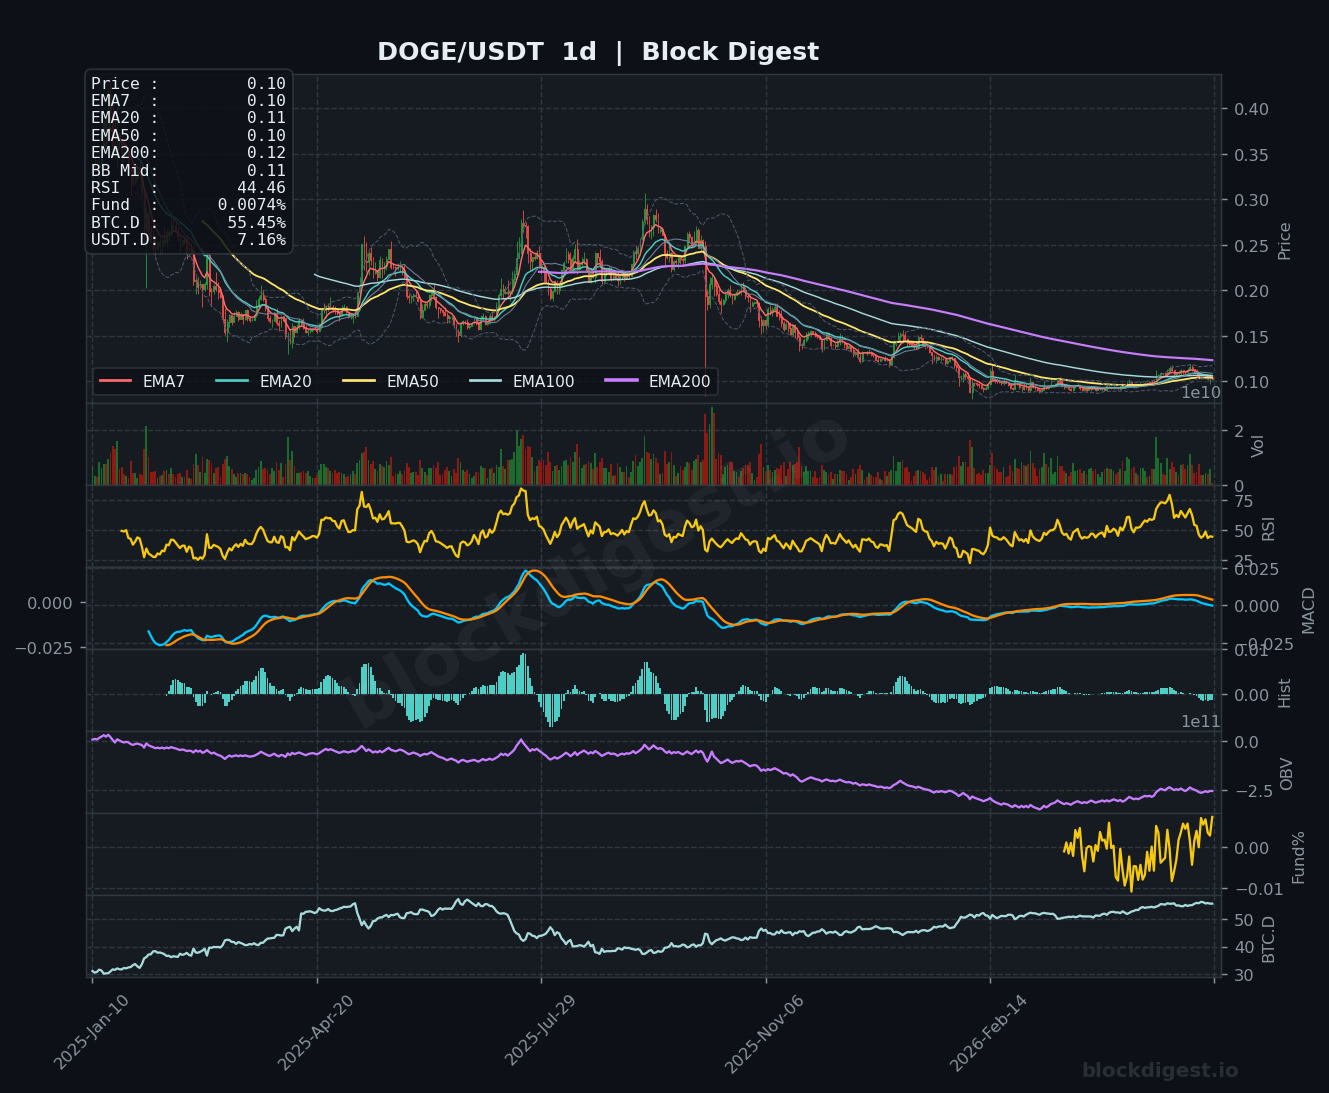
DOGE is trading at $0.10, pinned at a psychologically significant level but with the technical picture deteriorating across timeframes. The 1h RSI at 52.32 and MACD attempting a modest upward curl offer a minor near-term reprieve following a slide from the $0.115 area, but the 4h RSI at 46.04 and a negatively sloped MACD signal ongoing selling pressure in the intermediate term. The daily chart is particularly concerning — RSI at 44.46, price below the EMA20 ($0.11), EMA50 ($0.10, barely), EMA200 ($0.12), and OBV in a persistent downtrend all signal that accumulation is not occurring at current levels. Bulls need a decisive hold above $0.100 and a volume-backed push through $0.105 to begin repairing the structure.
Litecoin (LTC)
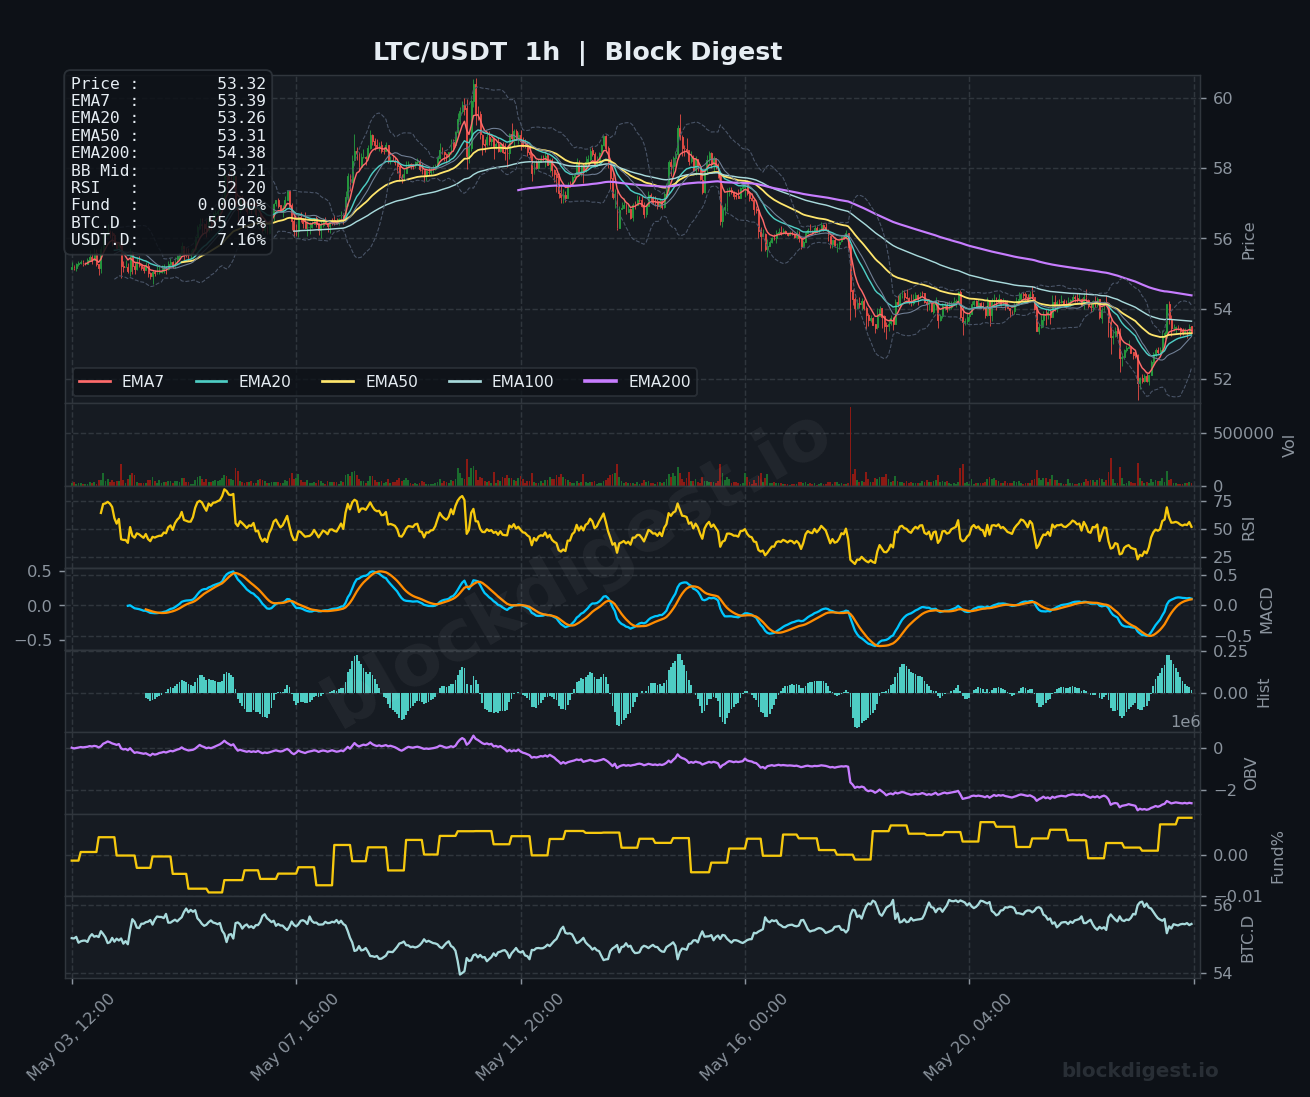
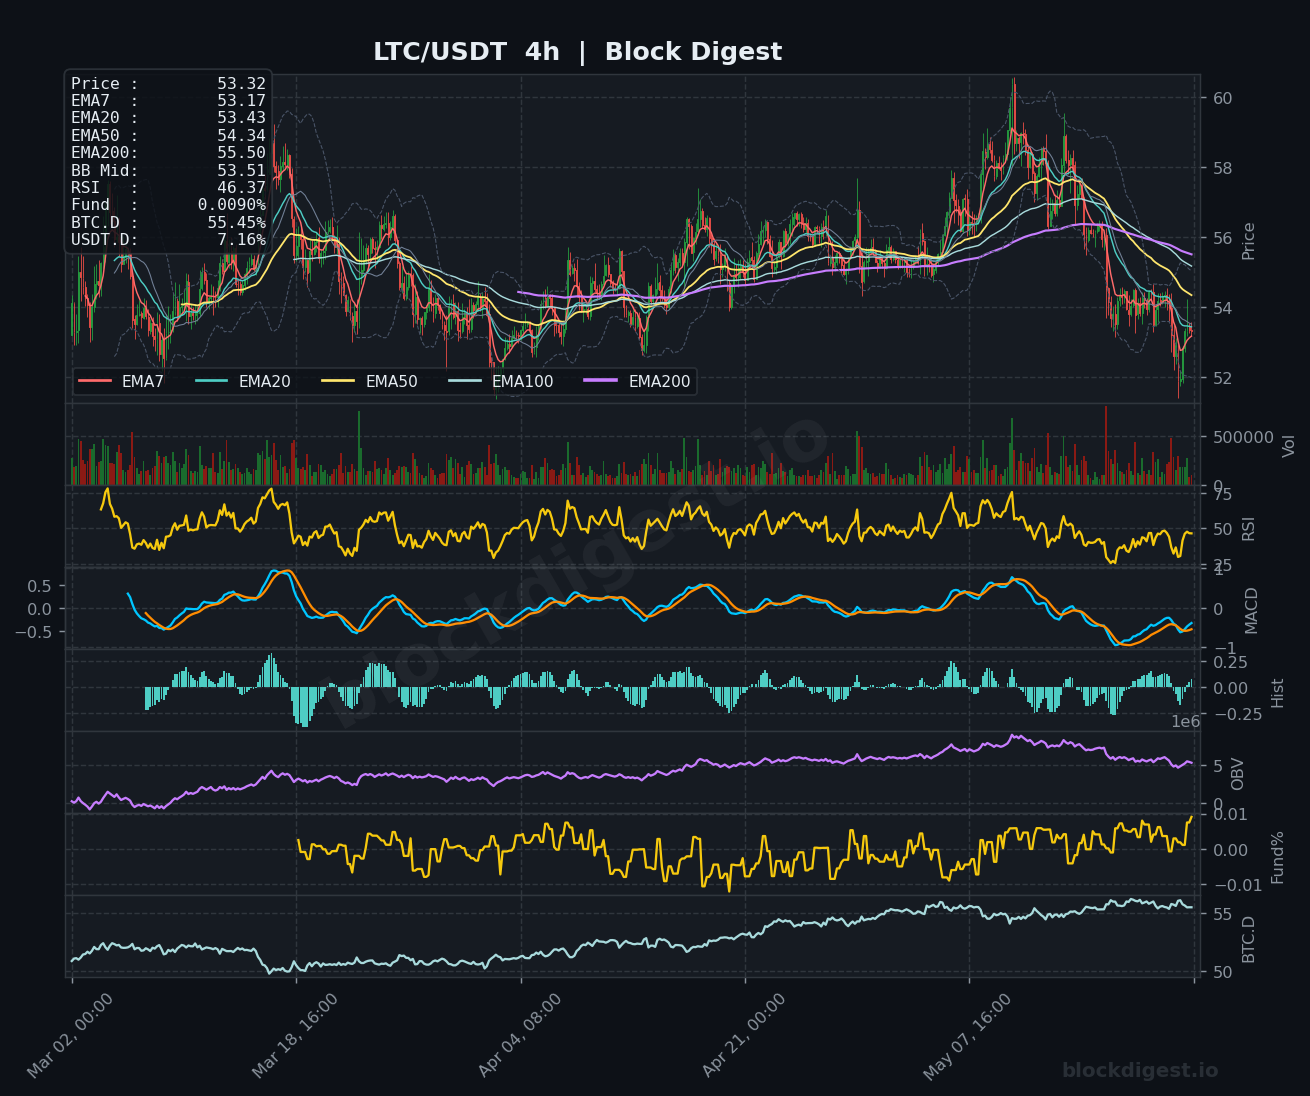
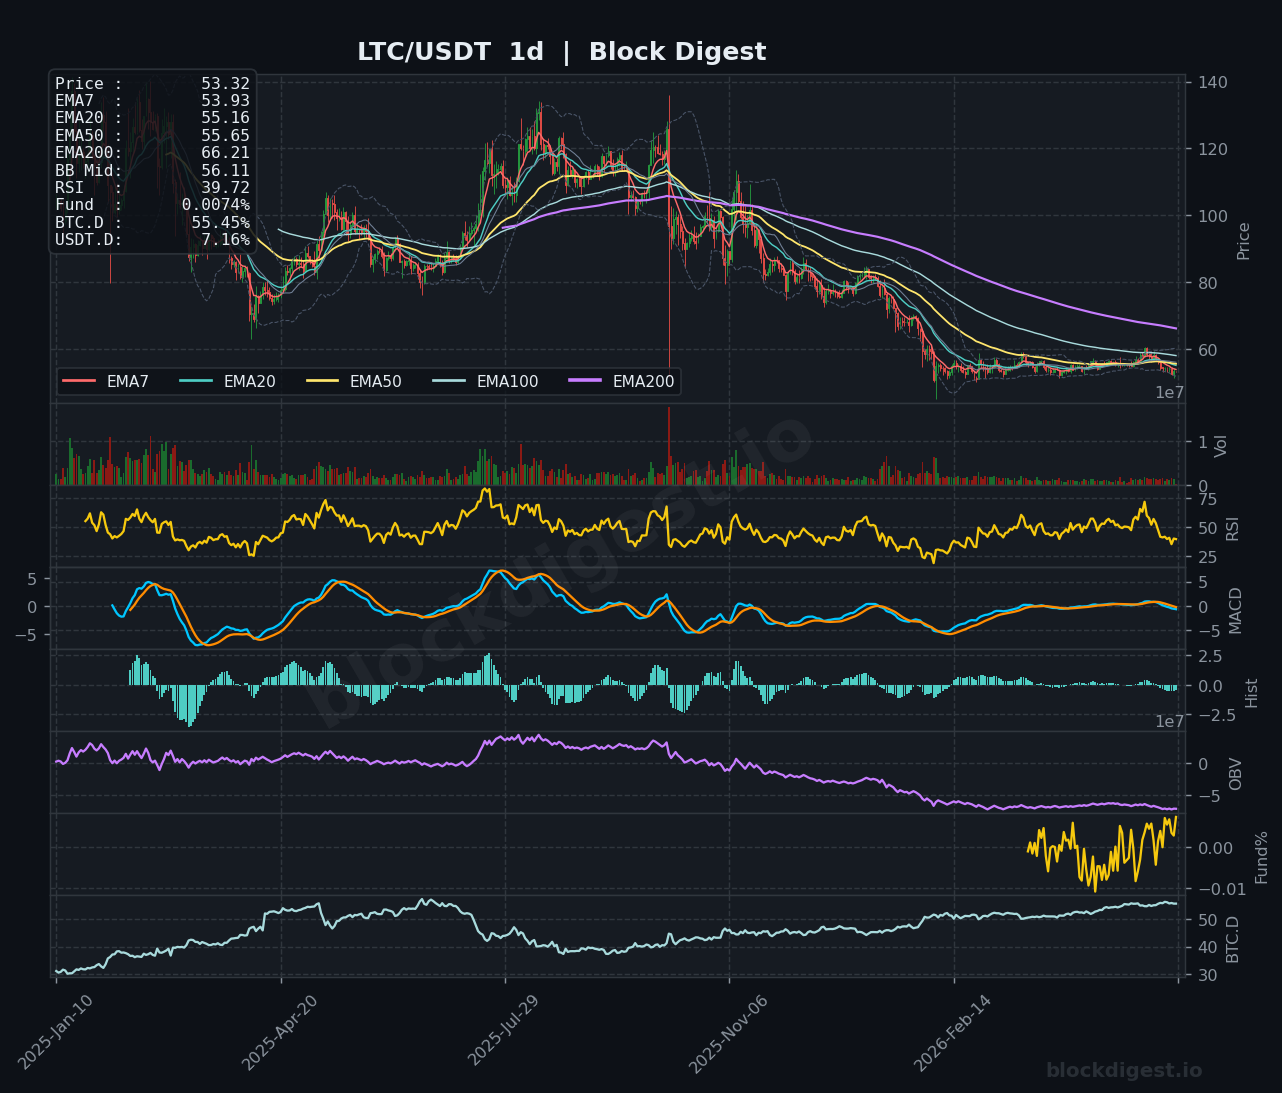
LTC is among the weakest setups in today’s coverage, trading at $53.32 with all major EMAs above price on both the 4h and daily timeframes — the daily EMA200 sits at $66.21, indicating the extent of the prolonged decline. The 4h RSI at 46.37 and a still-negative MACD on that timeframe confirm bearish momentum has not yet exhausted, and the daily RSI at 39.72 is approaching oversold territory without yet triggering a convincing reversal signal. OBV on the daily chart has been declining persistently, pointing to continued net outflows with no clear accumulation footprint. The $52 area represents the most recent swing low and near-term support; a break below this level would expose LTC to further downside, while a recovery above $55.50 (the daily EMA20) would be the first meaningful sign of a trend shift.
TRON (TRX)
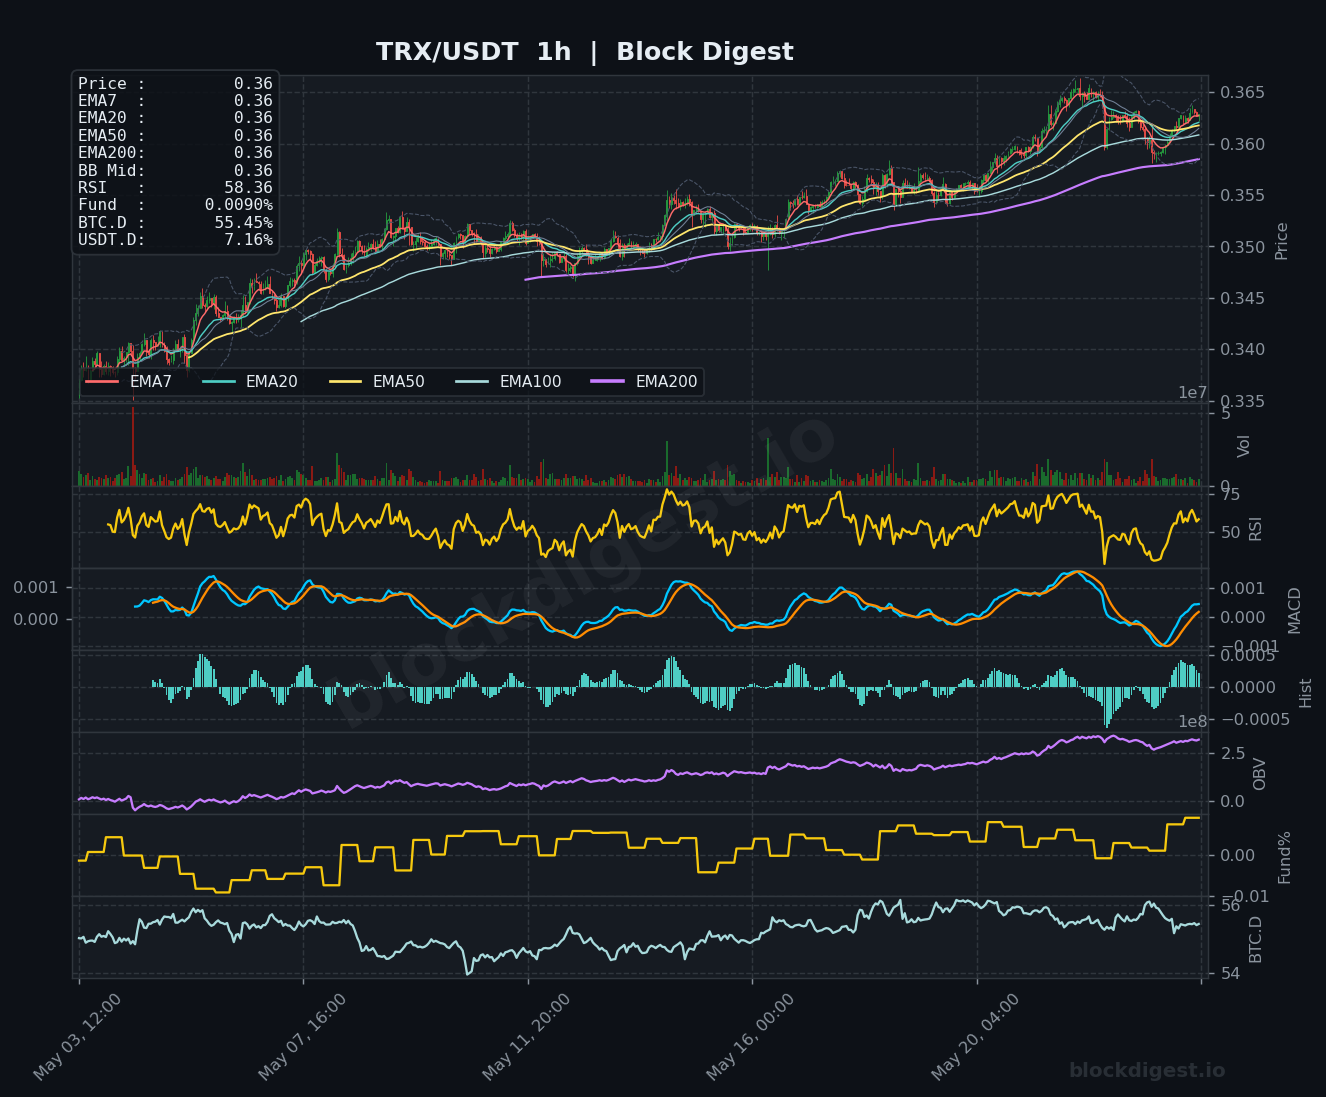
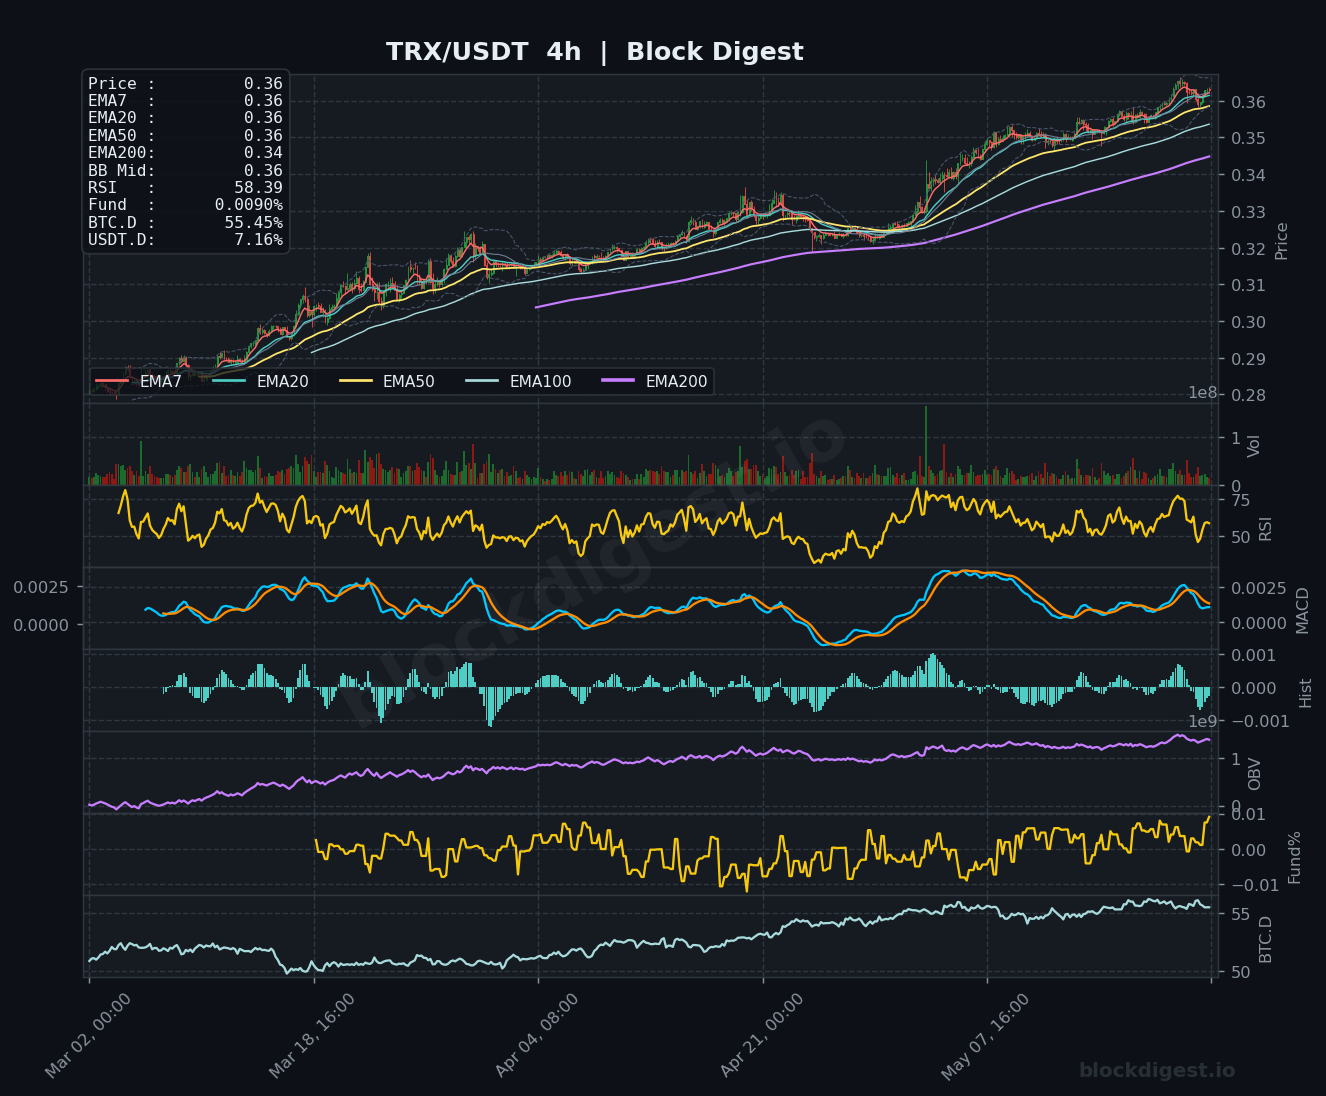
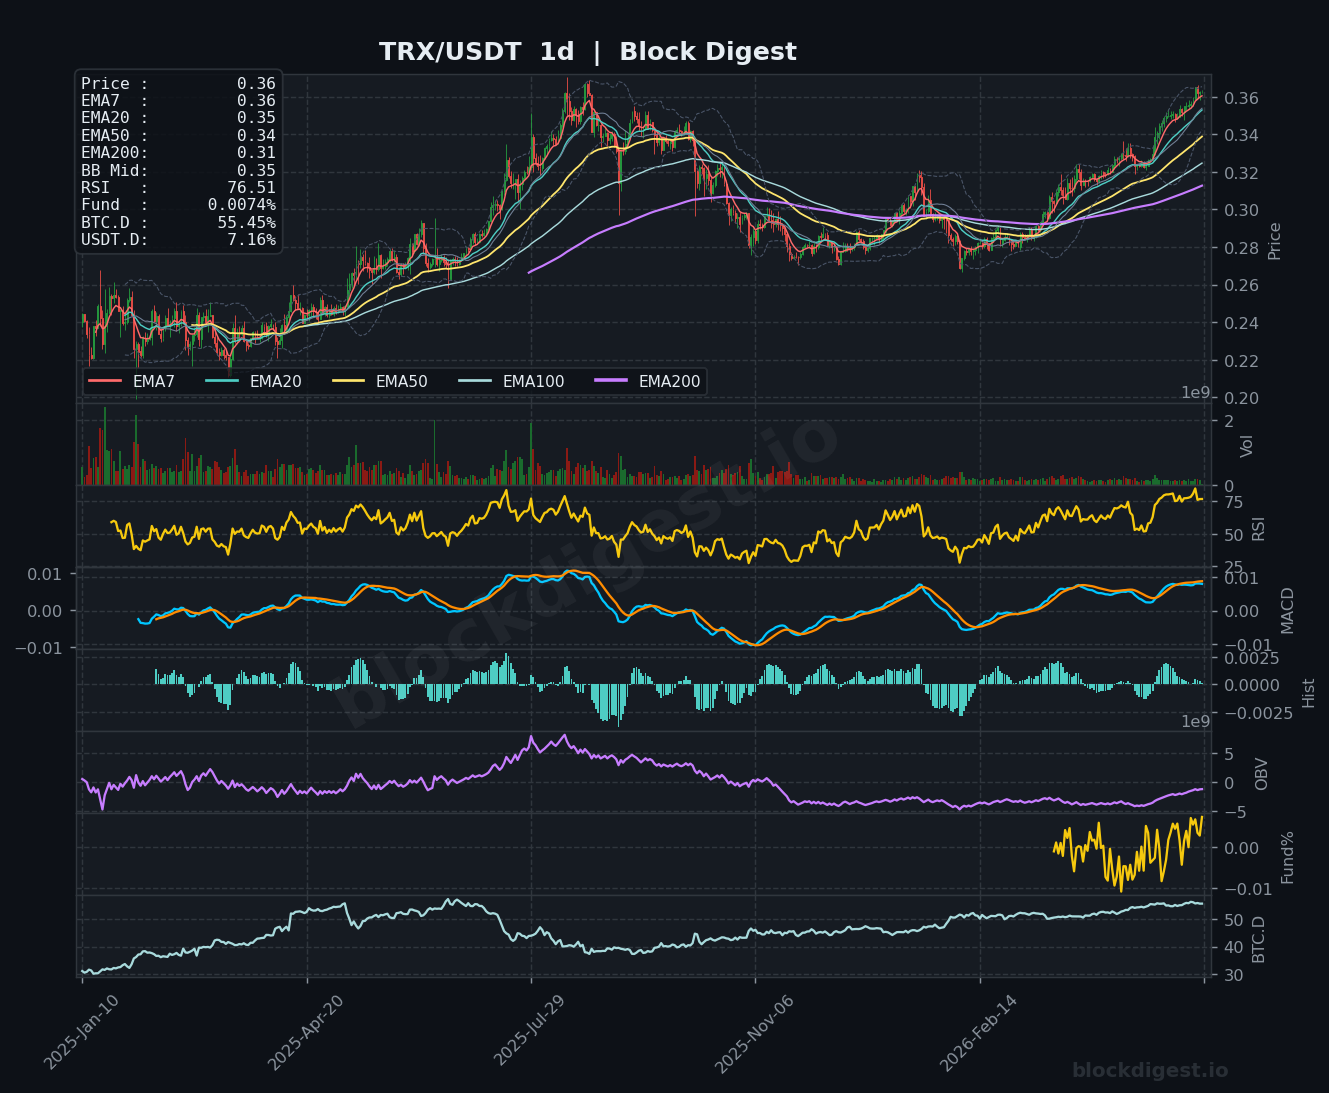
TRX stands out as the clear outperformer among today’s altcoins, trading at $0.36 in a well-defined and persistent uptrend that is evident across all three timeframes. The 4h chart shows price trading above all EMAs with the EMA200 ($0.34) acting as a rising support floor, and the 4h RSI at 58.39 leaves room for further upside without being overbought. Most notably, the daily RSI has reached 76.51 — the strongest momentum reading in this group — and the daily MACD is positively trending with price well above the EMA7 ($0.36), EMA20 ($0.35), EMA50 ($0.34), and EMA200 ($0.31). The daily RSI reading does warrant caution for new long entries as overbought conditions could trigger a pullback toward the $0.34–$0.35 support zone; however, the trend structure remains firmly bullish and TRX continues to demonstrate exceptional relative strength.
Altcoin Outlook
As of May 24, 2026, the altcoin market presents a highly bifurcated picture: TRX is the standout performer with a clean multi-timeframe uptrend, while LTC and DOGE represent the weakest setups with deteriorating technicals and persistent OBV downtrends. BNB shows the most resilience among the larger caps, maintaining structure above key 4h EMAs, whereas SOL and XRP remain trapped in macro downtrends that will require sustained buying pressure to overcome. The critical macro condition to monitor is BTC dominance — a rollover from the 55.47% level would be the primary catalyst needed to unlock broader altcoin upside, and traders should watch for USDT.D to break below 7.00% as a confirming signal of improved risk appetite across the space.
Disclaimer: This analysis is for informational purposes only and does not constitute financial advice. Cryptocurrency markets are highly volatile and unpredictable. All trading decisions should be made based on your own research and risk tolerance. Block Digest is not responsible for any financial losses incurred as a result of acting on this content.
Stay Ahead of the Market
Follow BlockDigest for crypto market intelligence, research and real-time updates.


