Altcoin Daily Analysis — May 15, 2026
Altcoin Daily Roundup – May 15, 2026
Market Context
The altcoin market is exhibiting mixed momentum with Bitcoin dominance hovering around 55%, suggesting a relatively balanced relationship between BTC and altcoin performance. USDT dominance at 6.84-6.85% indicates moderate stablecoin demand, reflecting neither extreme risk-on nor risk-off sentiment across the broader crypto market. Altcoins are demonstrating varied technical setups, with momentum diverging across different tokens as traders digest recent regulatory developments and position for potential breakouts.
Solana (SOL)
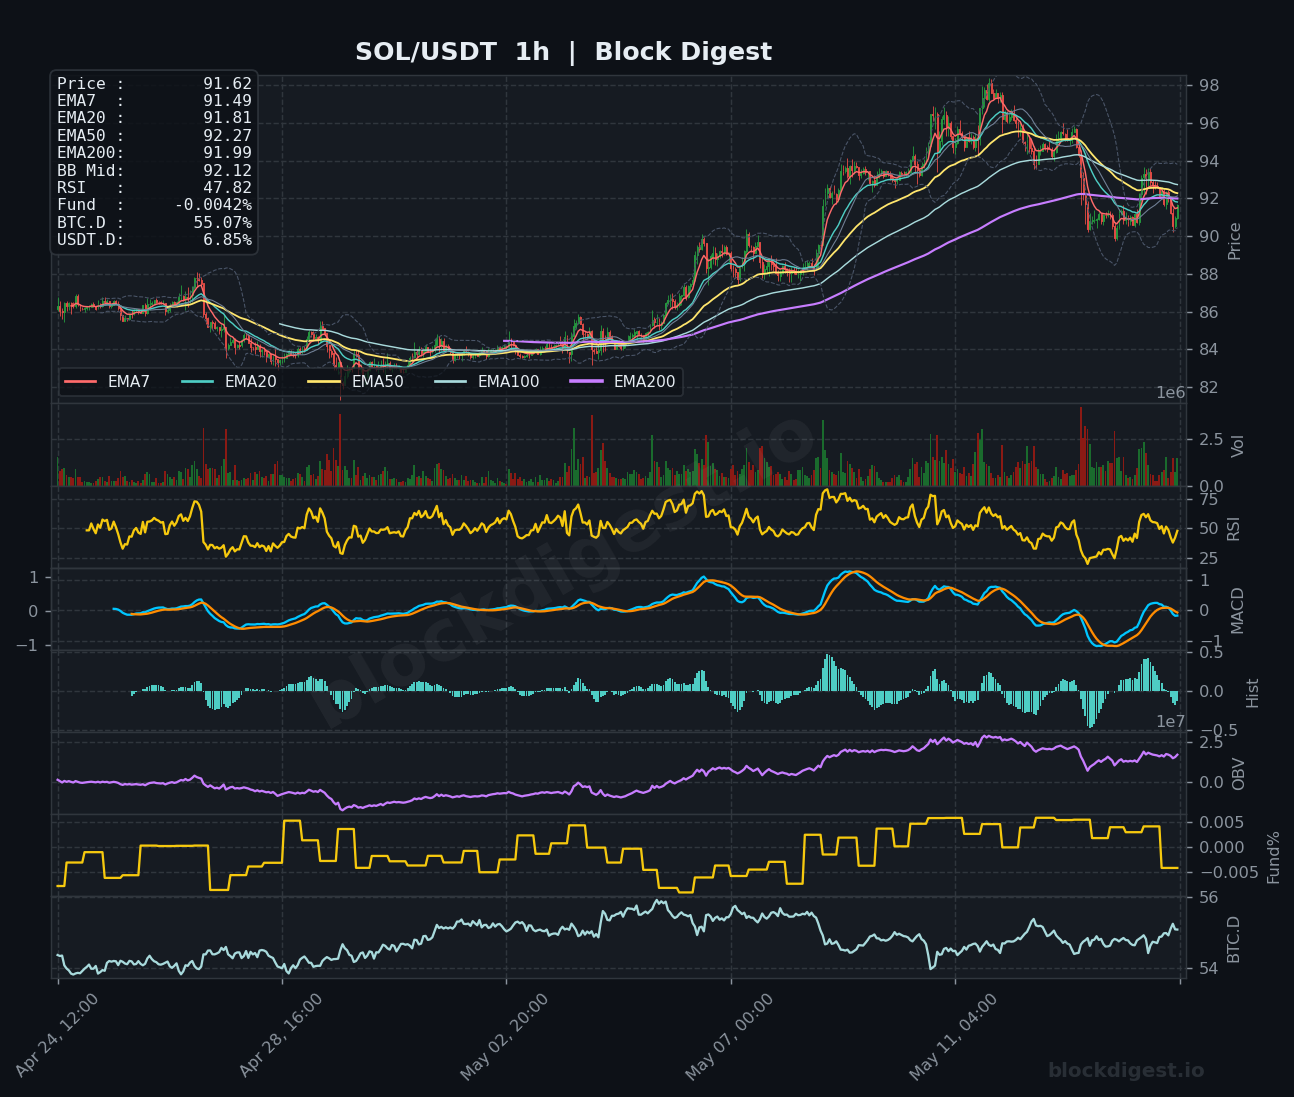
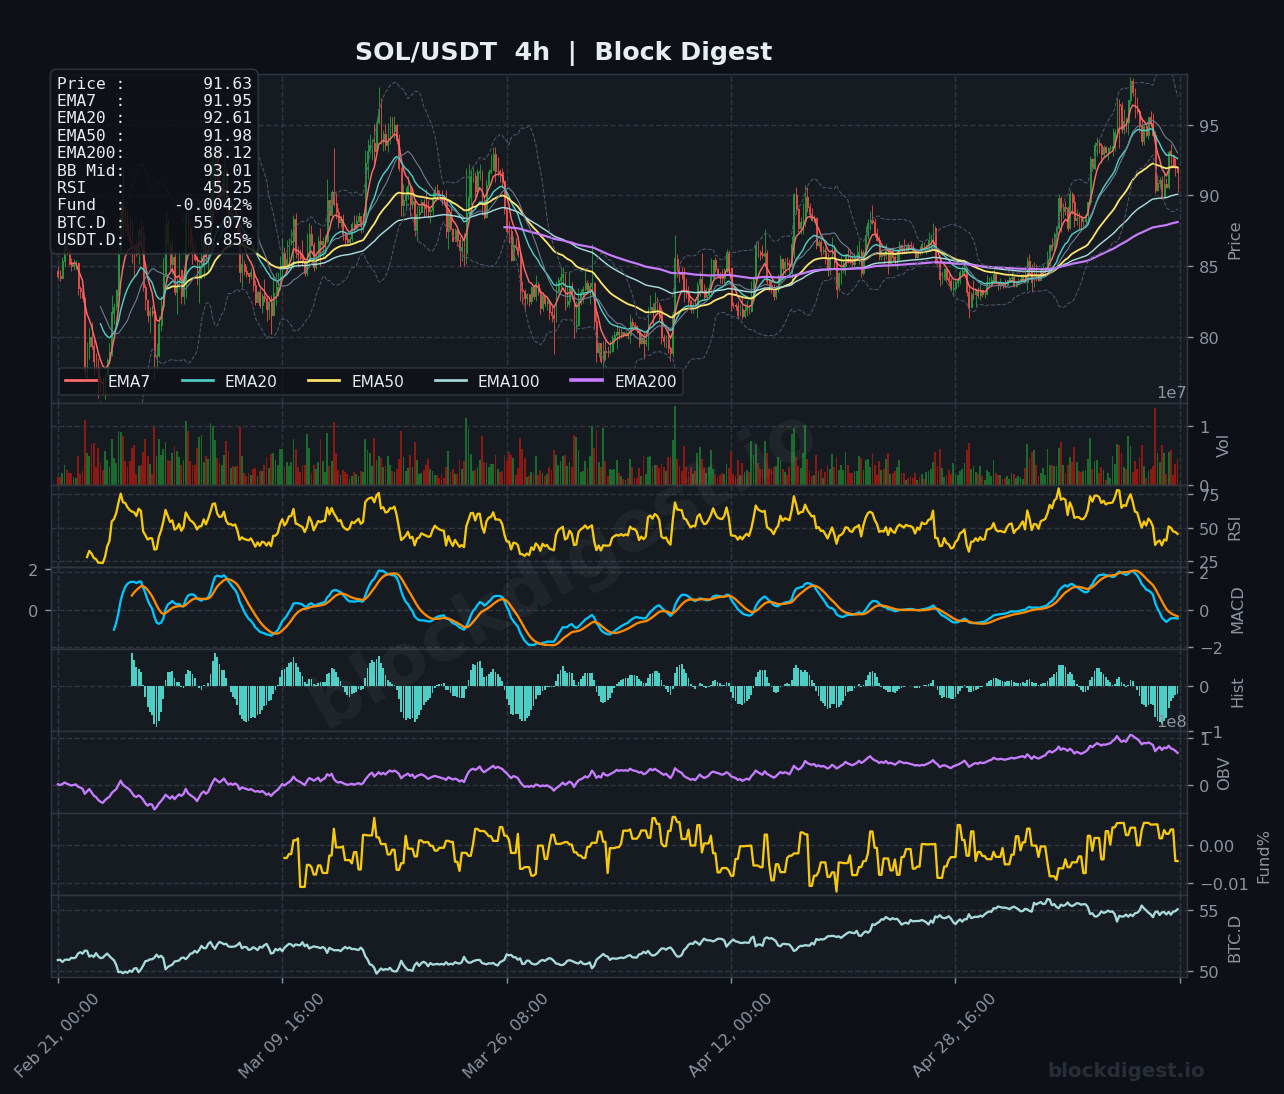
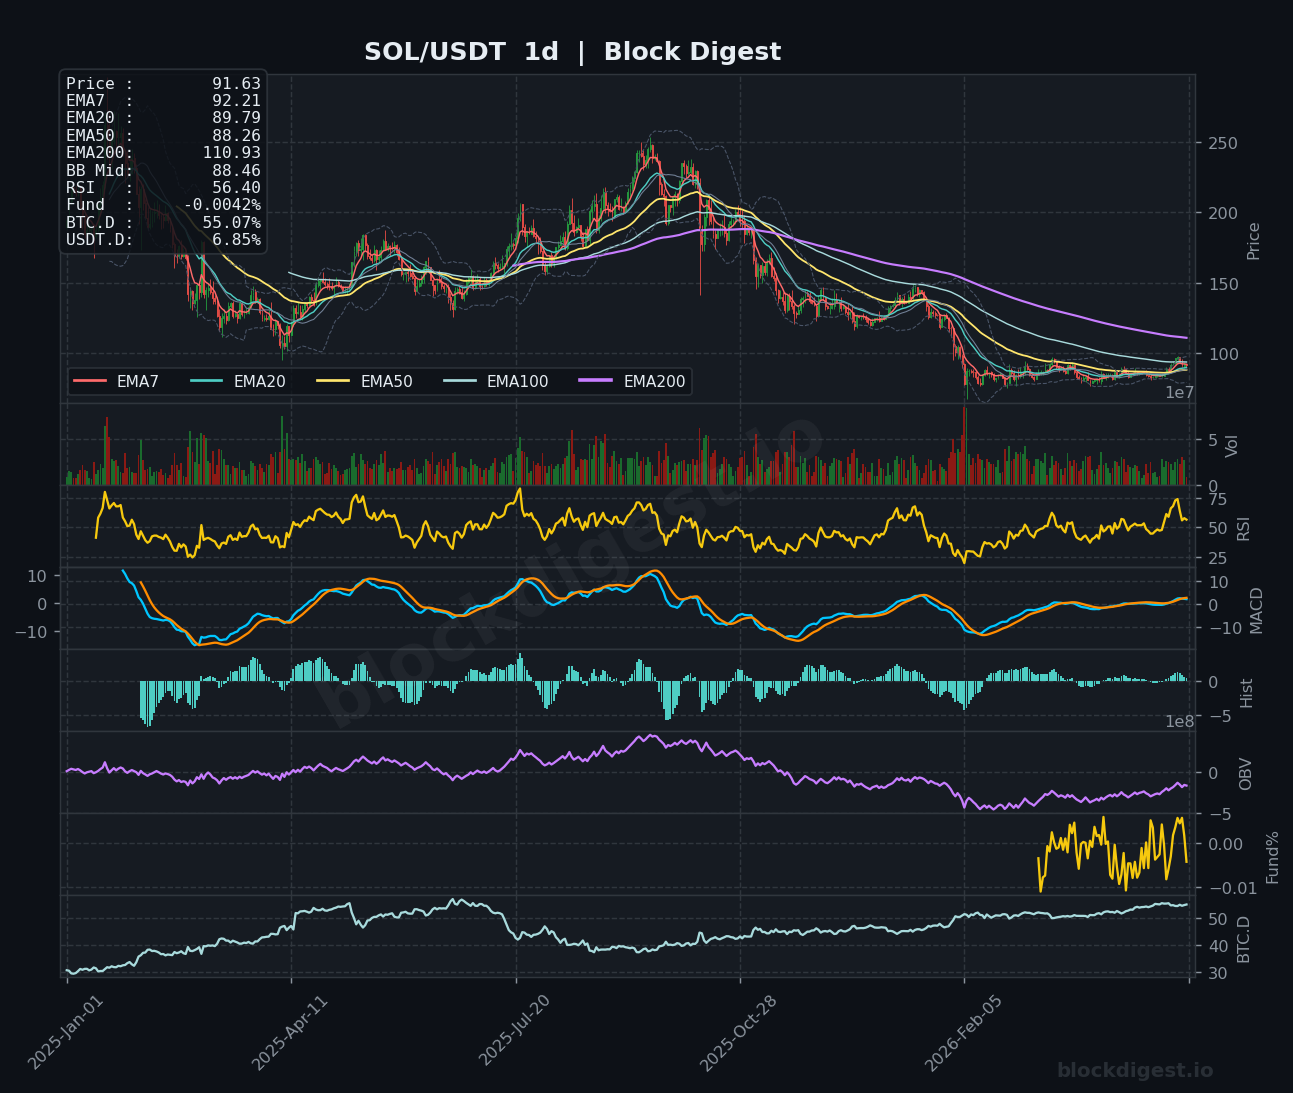
SOL is trading at $91.62, showing signs of consolidation after a volatile period that saw prices peak near $98 before retracing. The token is currently compressed between its short-term EMAs, with the 7-period ($91.49) and 20-period ($91.81) moving averages converging tightly around current price levels. The RSI at 47.82 suggests neutral momentum, while the MACD has rolled bearish with a negative histogram reading, indicating waning bullish pressure. On the daily timeframe, SOL remains below all major moving averages and is testing the $90-92 support zone, which will be critical for determining whether the token can stabilize or face further downside toward $85. The short-term bias remains cautiously bearish unless SOL can reclaim $94 and break above its 50-day EMA at $92.27.
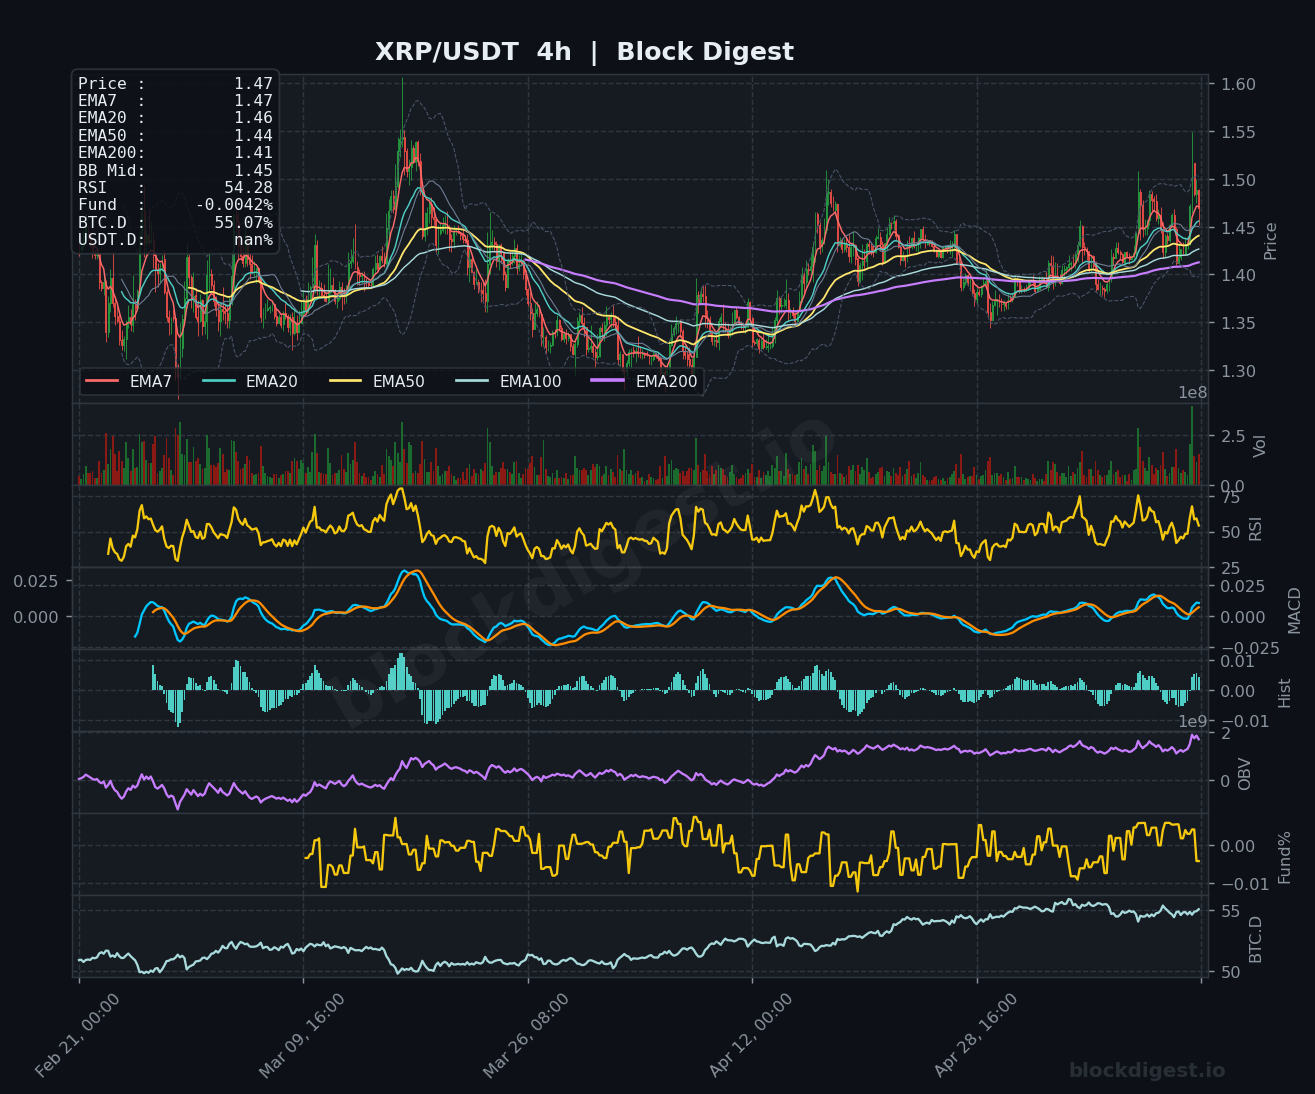
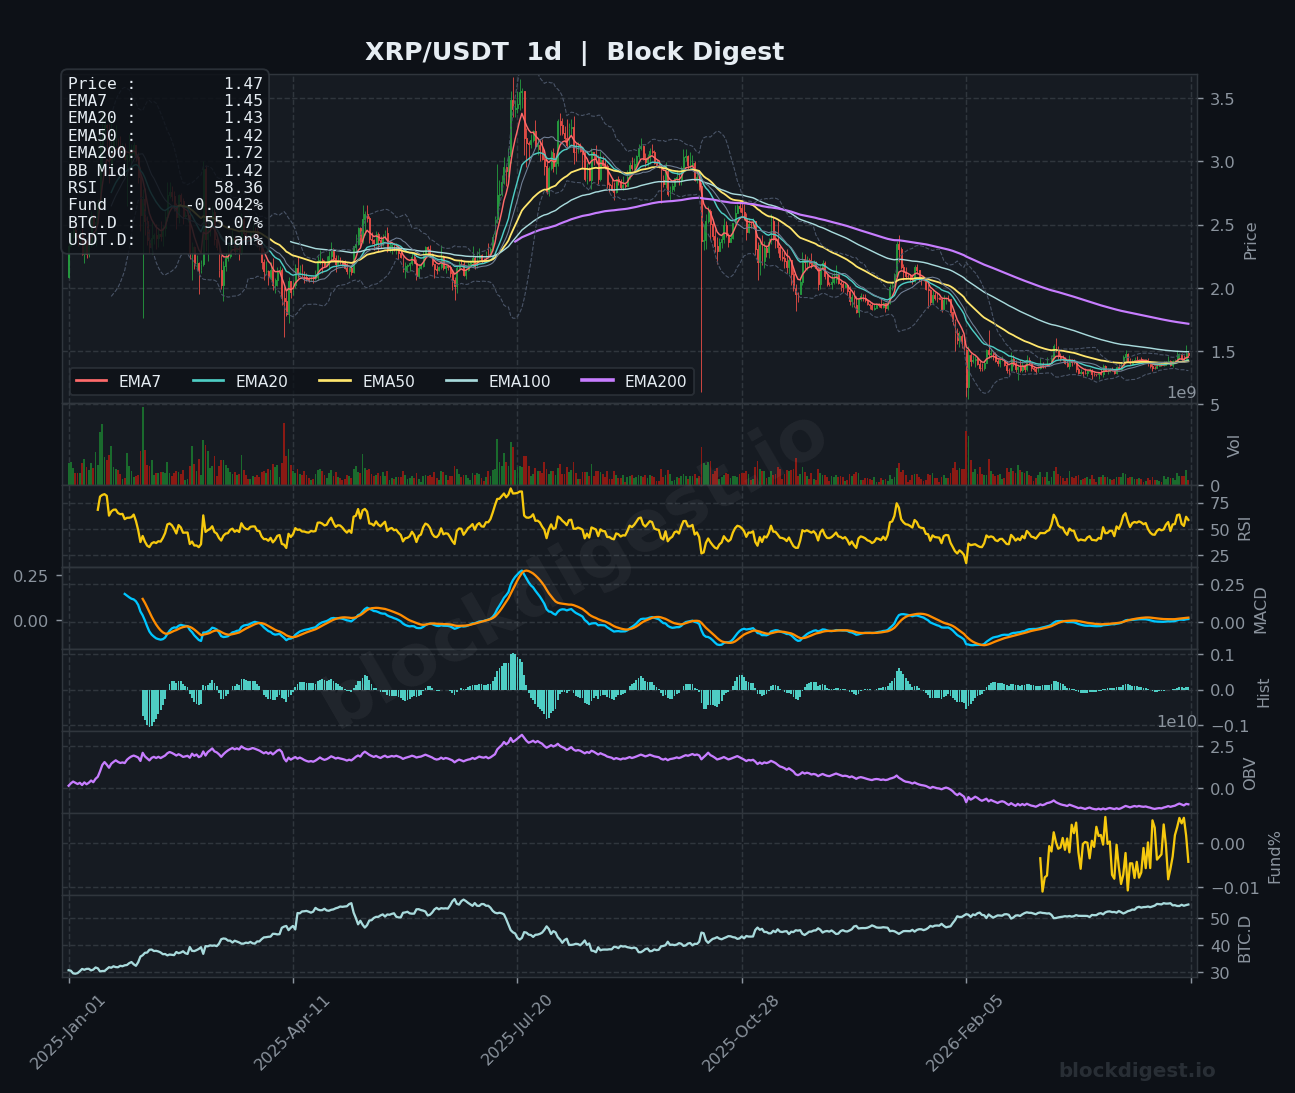
XRP (XRP)
XRP is currently trading at $1.47, benefiting from positive regulatory momentum following the CLARITY Act’s progression through the Senate Banking Committee. The token has broken above its short-term moving averages, with price trading above the EMA7 ($1.47), EMA20 ($1.48), and EMA50 ($1.46), signaling strengthening technical structure. The RSI reading of 49.22 on the 1-hour chart shows neutral-to-slightly-bullish momentum, while the MACD is curling higher, suggesting building positive momentum. On the daily timeframe, XRP displays a clearer bullish setup with the RSI at 58.36 and price attempting to establish support above $1.45, with immediate resistance at $1.50-$1.52. The short-term bias leans bullish, especially if XRP can maintain support above $1.44 and push toward the $1.55 resistance level, potentially targeting $1.60 on continued regulatory optimism.

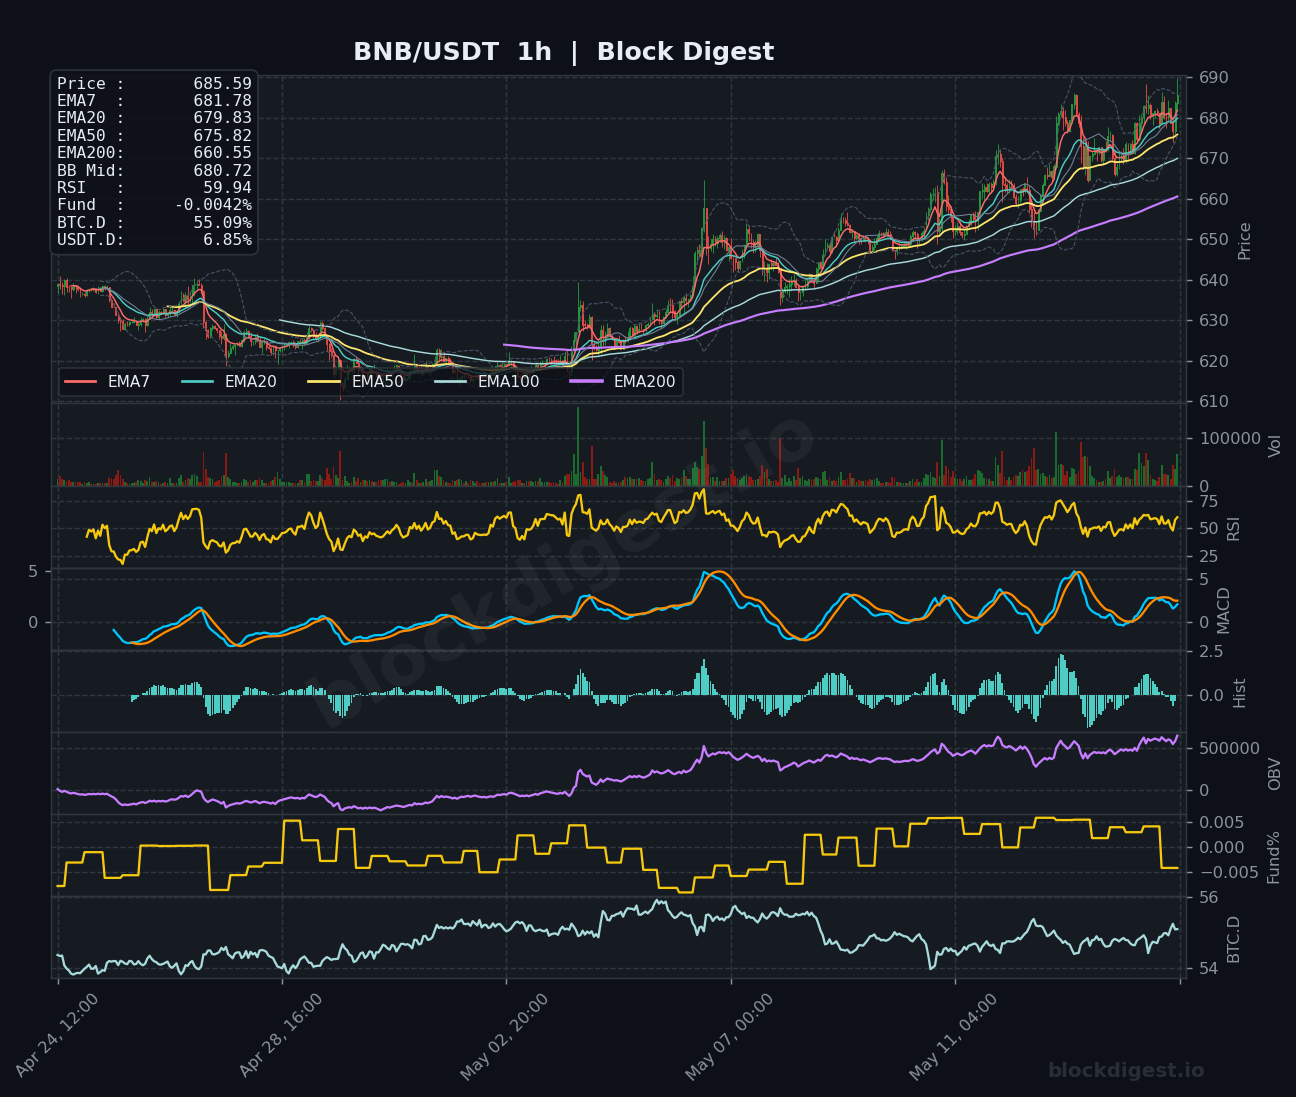
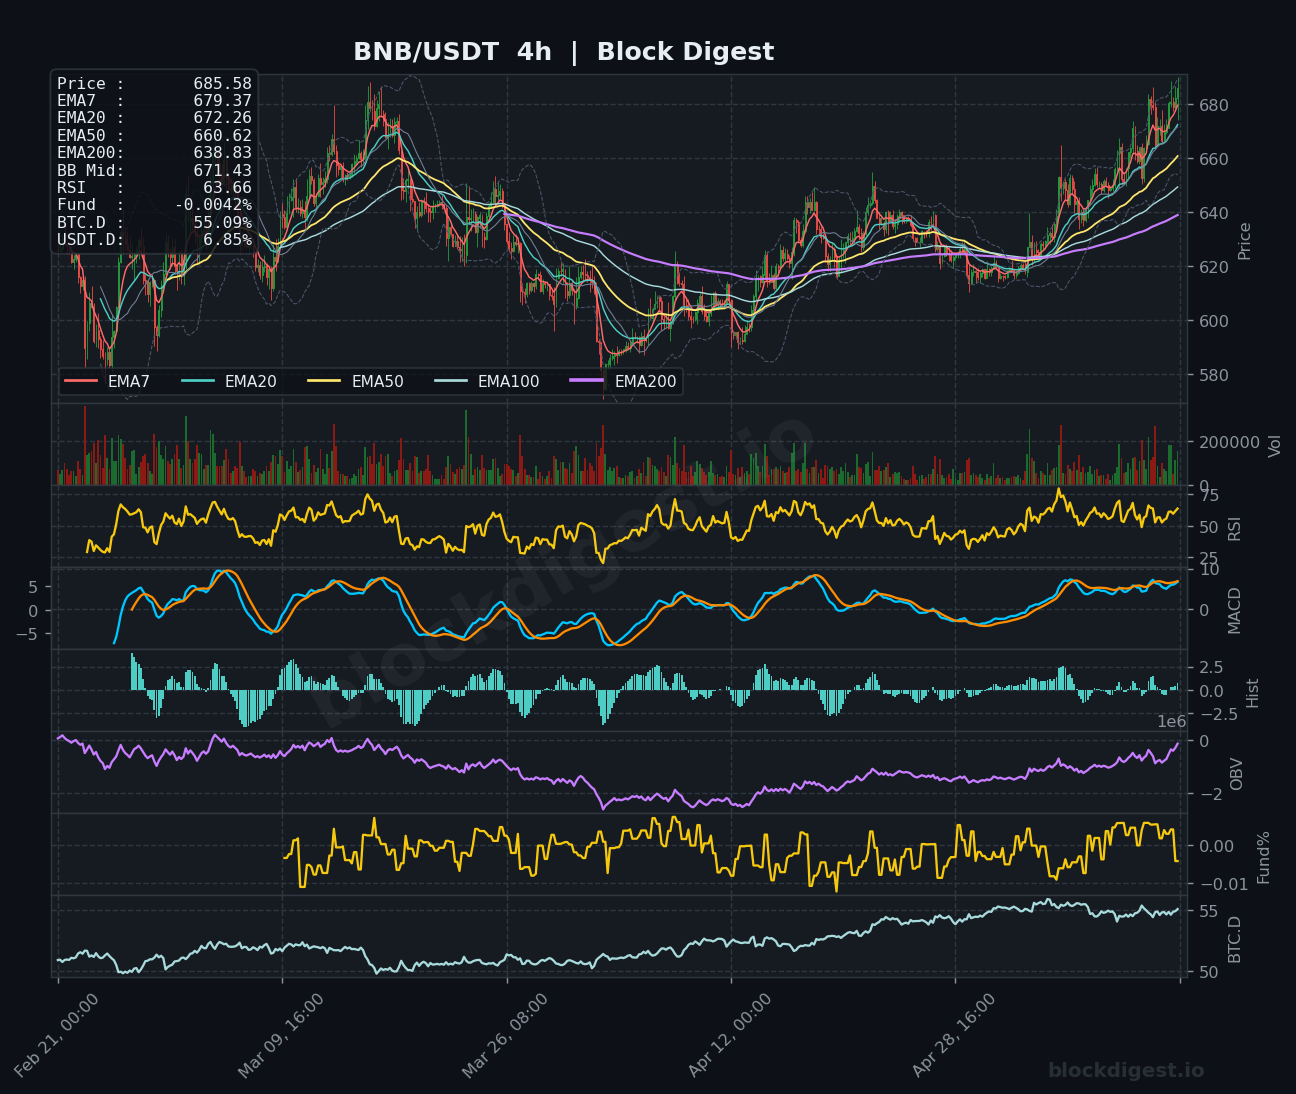
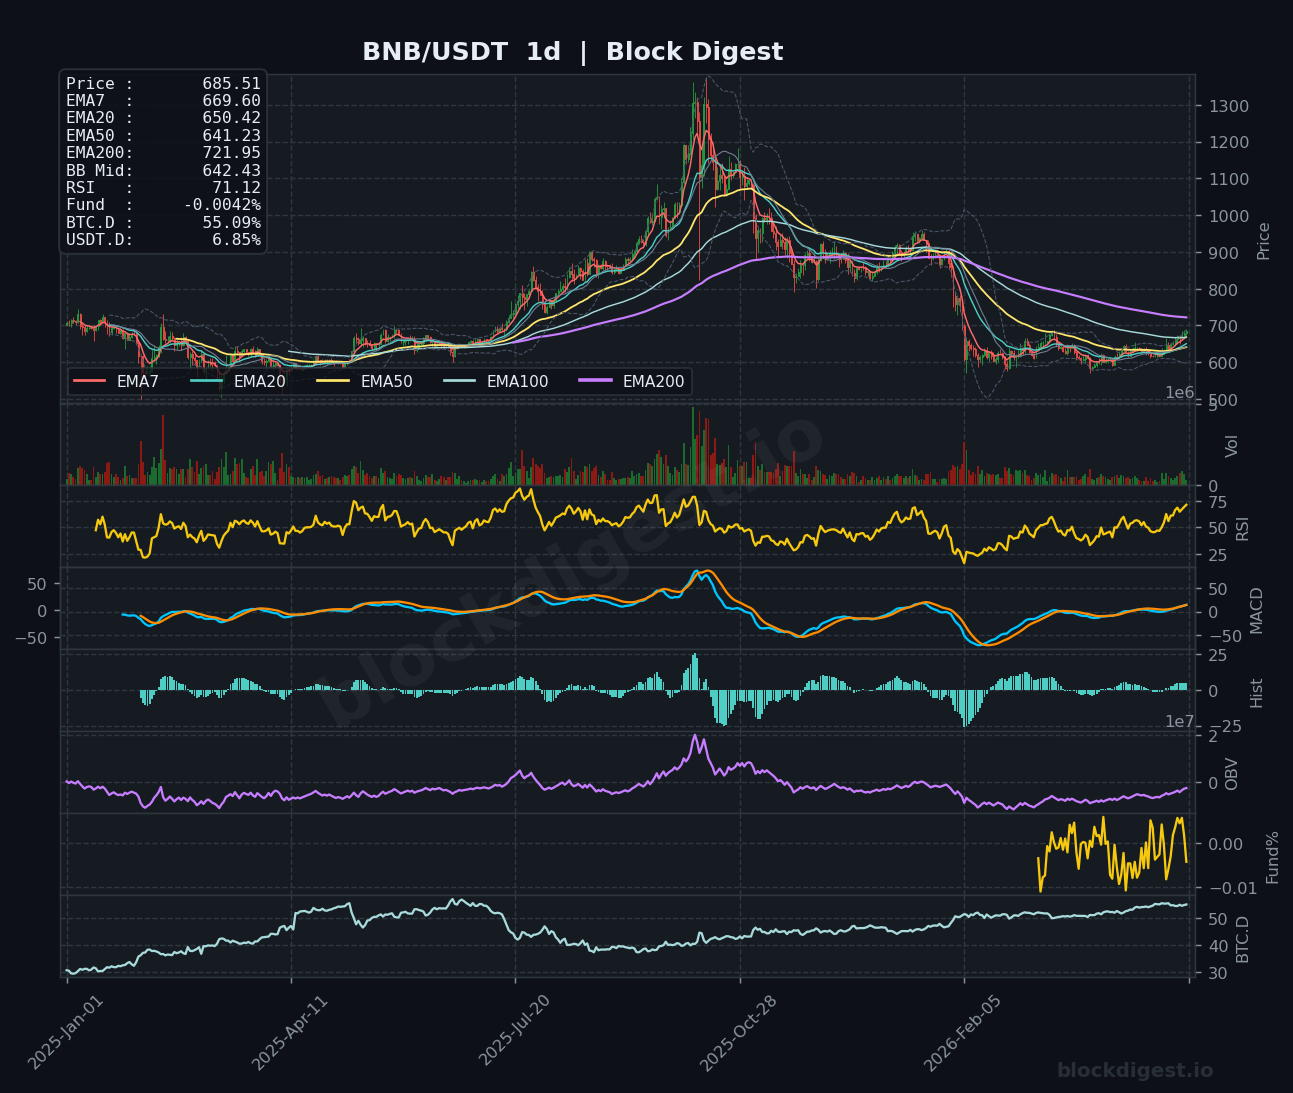
BNB (BNB)
BNB is trading at $685.59, demonstrating relative strength compared to many altcoins with price maintaining position above key short-term moving averages. The token is currently above its EMA7 ($681.78) and EMA20 ($679.83), though it faces resistance near the $690 level. The RSI at 59.94 indicates moderately bullish momentum without entering overbought territory, while the MACD remains constructive with positive histogram readings. On the 4-hour chart, BNB shows a clear uptrend with higher lows established throughout the recent consolidation phase, and the token is testing the upper boundary of its ascending channel near $685-$690. The daily chart reveals BNB trading above its EMA50 ($641.23) with an RSI of 71.12, suggesting strong momentum but also approaching overbought conditions. The short-term bias remains bullish with immediate support at $675 and upside potential toward $700-$710 if momentum sustains.
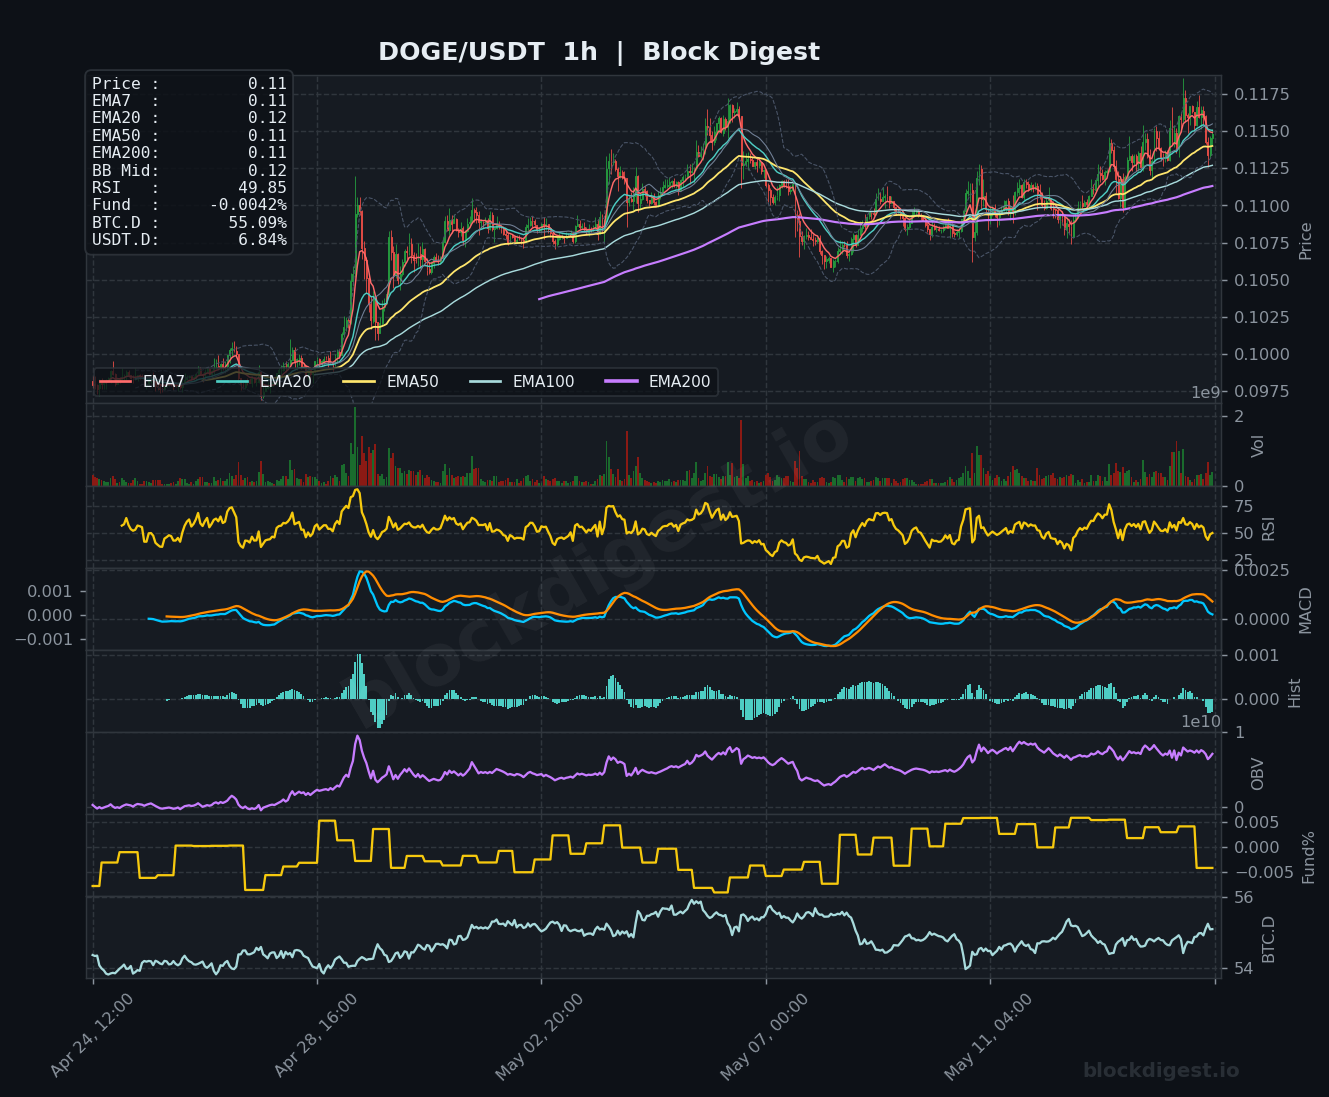
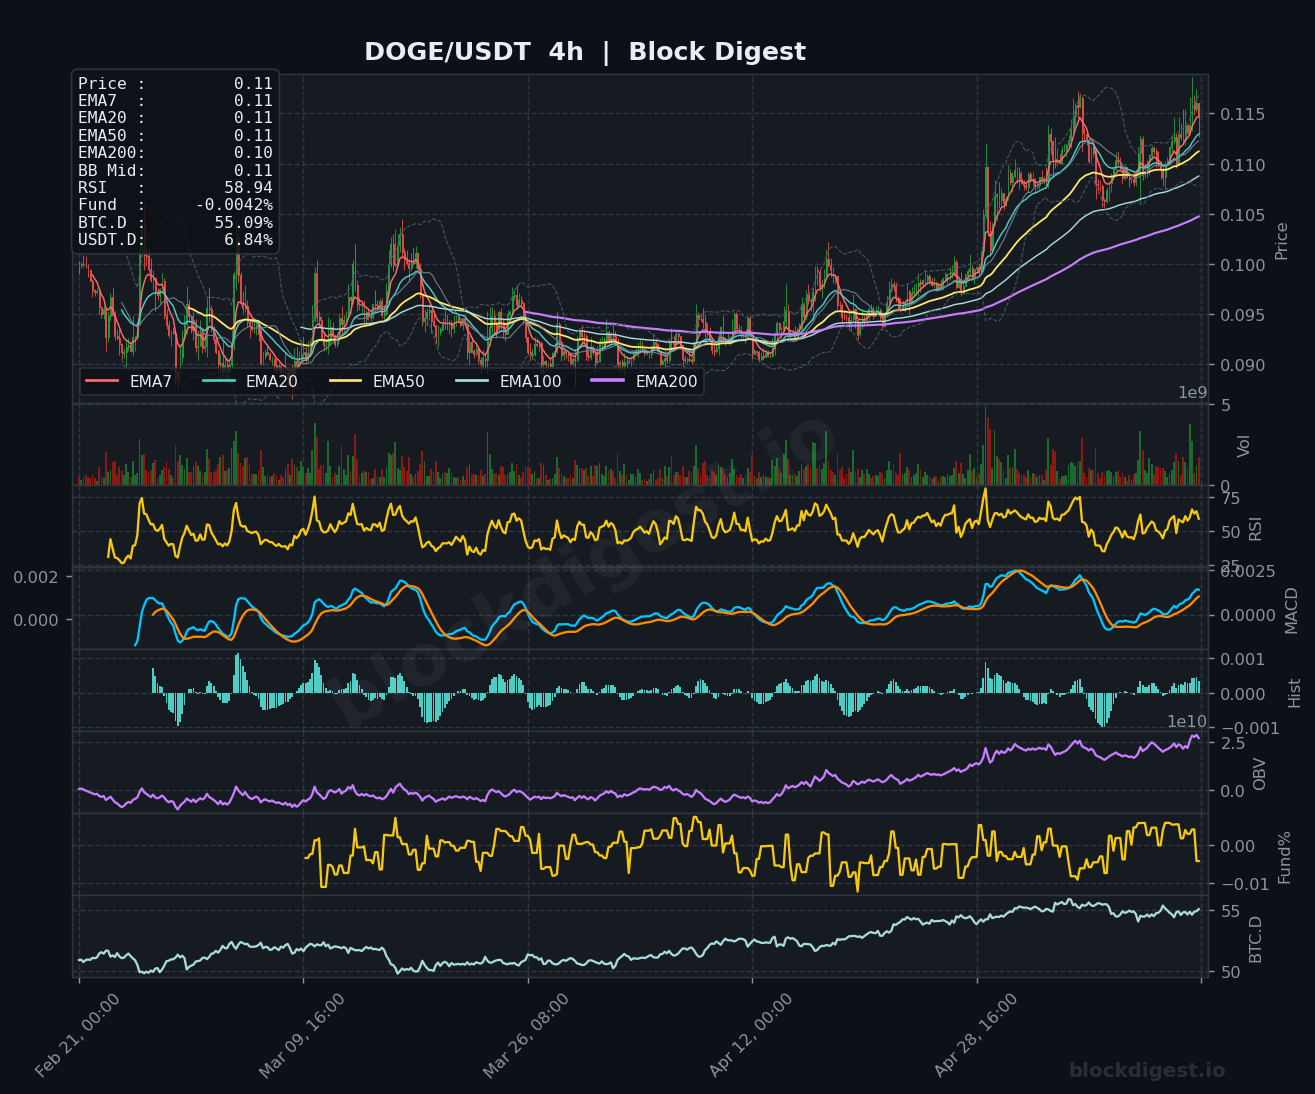
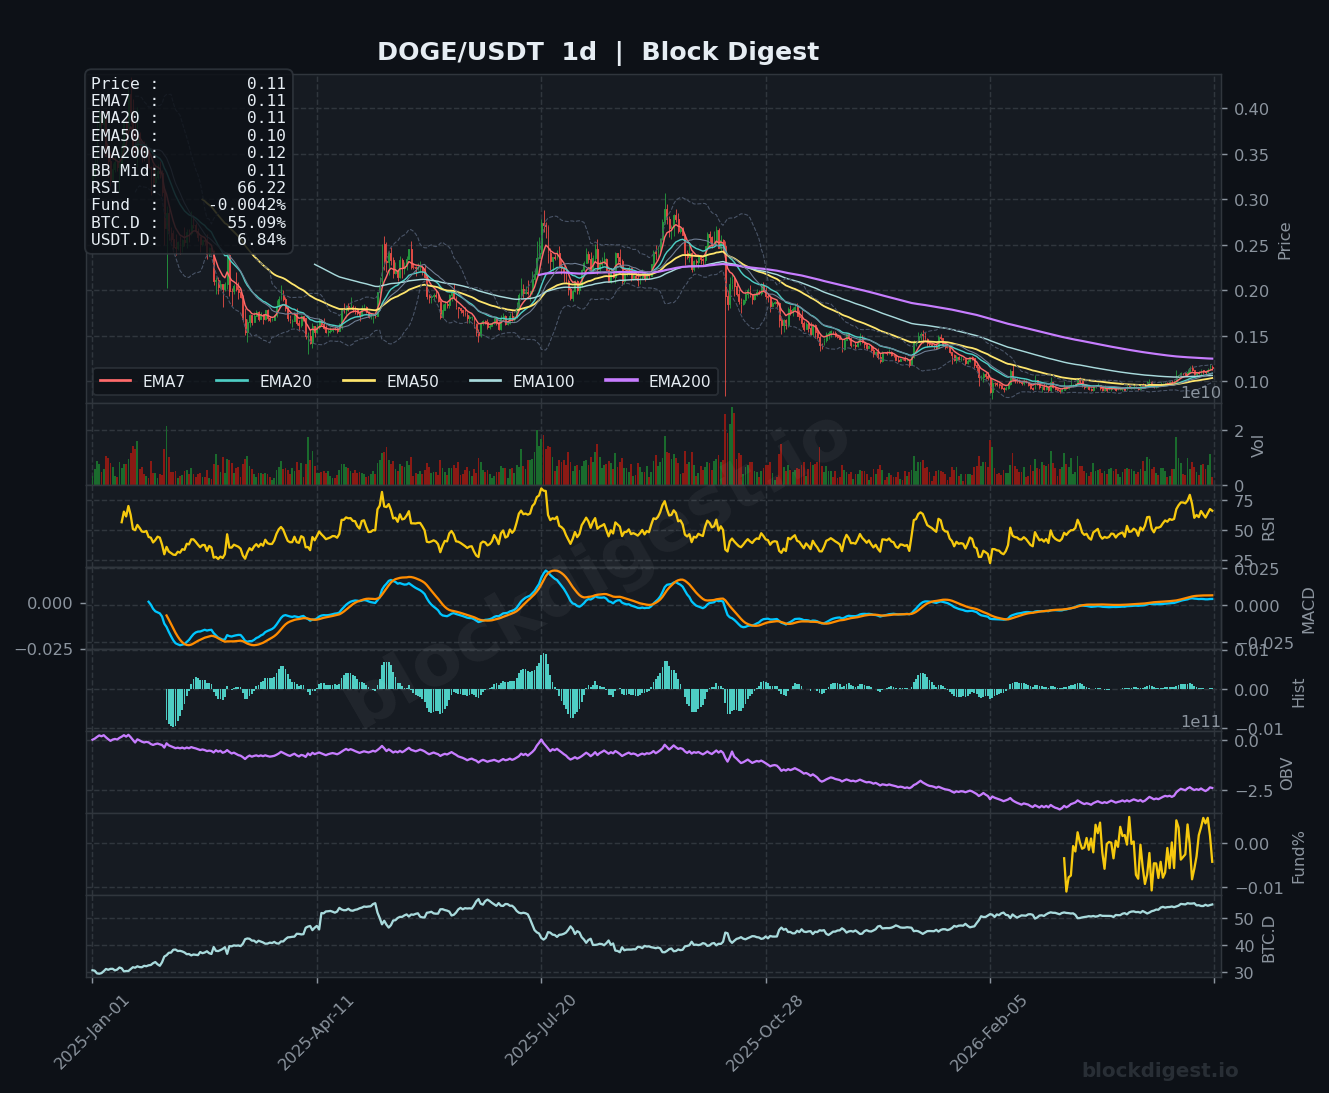
Dogecoin (DOGE)
DOGE is trading at $0.11, confined within a tight consolidation range as price action remains compressed between the $0.105 and $0.118 levels. The meme coin is currently hovering around its major EMAs, with all short-term moving averages converging tightly around $0.11, reflecting market indecision. The RSI at 49.85 suggests neutral momentum, while the MACD shows minimal separation between signal lines, indicating a lack of directional conviction. On the 4-hour chart, DOGE has established a rising channel pattern with higher lows since late March, though price is now testing the upper boundary near $0.115 where it previously faced rejection. The daily timeframe shows DOGE trading below its EMA200 ($0.12) with an elevated RSI of 66.22, suggesting the token has experienced a recent rally but may be facing resistance. The short-term bias is neutral-to-slightly-bearish unless DOGE can break decisively above $0.117, with support expected at $0.108-$0.109.
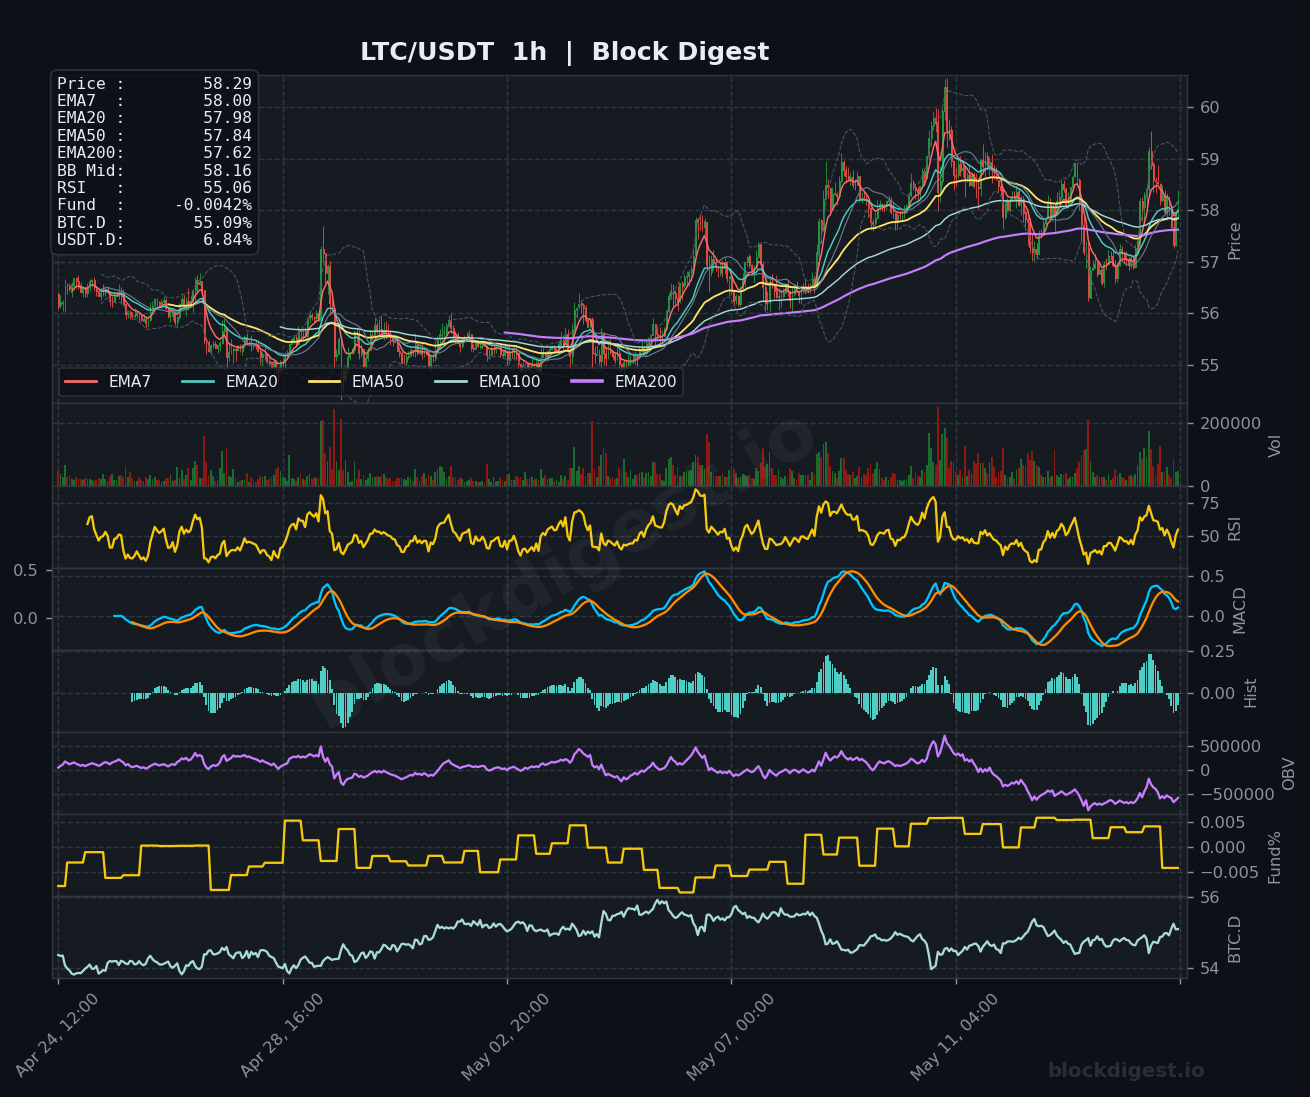
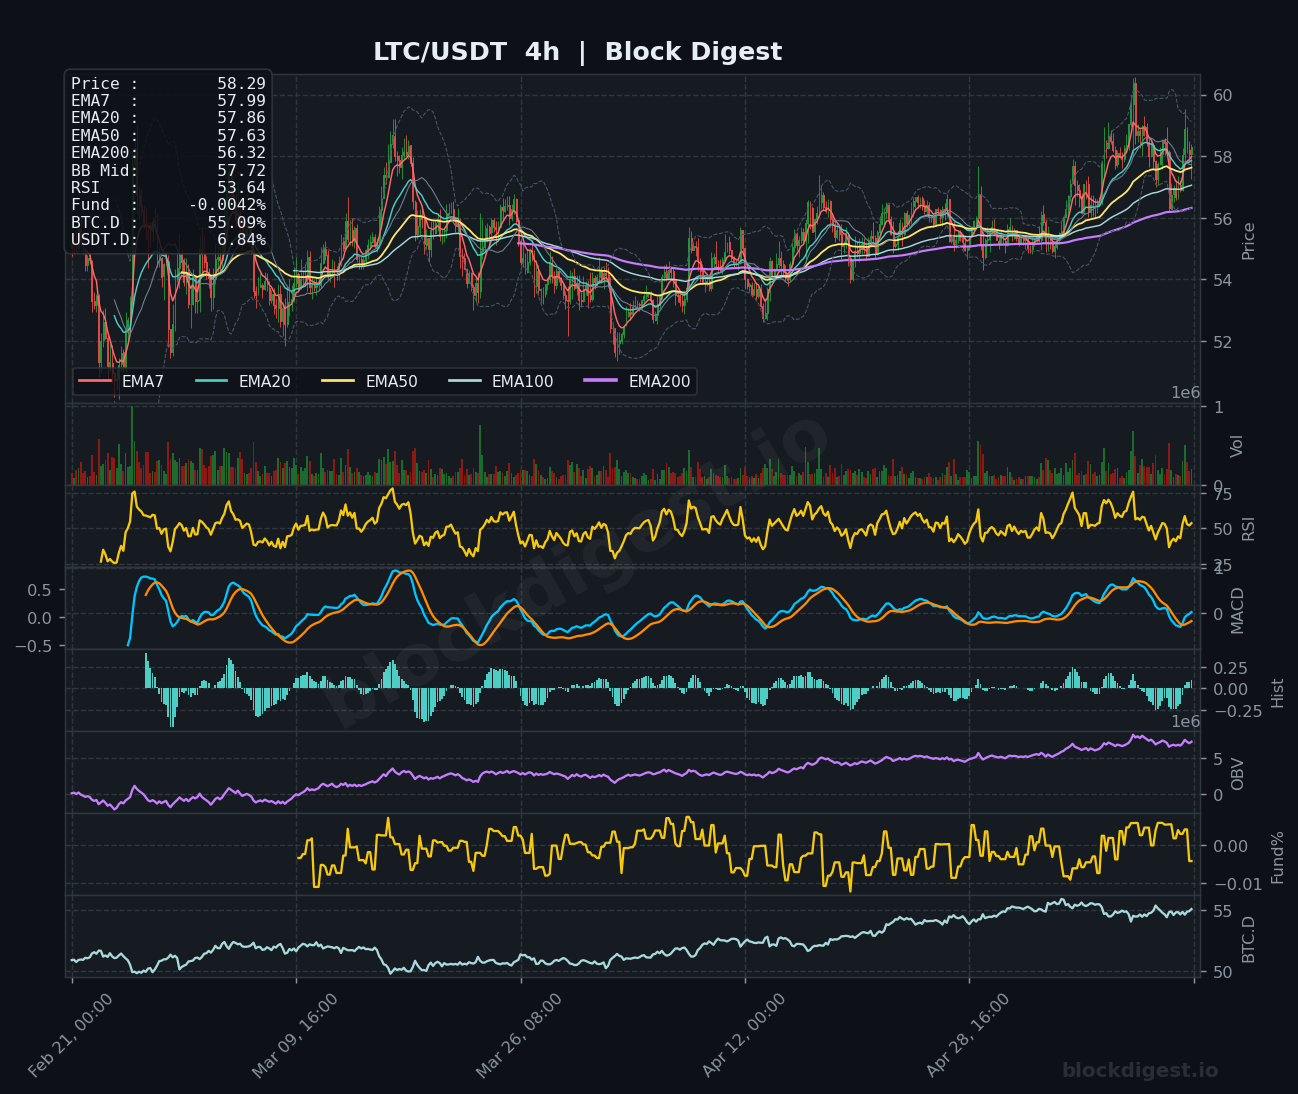
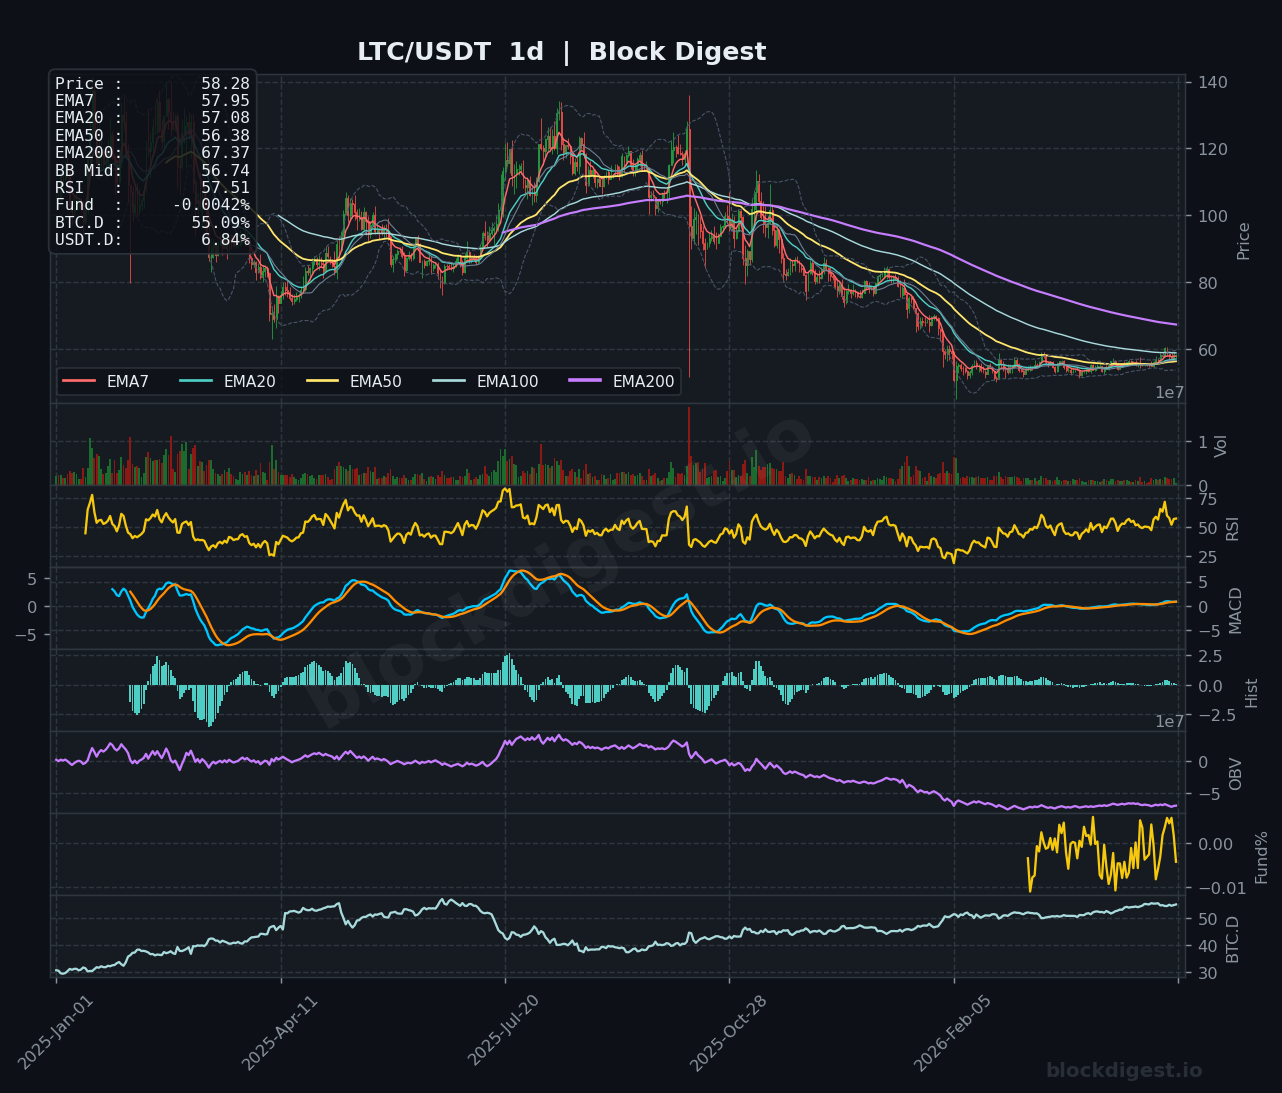
Litecoin (LTC)
LTC is trading at $58.29, demonstrating choppy price action as it oscillates around the $56-$60 range. The token is currently positioned just above its short-term EMAs, with the EMA7 at $58.00 and EMA20 at $57.98 providing immediate support, while the EMA50 at $57.84 reinforces this support zone. The RSI at 55.06 reflects neutral momentum with a slight bullish tilt, though the MACD shows minimal positive histogram values, indicating weak momentum. On the 4-hour timeframe, LTC has been range-bound between $54 and $60 for an extended period, with recent attempts to break higher repeatedly failing at the $60 resistance level. The daily chart reveals LTC trading slightly above its EMA20 ($57.08) but below the EMA50 ($56.38) and well below the descending EMA200 ($67.37), suggesting the longer-term trend remains challenged. The short-term bias is neutral, with traders watching for a breakout above $60 or a breakdown below $57 to establish directional conviction.
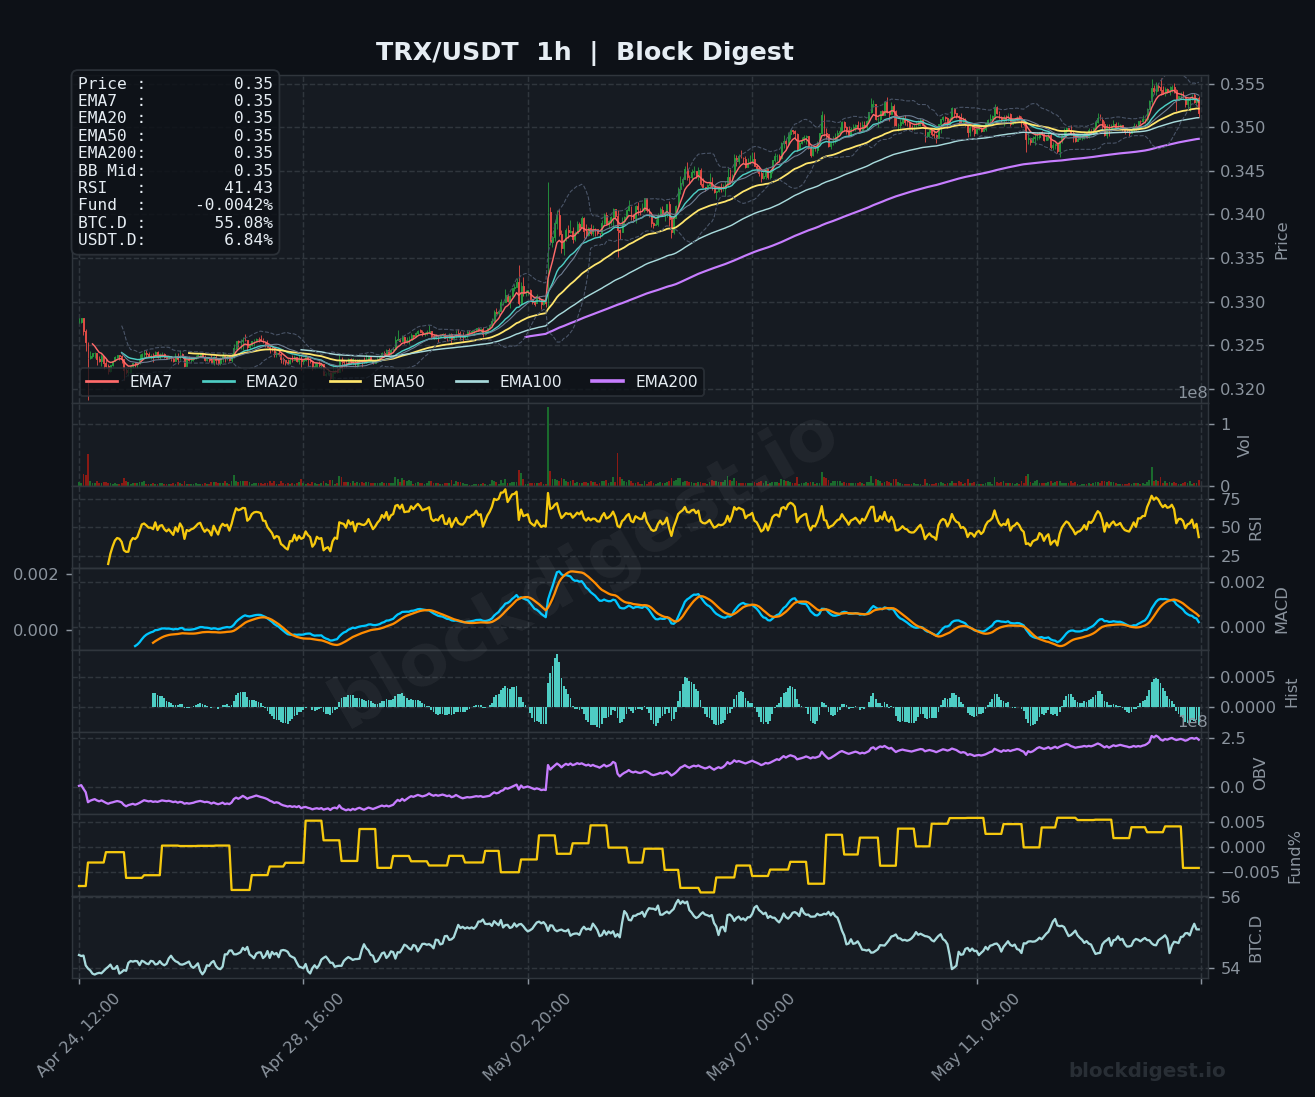
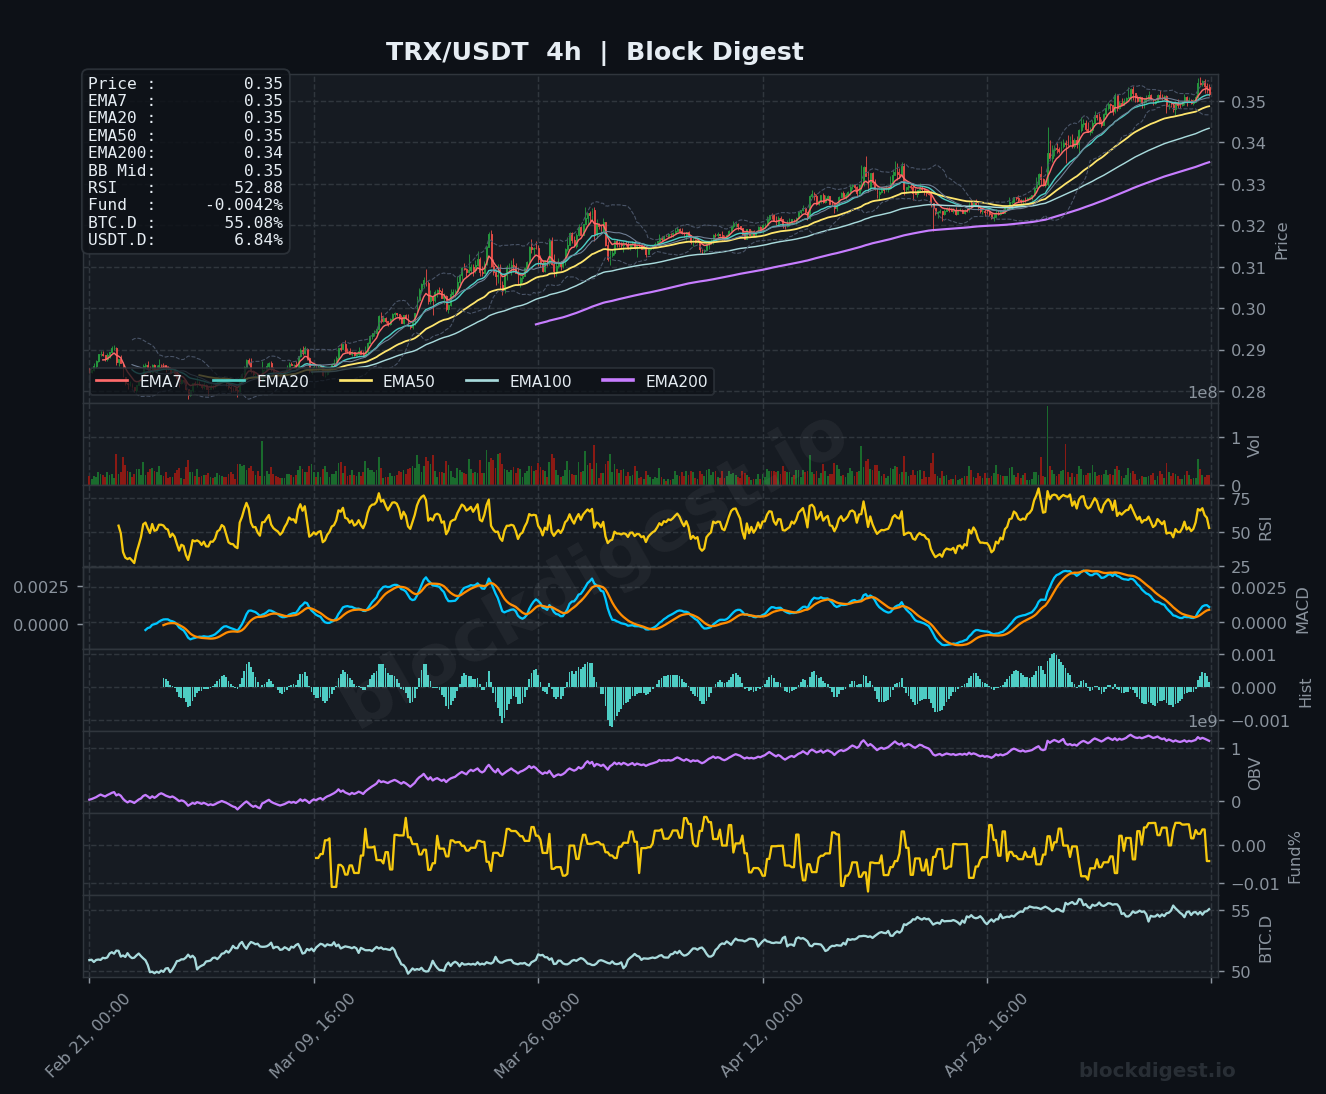
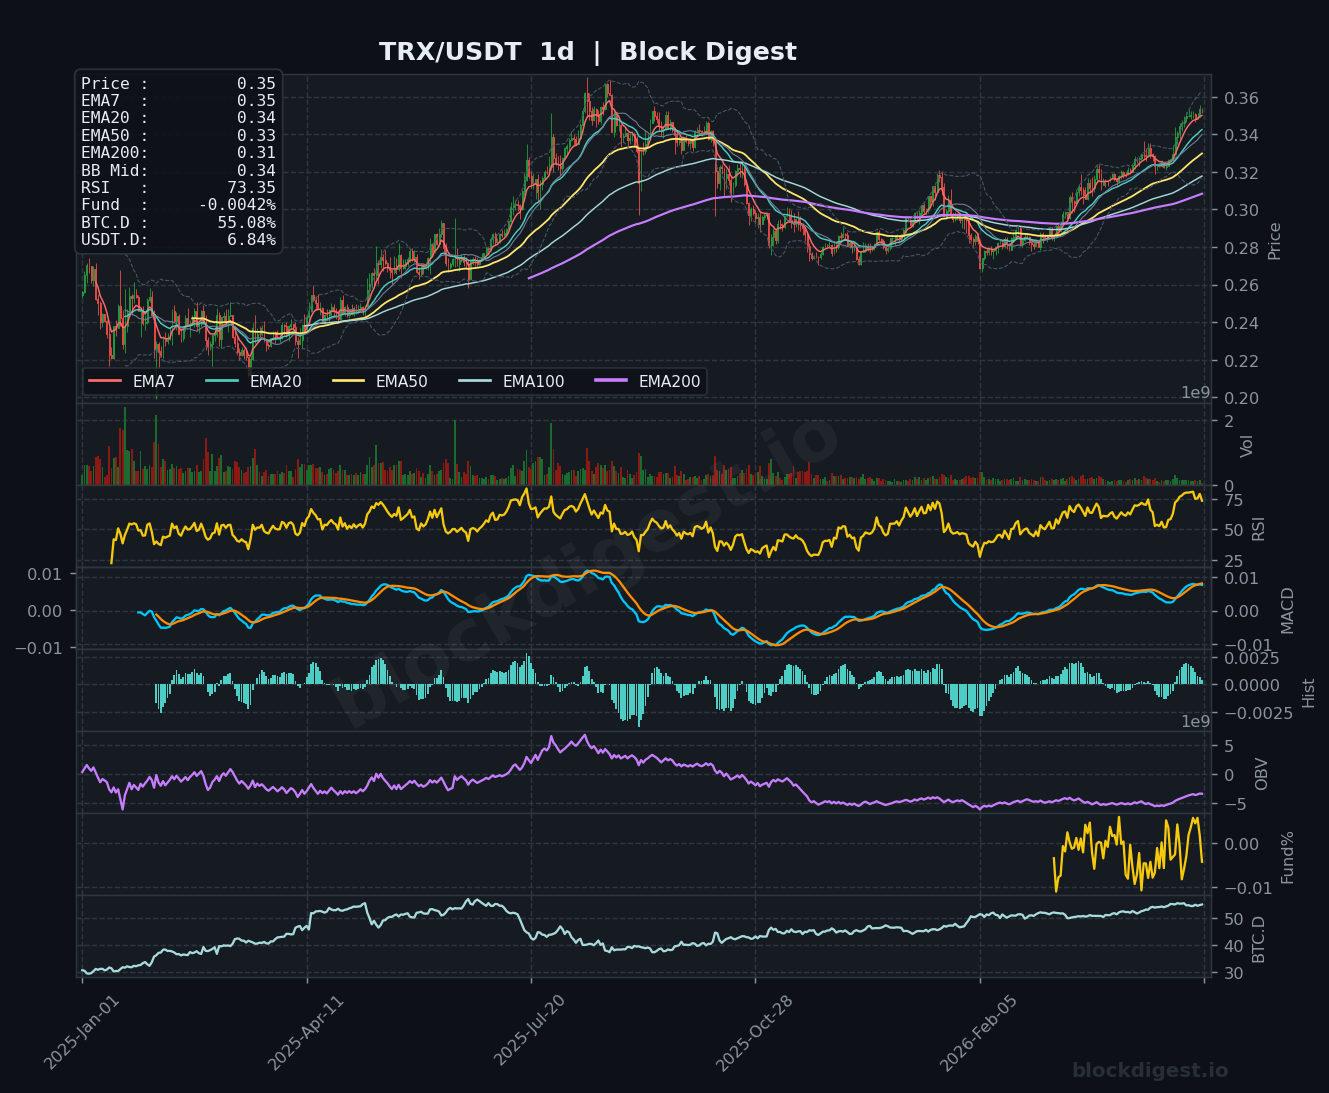
TRON (TRX)
TRX is trading at $0.35, displaying one of the stronger technical setups among major altcoins with price maintaining a steady uptrend above all major moving averages. The token is trading well above its EMA7 ($0.35), EMA20 ($0.35), and EMA50 ($0.35), with all shorter-term averages aligned bullishly. The RSI at 41.43 on the 1-hour chart appears depressed following a minor pullback, but the 4-hour RSI at 52.88 and the daily RSI at 73.35 confirm underlying strength in the trend. The MACD on the 4-hour chart remains constructive with positive histogram readings, while the daily MACD shows strong upward momentum continuation. On the daily timeframe, TRX has established a clear higher-high, higher-low pattern with price recently testing $0.36 before consolidating around $0.35. The short-term bias remains bullish with support at $0.345 and potential to test $0.36-$0.365 if buying pressure continues, though the elevated daily RSI suggests some caution for overextension.
Altcoin Outlook
The altcoin market is displaying divergent strength across major tokens, with TRON and BNB showing the most constructive technical setups supported by bullish trend structures and momentum indicators. XRP is benefiting from regulatory tailwinds and breaking to the upside, positioning it favorably for continued gains if broader market conditions remain supportive. Conversely, SOL and DOGE face more challenging near-term setups with bearish momentum and key support tests underway, while LTC remains trapped in a prolonged consolidation phase requiring a decisive breakout for directional clarity. The moderate USDT dominance and Bitcoin dominance levels suggest the altcoin market has room to perform, particularly if BTC can maintain stability above key support zones and risk appetite improves on positive fundamental developments like regulatory clarity progress.
Disclaimer: This analysis is for informational purposes only and does not constitute financial advice. Cryptocurrency markets are highly volatile and unpredictable. All trading decisions should be made based on your own research and risk tolerance. Block Digest is not responsible for any financial losses incurred as a result of acting on this content.