Altcoin Daily Analysis: Bitcoin Dominance 55.96% Signals Capital Rotation
Market Context
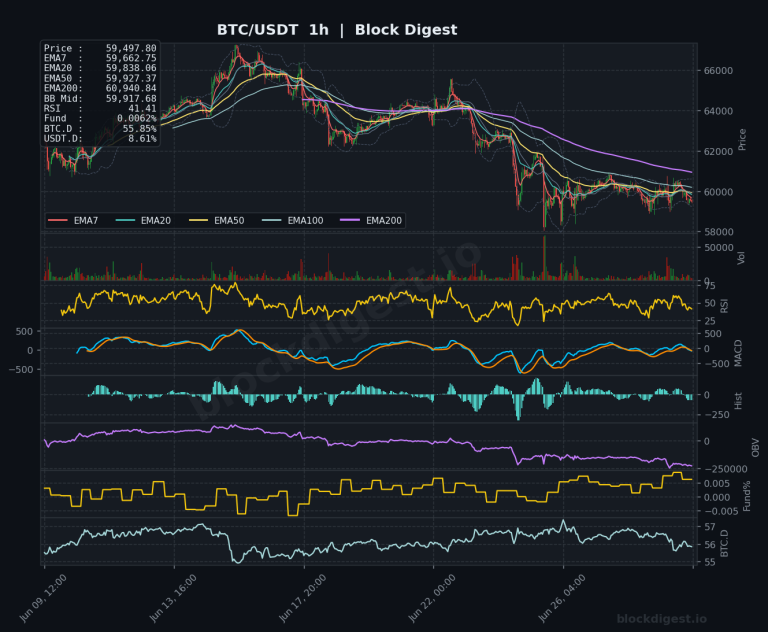
The altcoin market is navigating a notably risk-off environment as of June 10, 2026, with Bitcoin dominance holding at 55.96% — a level that historically compresses altcoin performance and signals continued capital rotation toward BTC. USDT dominance at 8.49% remains elevated, indicating that a meaningful portion of market participants are sitting in stablecoins rather than deploying into risk assets. Across all six assets reviewed today, the structural trend is uniformly bearish on the daily timeframe, with most charts printing price well below all major EMAs and OBV confirming sustained distribution.
Solana (SOL)
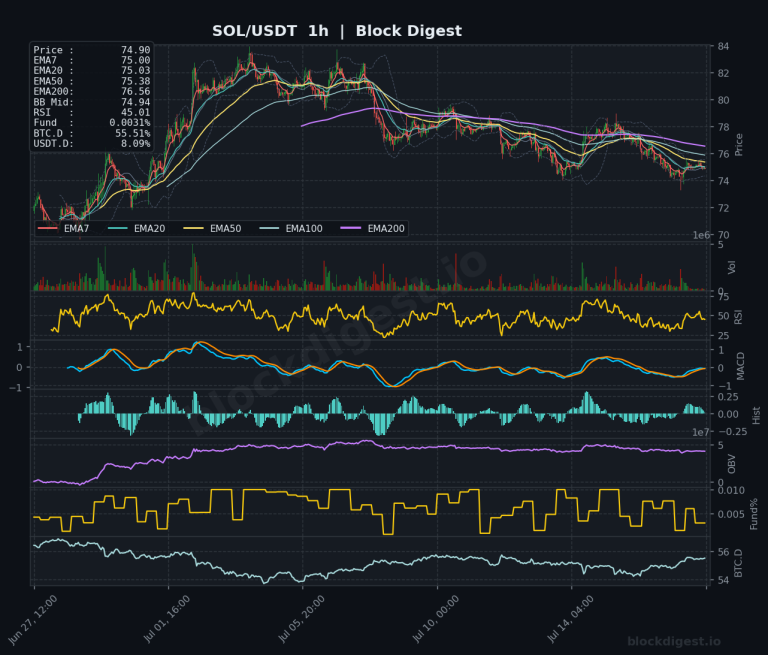
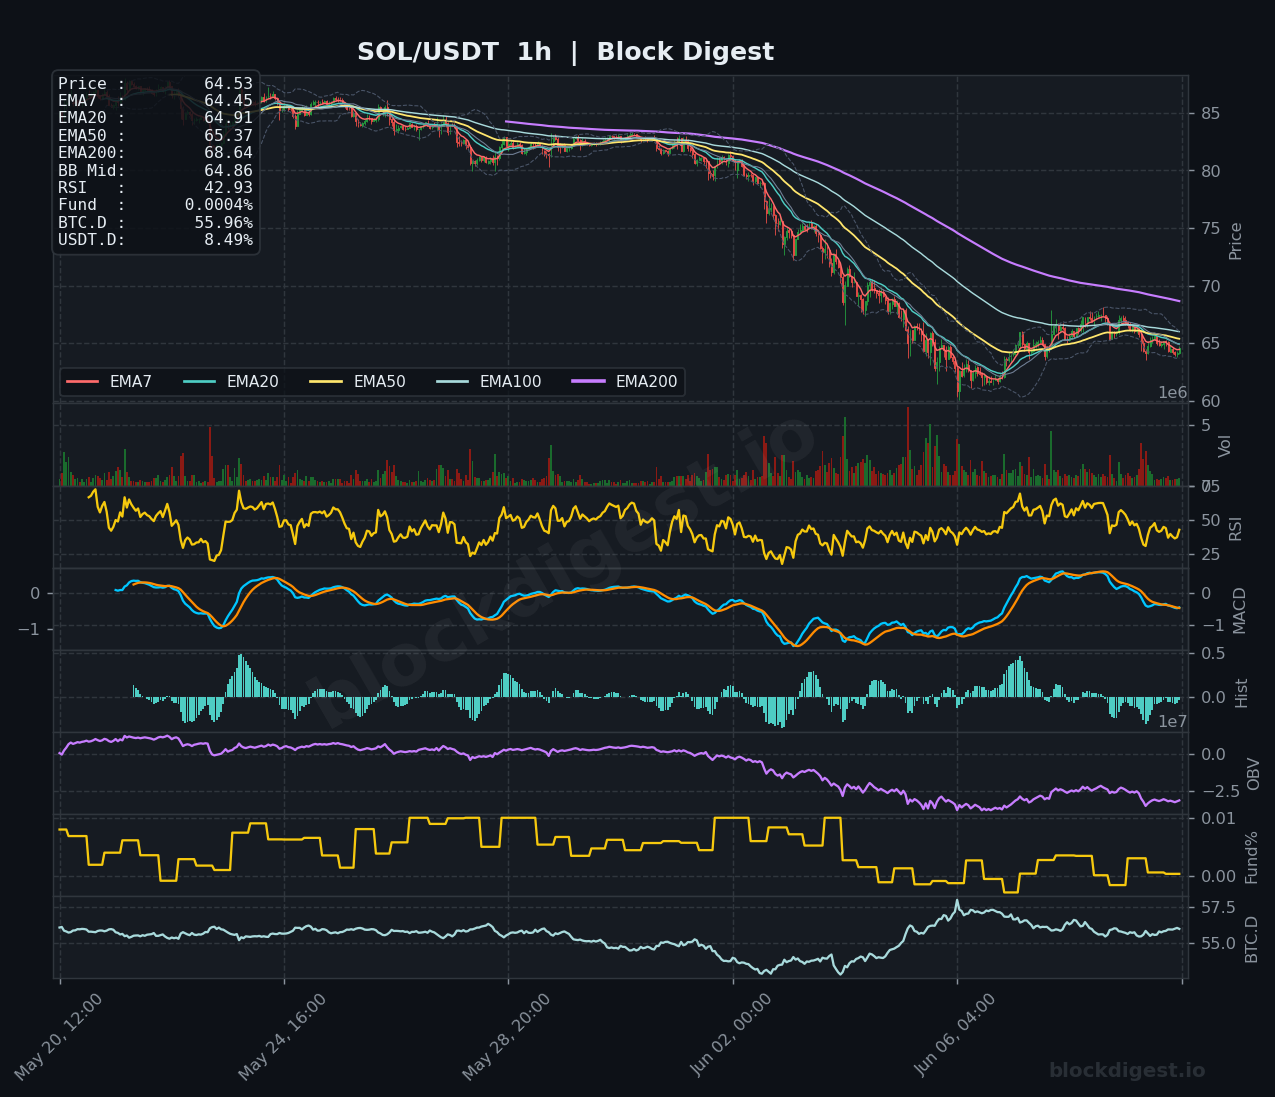
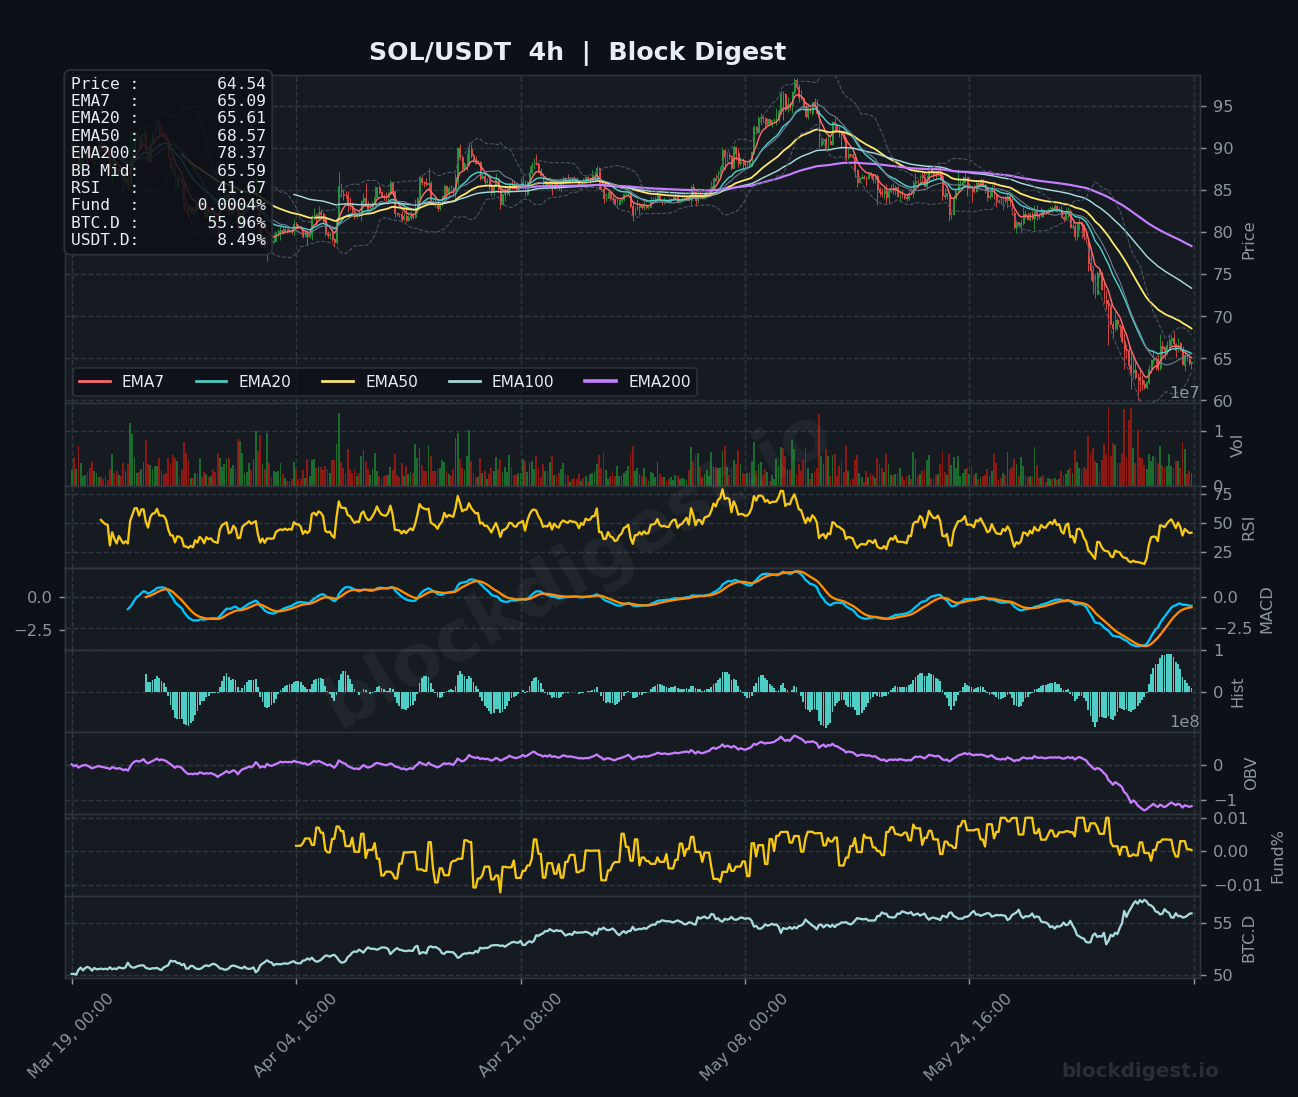
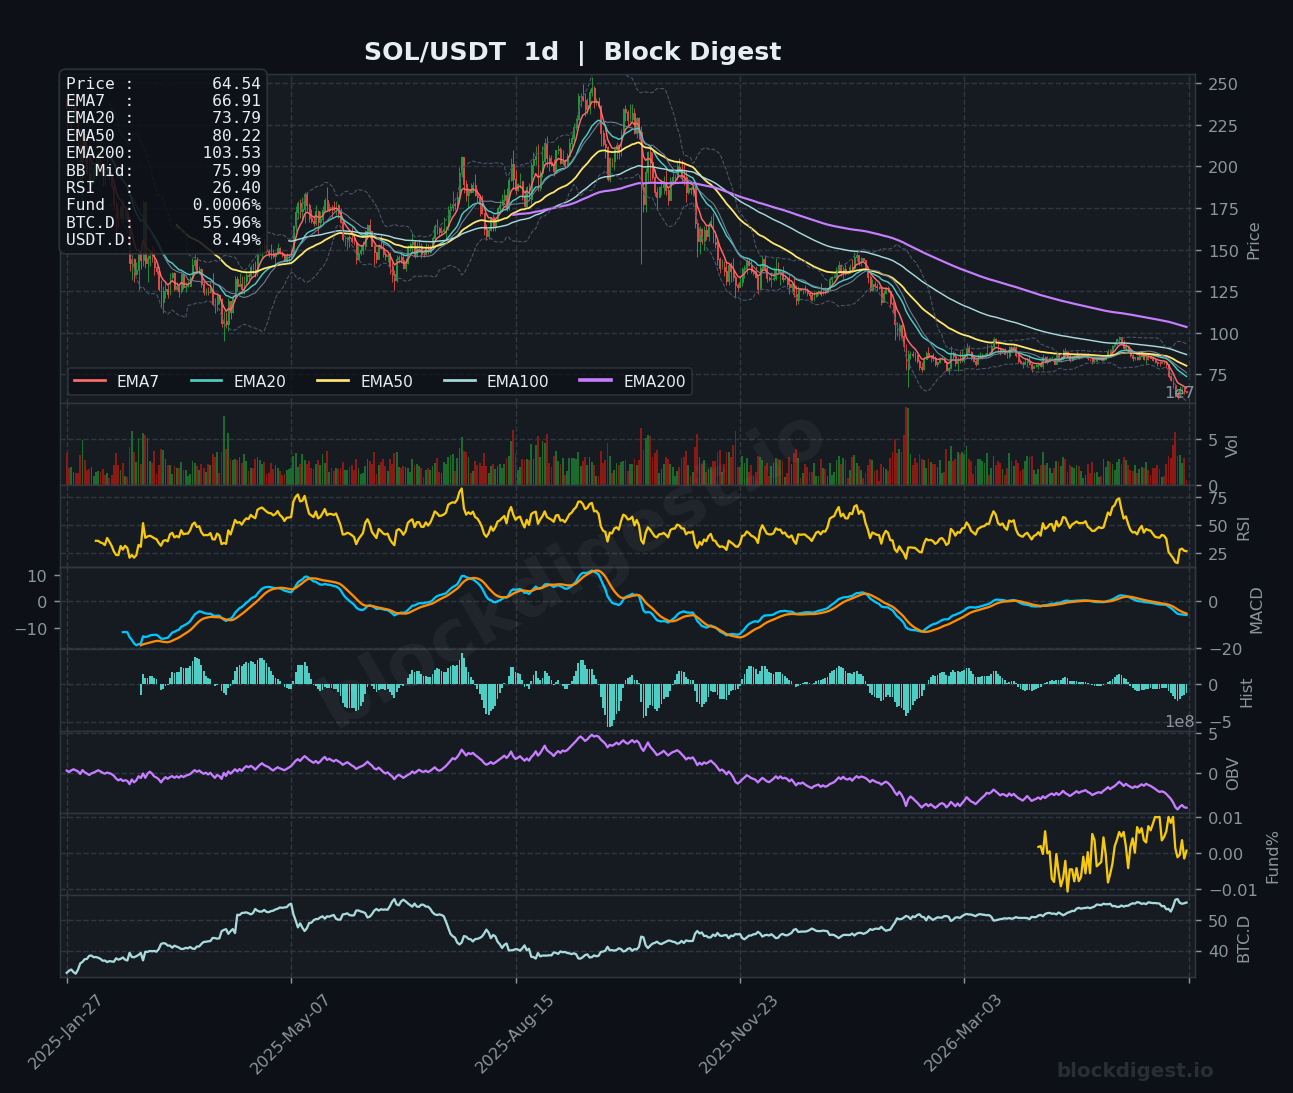
SOL is currently trading at $64.54, caught beneath a steeply bearish EMA stack on both the 4h and daily charts — with the EMA200 on the daily sitting far above at $103.53, underscoring the severity of the multi-month decline from highs above $200. The daily RSI has collapsed to 26.40, placing SOL in oversold territory, though the MACD remains bearish with no confirmed crossover signal in sight. On the 1h chart, RSI sits at 42.93 with a slight stabilization in price near the $64 area, but all short-term EMAs (EMA7 at $64.45, EMA50 at $65.37) continue to act as overhead resistance. The short-term bias remains bearish-to-neutral; any relief bounce toward $67–$68 would likely face significant selling pressure from the converging EMA cluster above.
XRP (XRP)
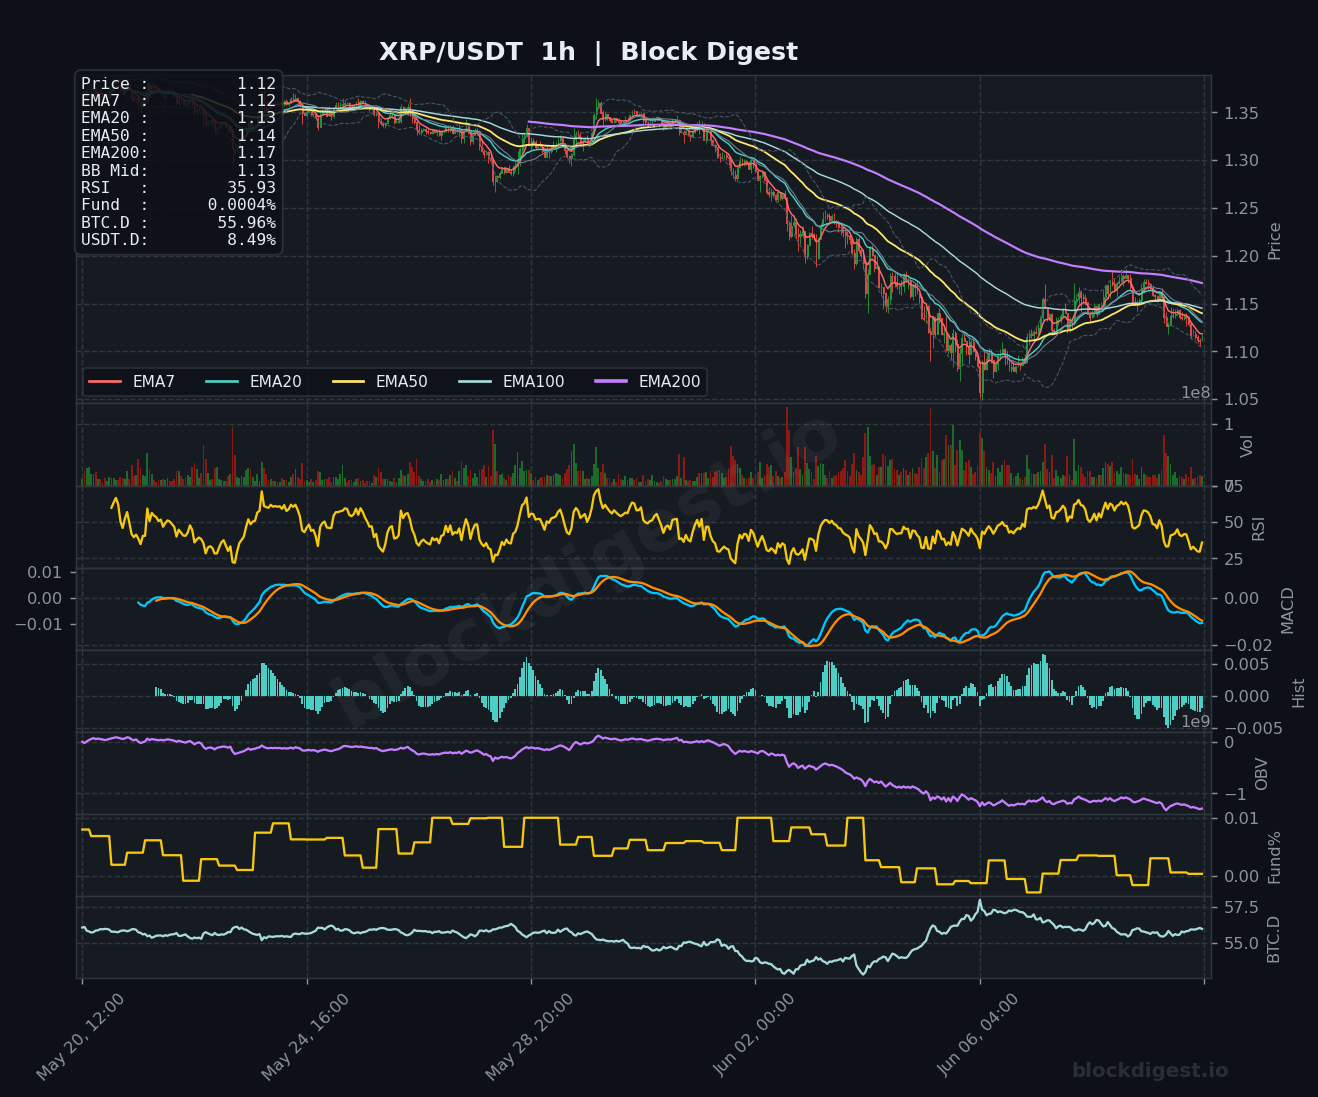
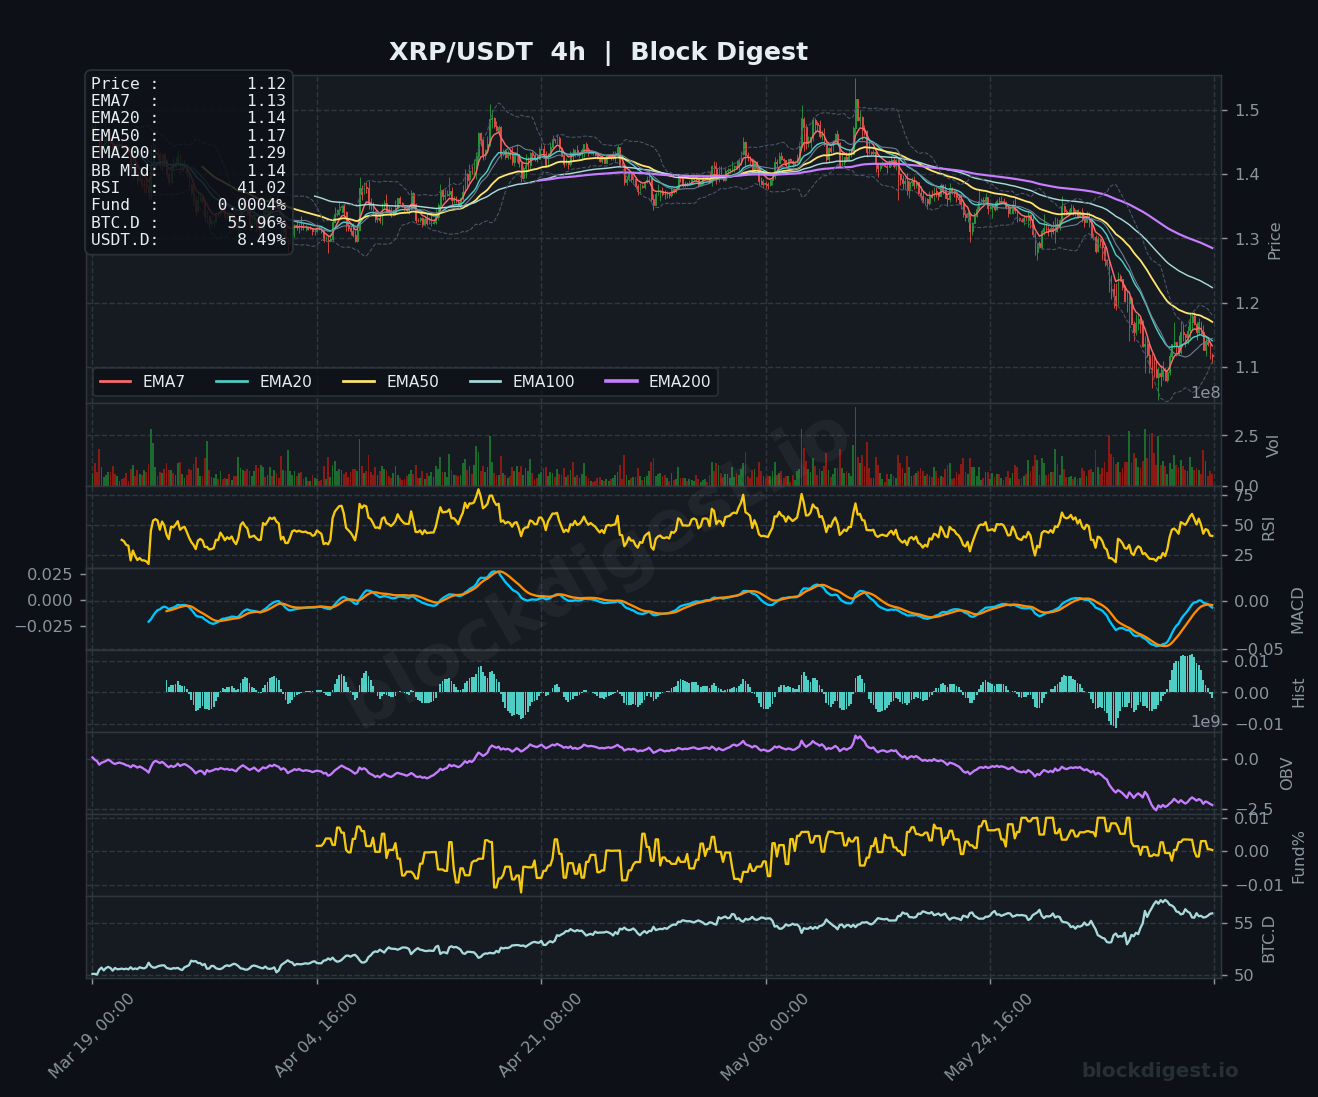
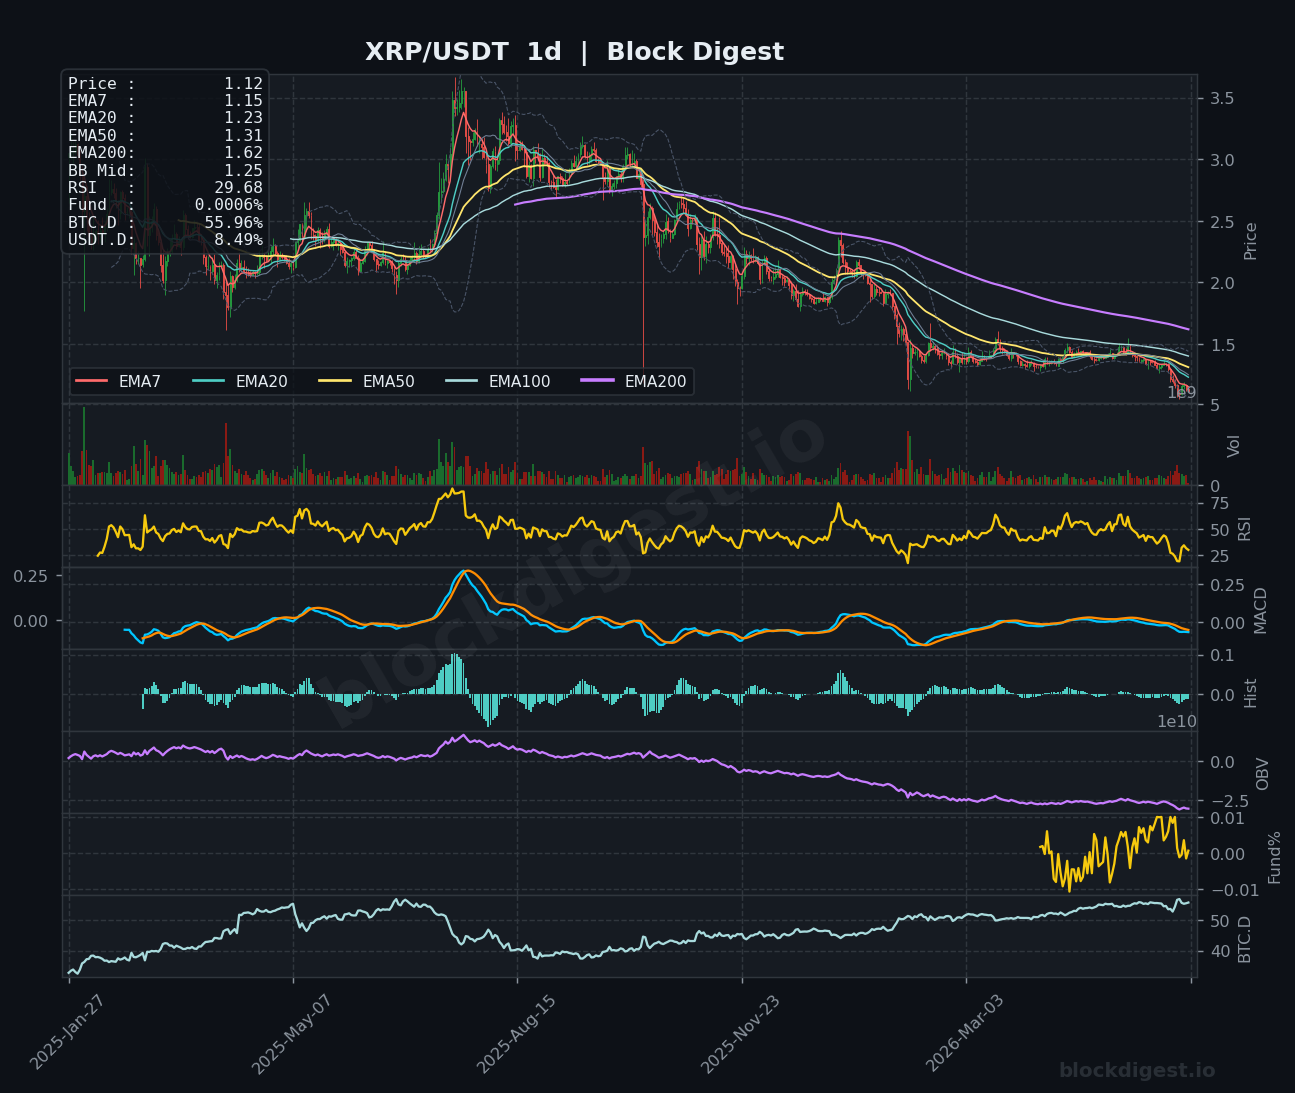
XRP is trading at $1.12, having shed substantial ground from its earlier highs near $1.50, with price now trading below all key EMAs on the 4h and daily timeframes. The daily RSI reading of 29.68 signals that XRP is approaching oversold conditions, while the daily MACD remains in negative territory with no bullish divergence yet confirmed. On the 1h chart, RSI is at 35.93 and the MACD is flattening near zero — a tentative sign that selling momentum is slowing — but OBV continues to trend lower, reflecting persistent net selling. Immediate resistance sits at $1.13–$1.14 (EMA7/EMA20 on 1h), and a reclaim of $1.17 (EMA50) would be necessary to shift the short-term bias to neutral; downside risk extends toward the $1.05–$1.08 support zone.
BNB (BNB)
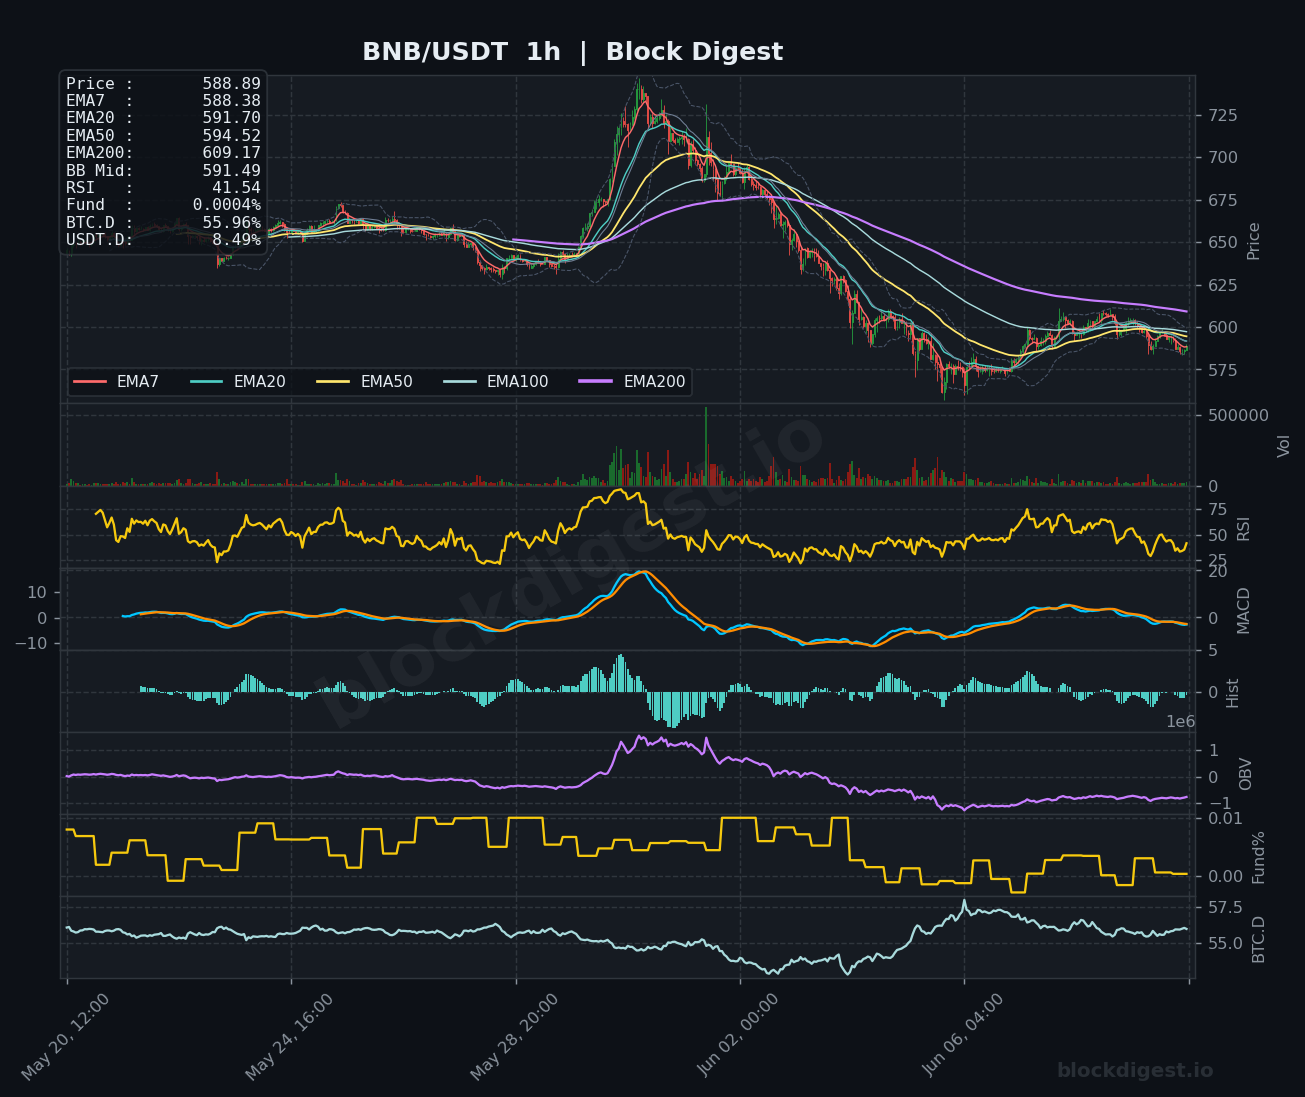
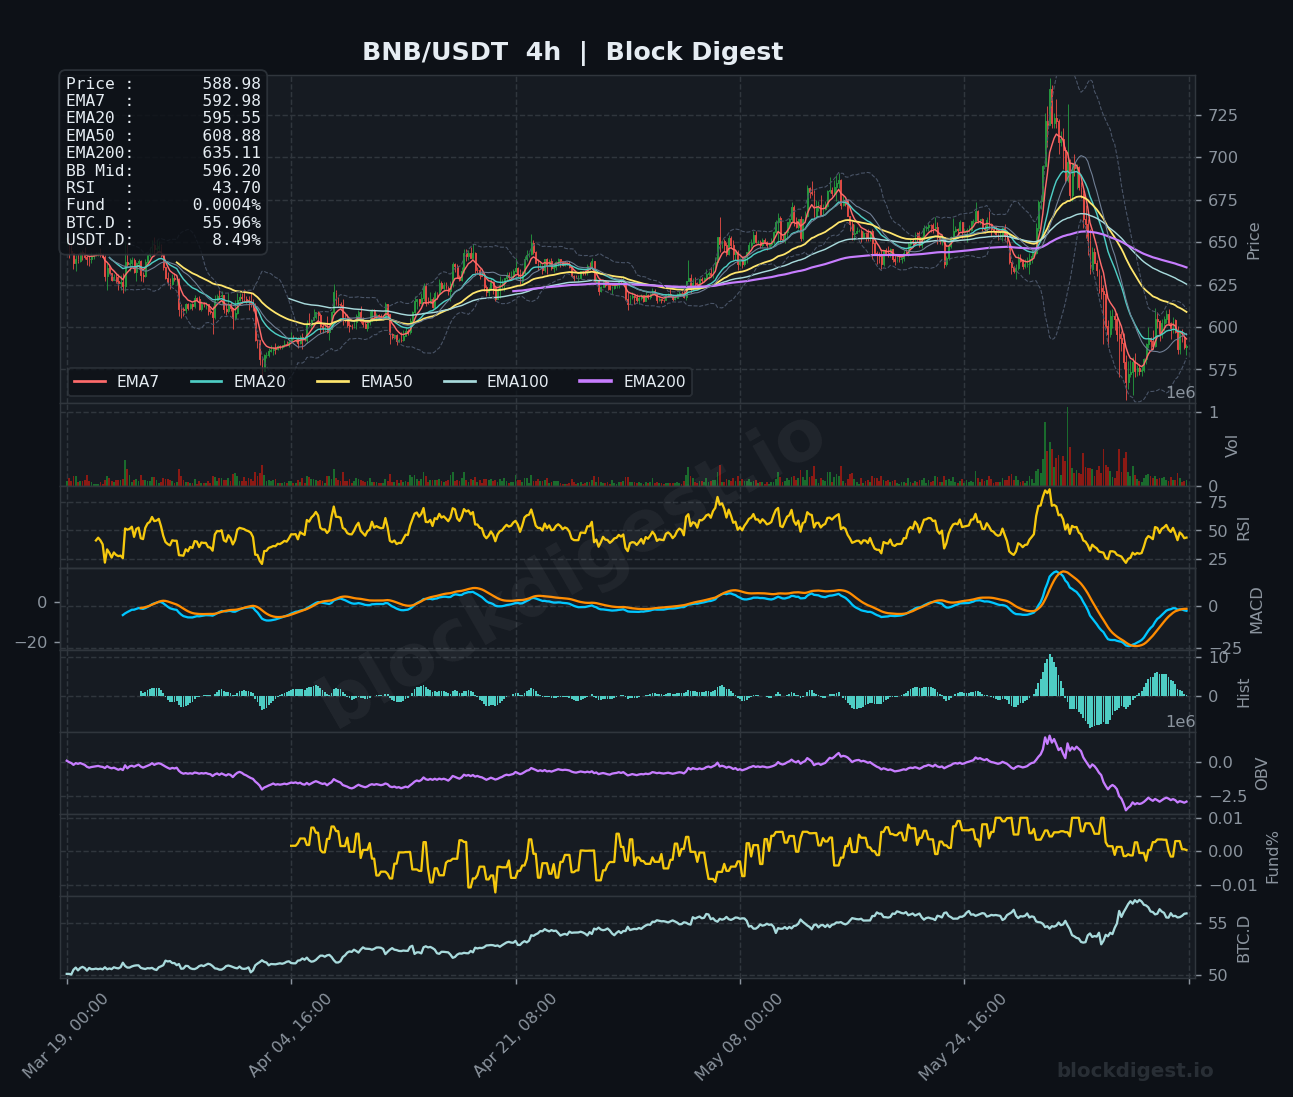
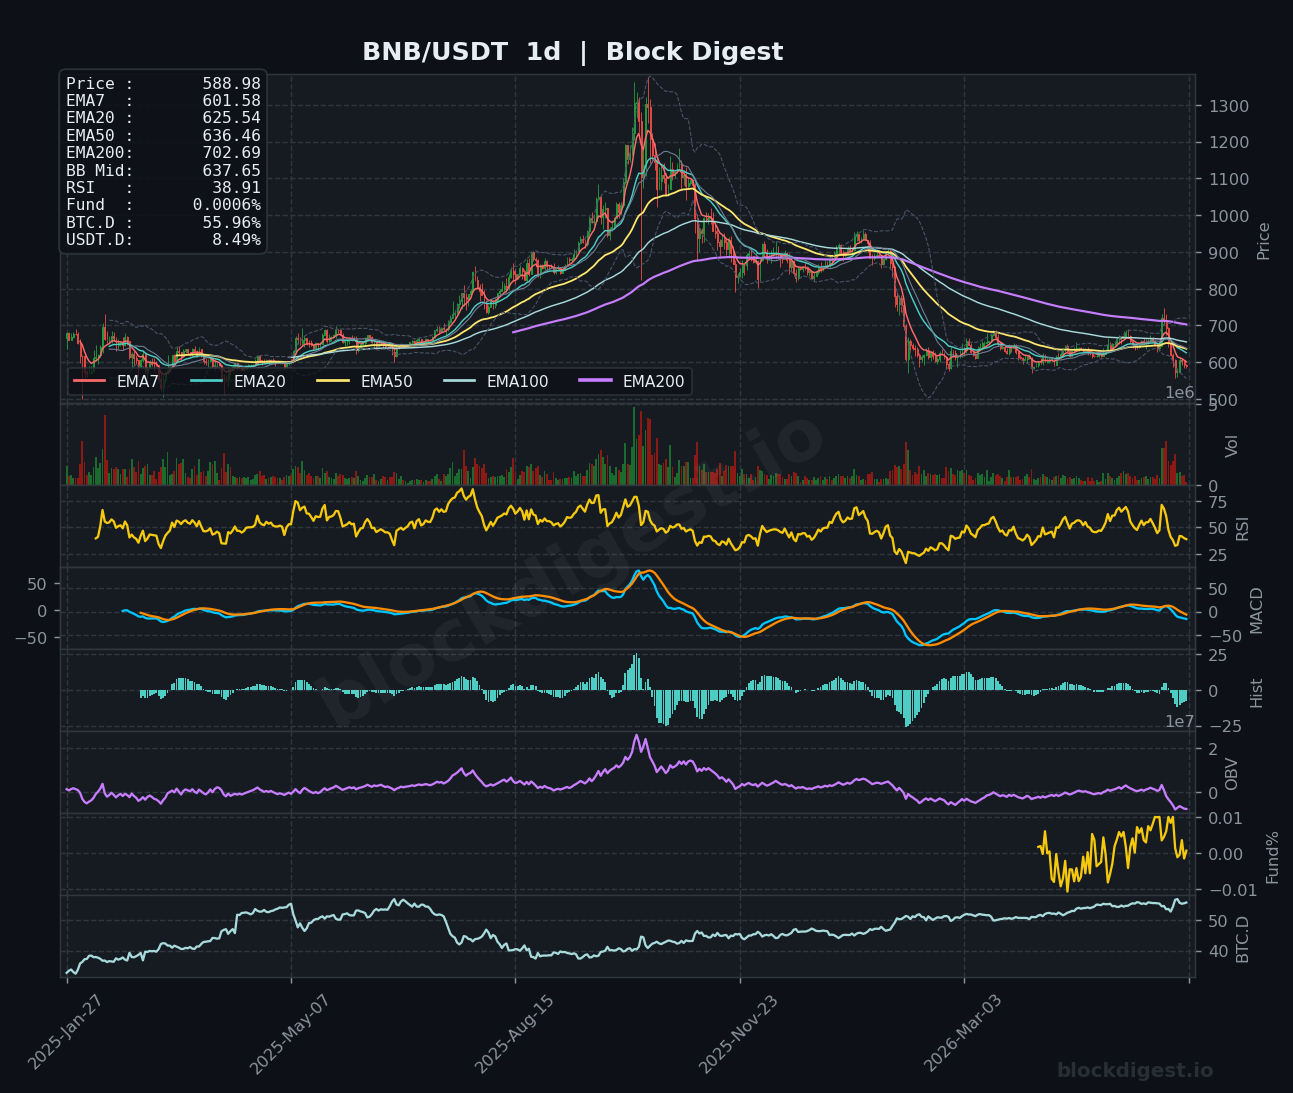
BNB is trading at $588.89 after a sharp decline from highs near $725, with price currently holding just below the $591–$595 EMA cluster on the 1h chart. The 4h RSI reads 43.70 and the MACD is attempting a minor bullish curl from deep negative levels, suggesting a potential short-term stabilization, though the histogram remains in negative territory. On the daily chart, RSI at 38.91 and a bearish MACD configuration confirm that the dominant trend is still to the downside, with the daily EMA200 at $702.69 representing a distant structural target. BNB holds relative strength compared to SOL and XRP in terms of percentage drawdown from recent highs, but a sustained recovery above $610 (EMA50 on 4h) would be required to develop a more constructive near-term narrative.
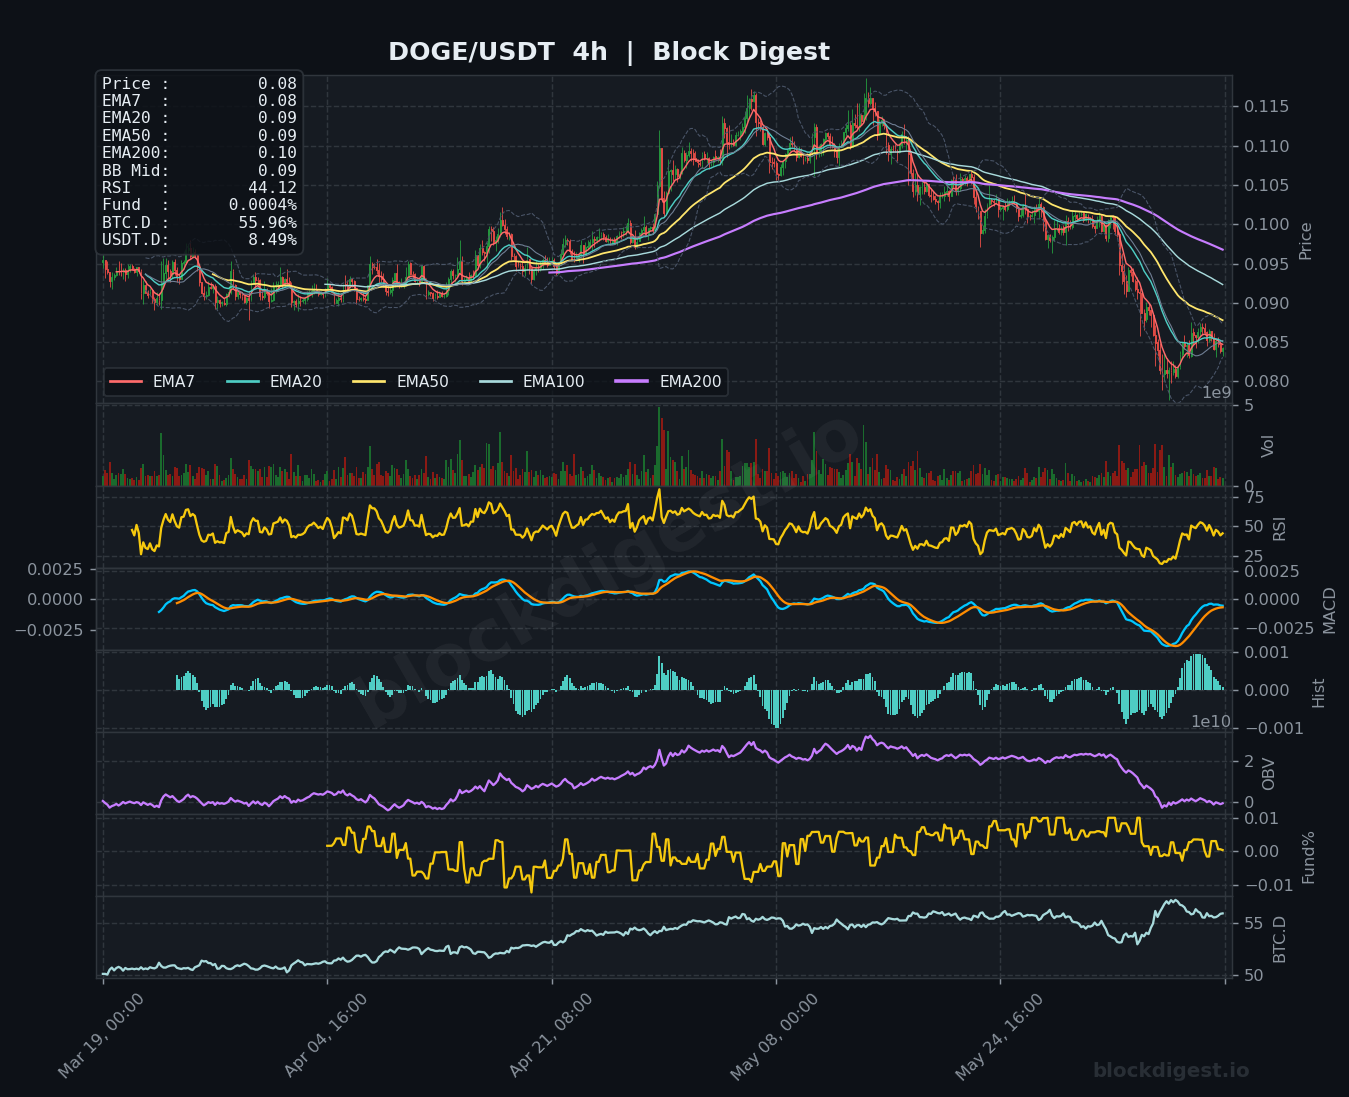
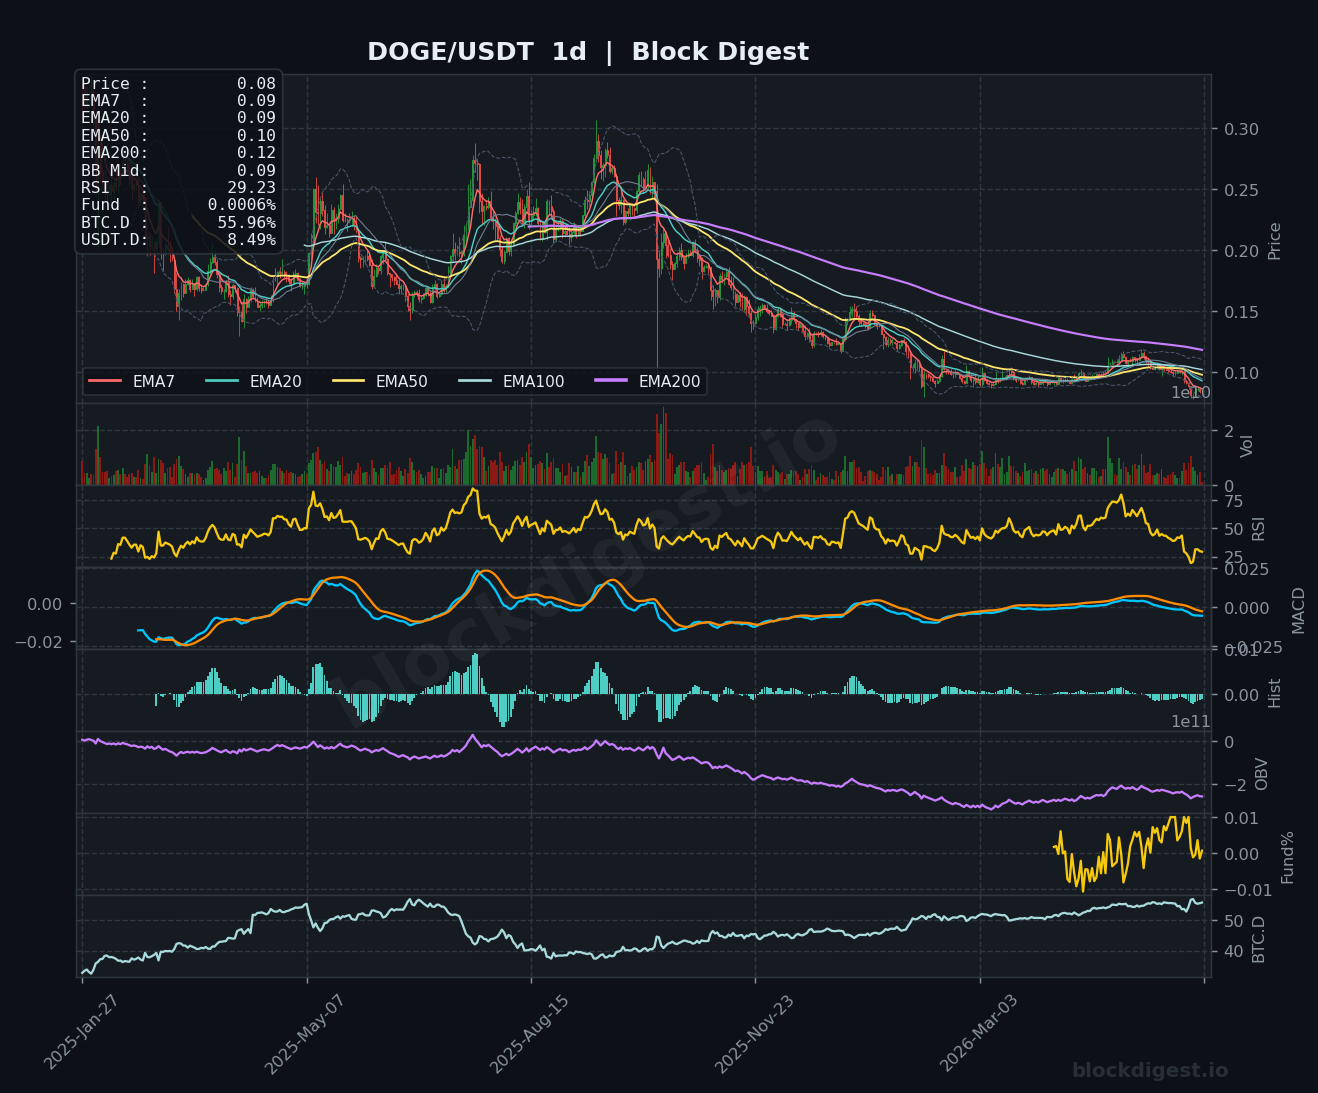
Dogecoin (DOGE)
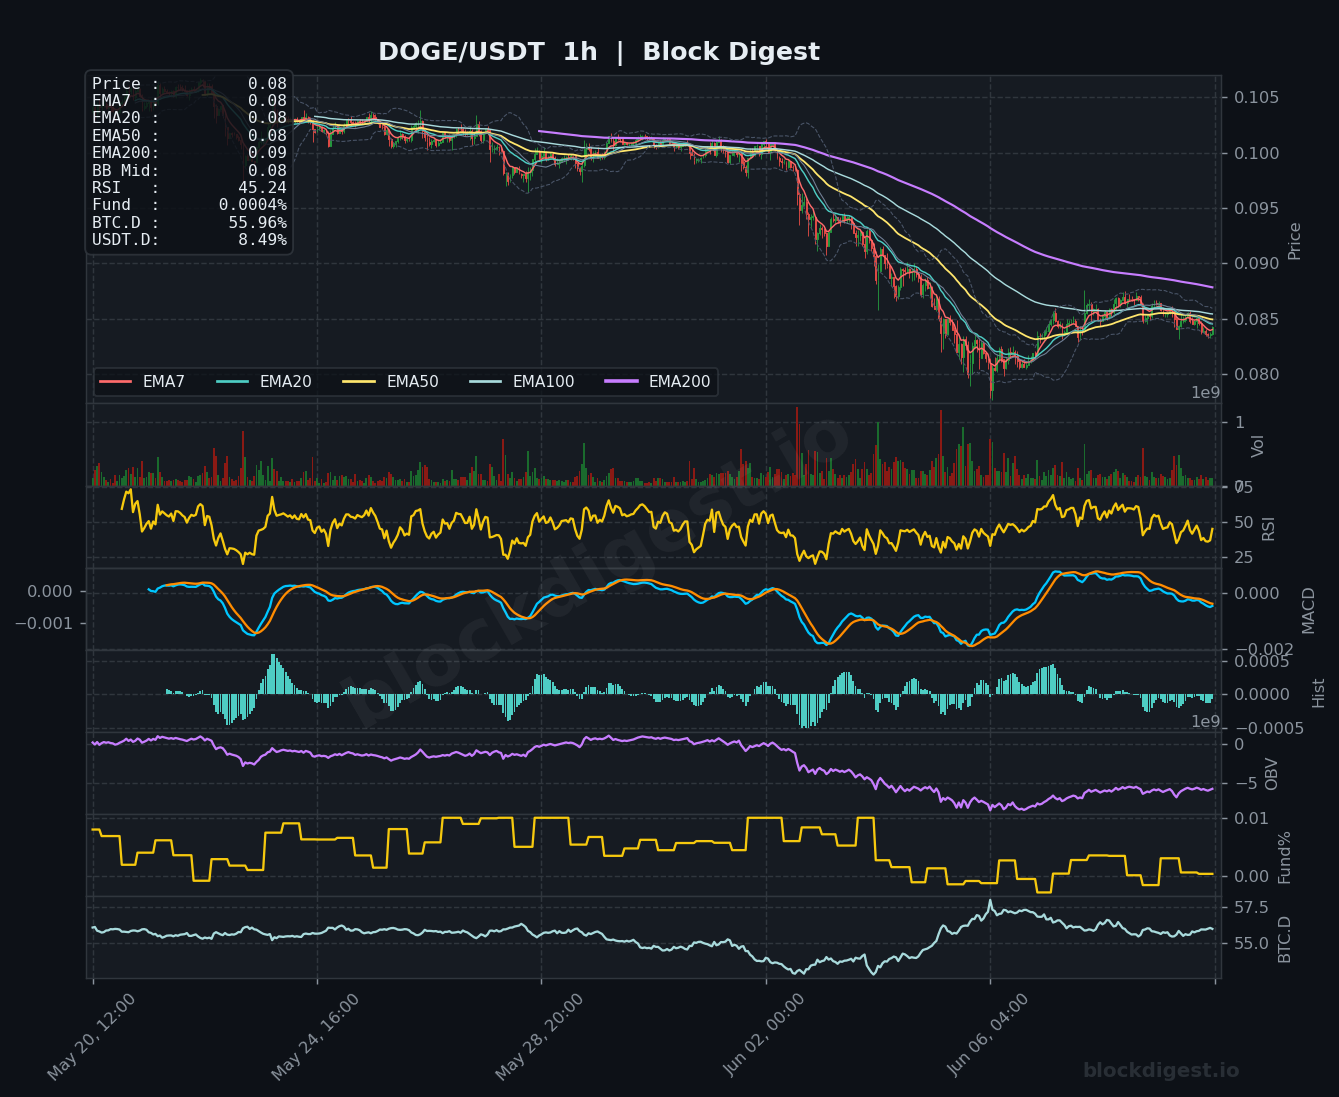
DOGE is trading at $0.0800, having declined from highs above $0.115 and now testing multi-month lows beneath all EMAs on the daily chart. The daily RSI at 29.23 places DOGE firmly in oversold territory alongside its peers, while the daily MACD remains bearish with flattening histogram bars — a potential early sign of deceleration in sell-side momentum. On the 4h chart, RSI at 44.12 and a MACD that is attempting to recover from deeply negative levels suggest a minor consolidation could be developing in the $0.080–$0.085 range. Near-term resistance stands at $0.085 (EMA20 on 4h), and a clean break above $0.090 would be needed to establish any credible recovery case; the bias remains bearish-to-neutral in the short term.
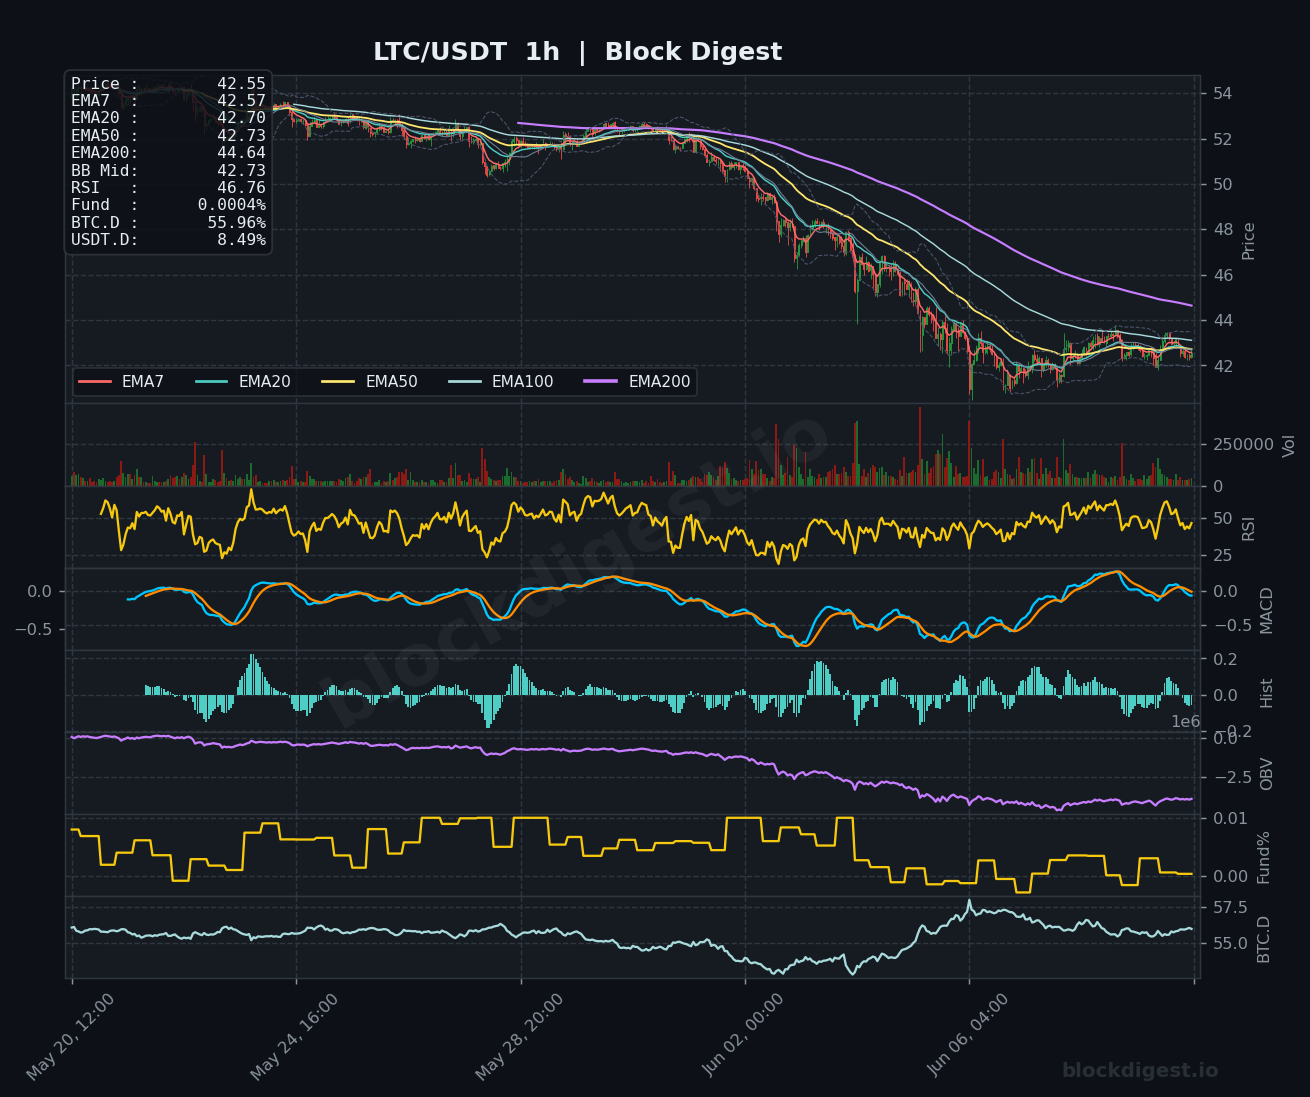
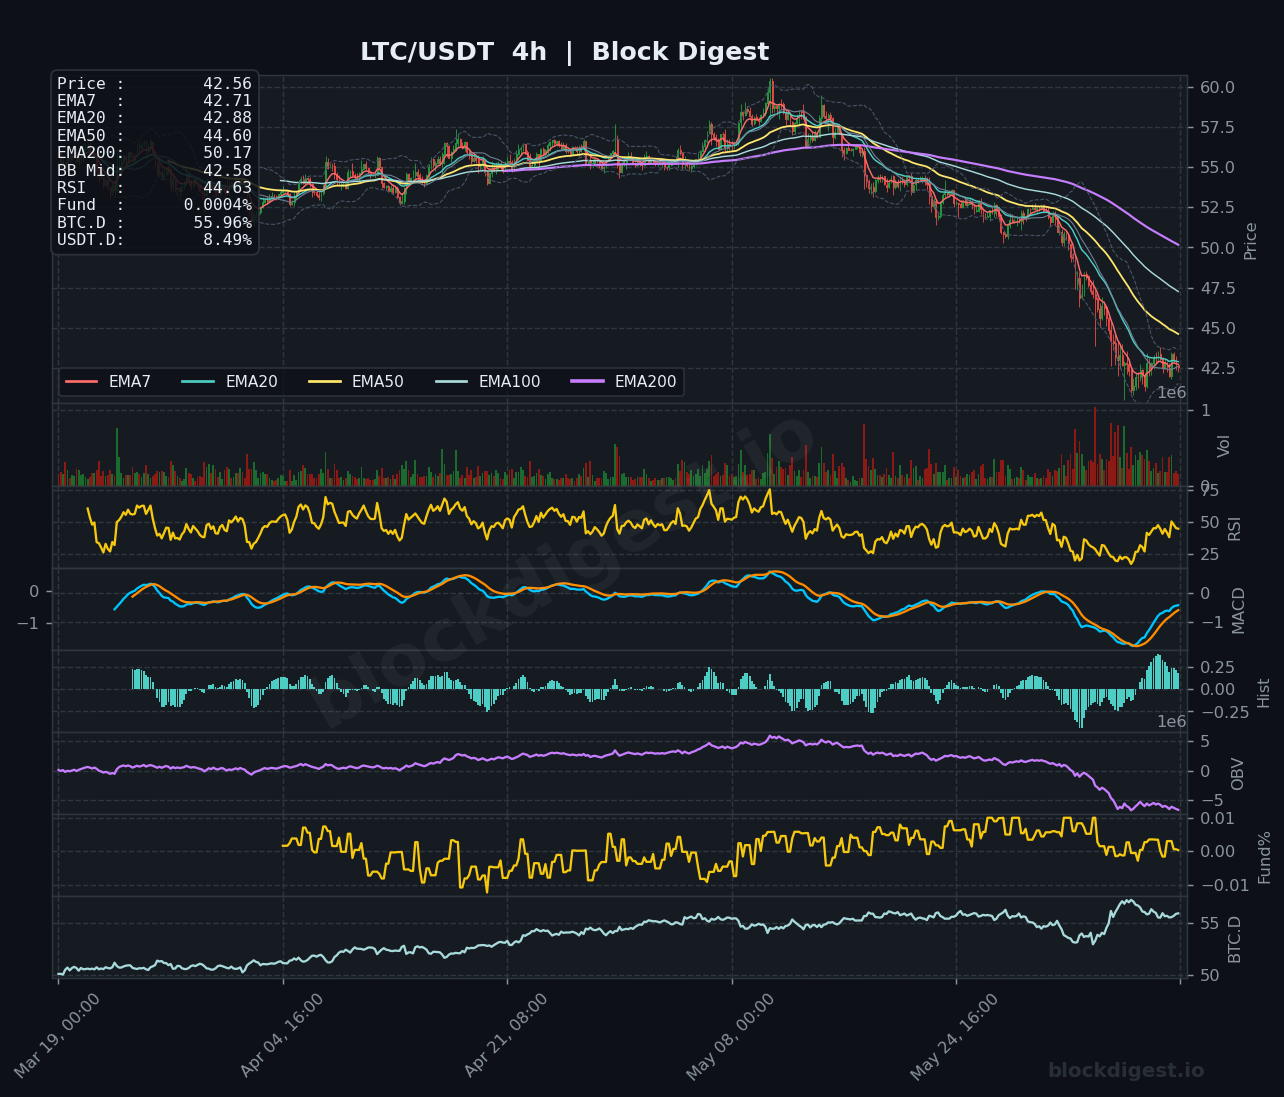
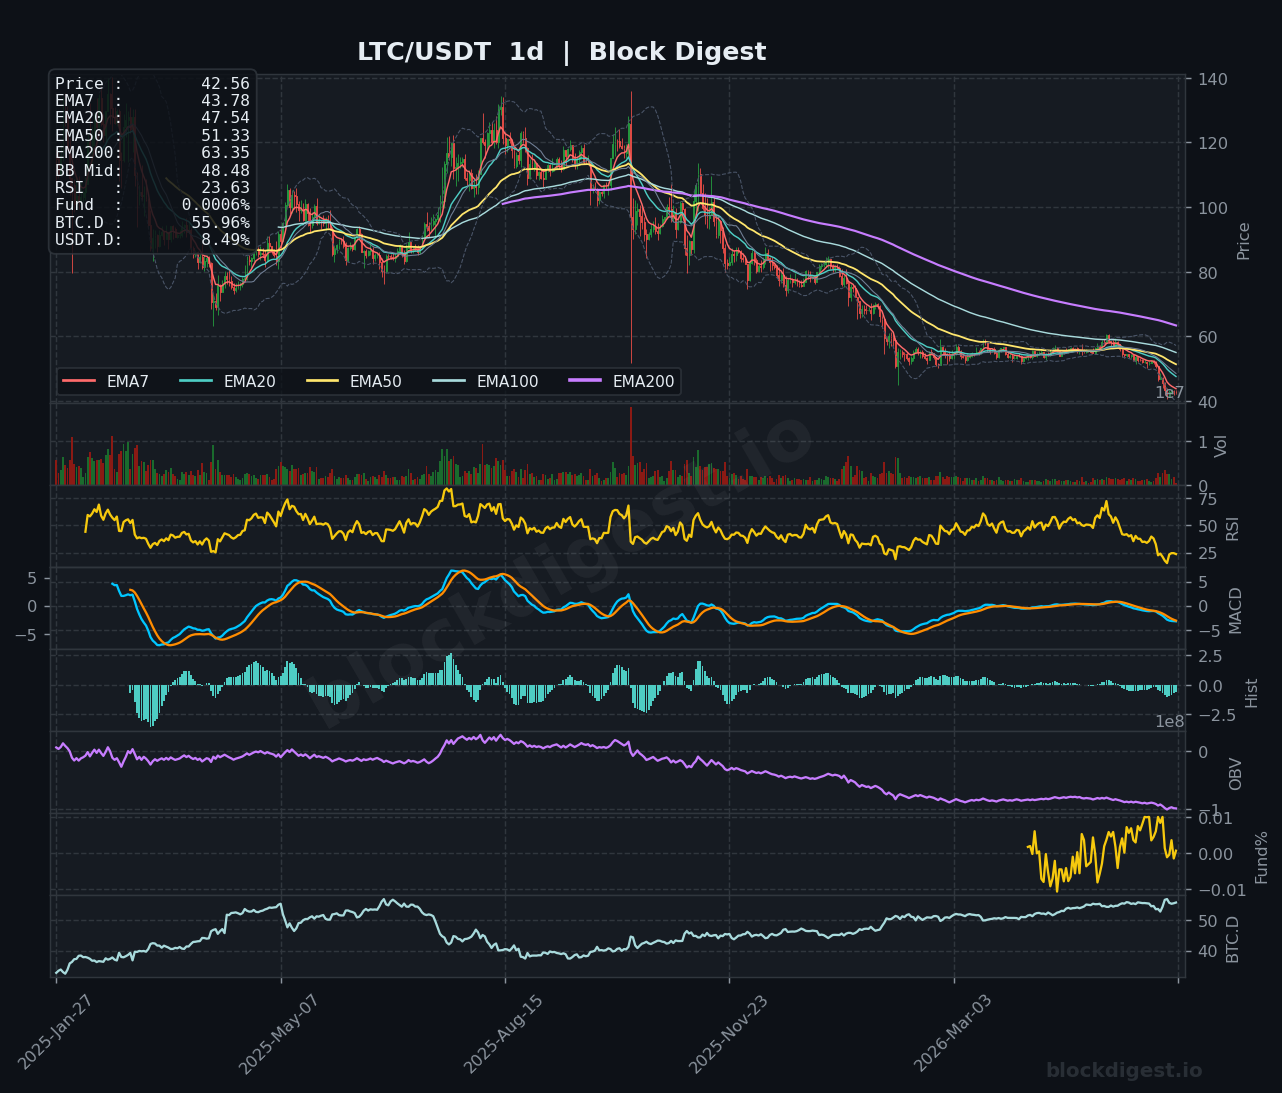
Litecoin (LTC)
LTC is the weakest performer in today’s review, trading at $42.55–$42.56 with a daily RSI reading of just 23.63 — the lowest across all assets covered and firmly in deeply oversold territory. Price is trading well below all EMAs on every timeframe, with the daily EMA200 at $63.35 and EMA50 at $51.33 representing substantial overhead barriers. The 4h MACD is deeply negative at around -1.0 with no meaningful hook higher, and the OBV on both the 4h and daily charts shows persistent selling with no sign of accumulation. A short-term bounce is statistically plausible given the extreme RSI reading, with $43.78 (EMA7 on daily) acting as the first overhead level to watch, but the structural bias remains firmly bearish until price reclaims at least the $47–$48 region.
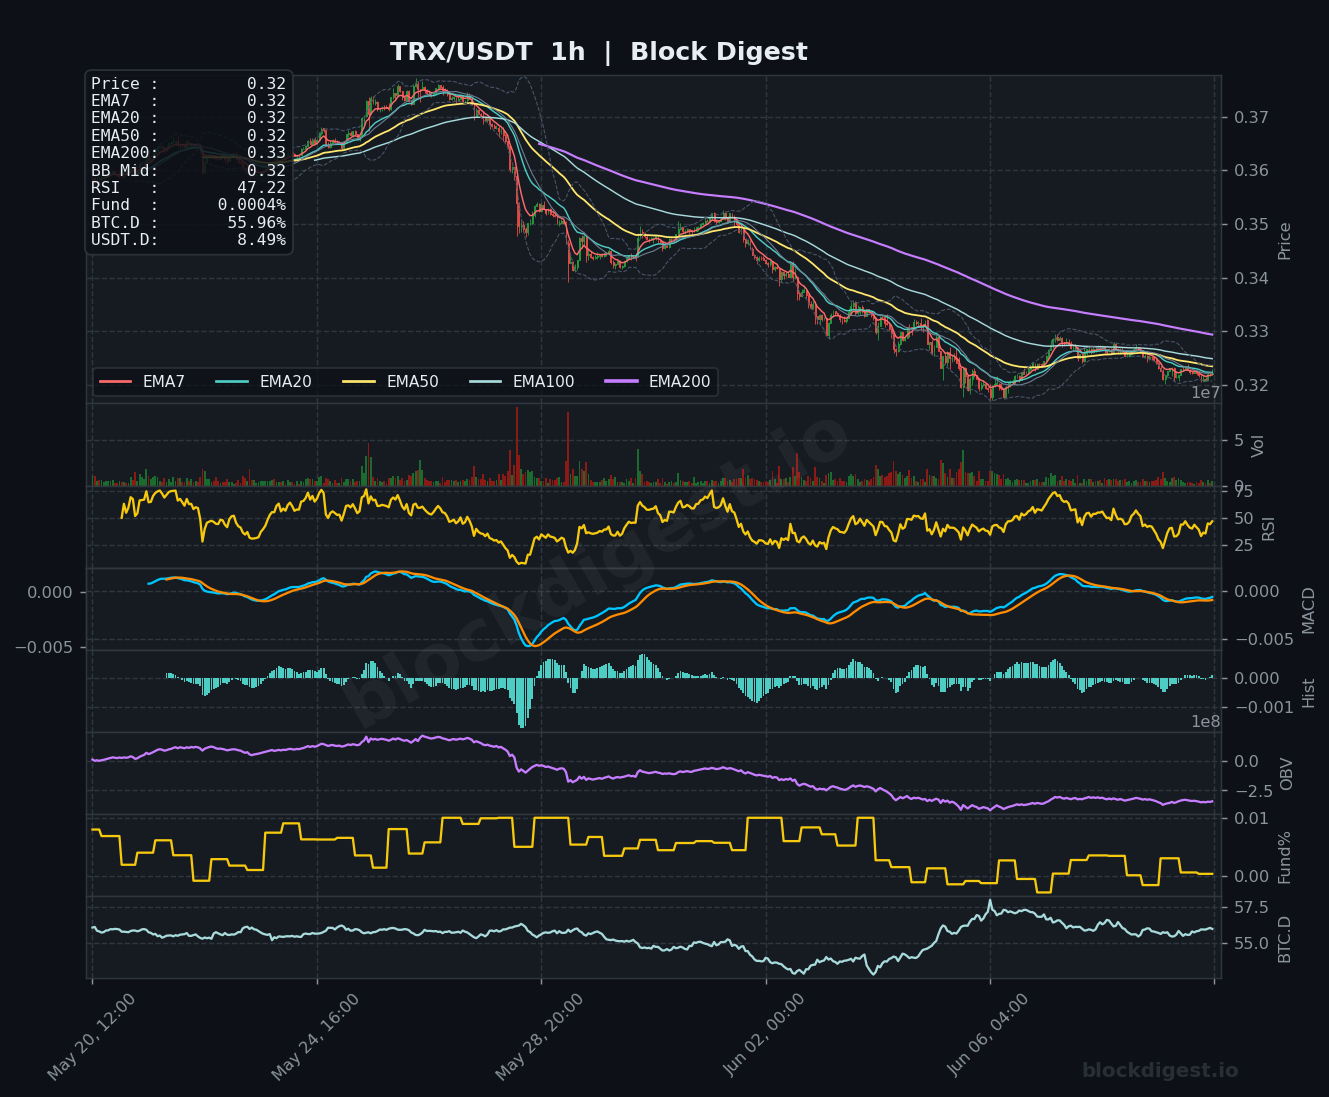
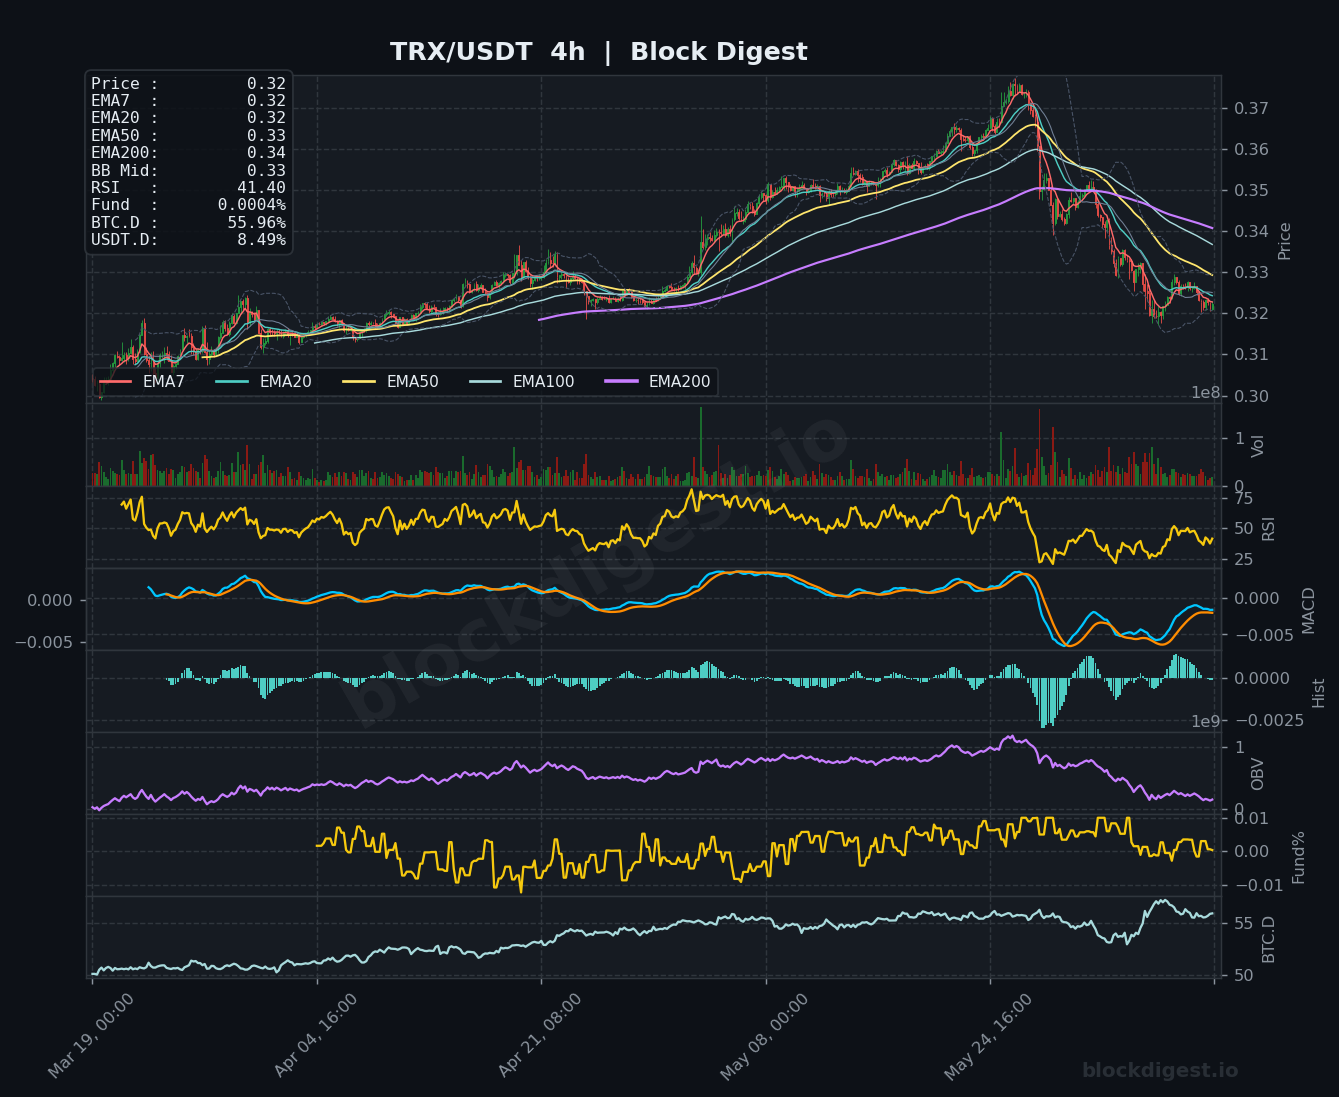
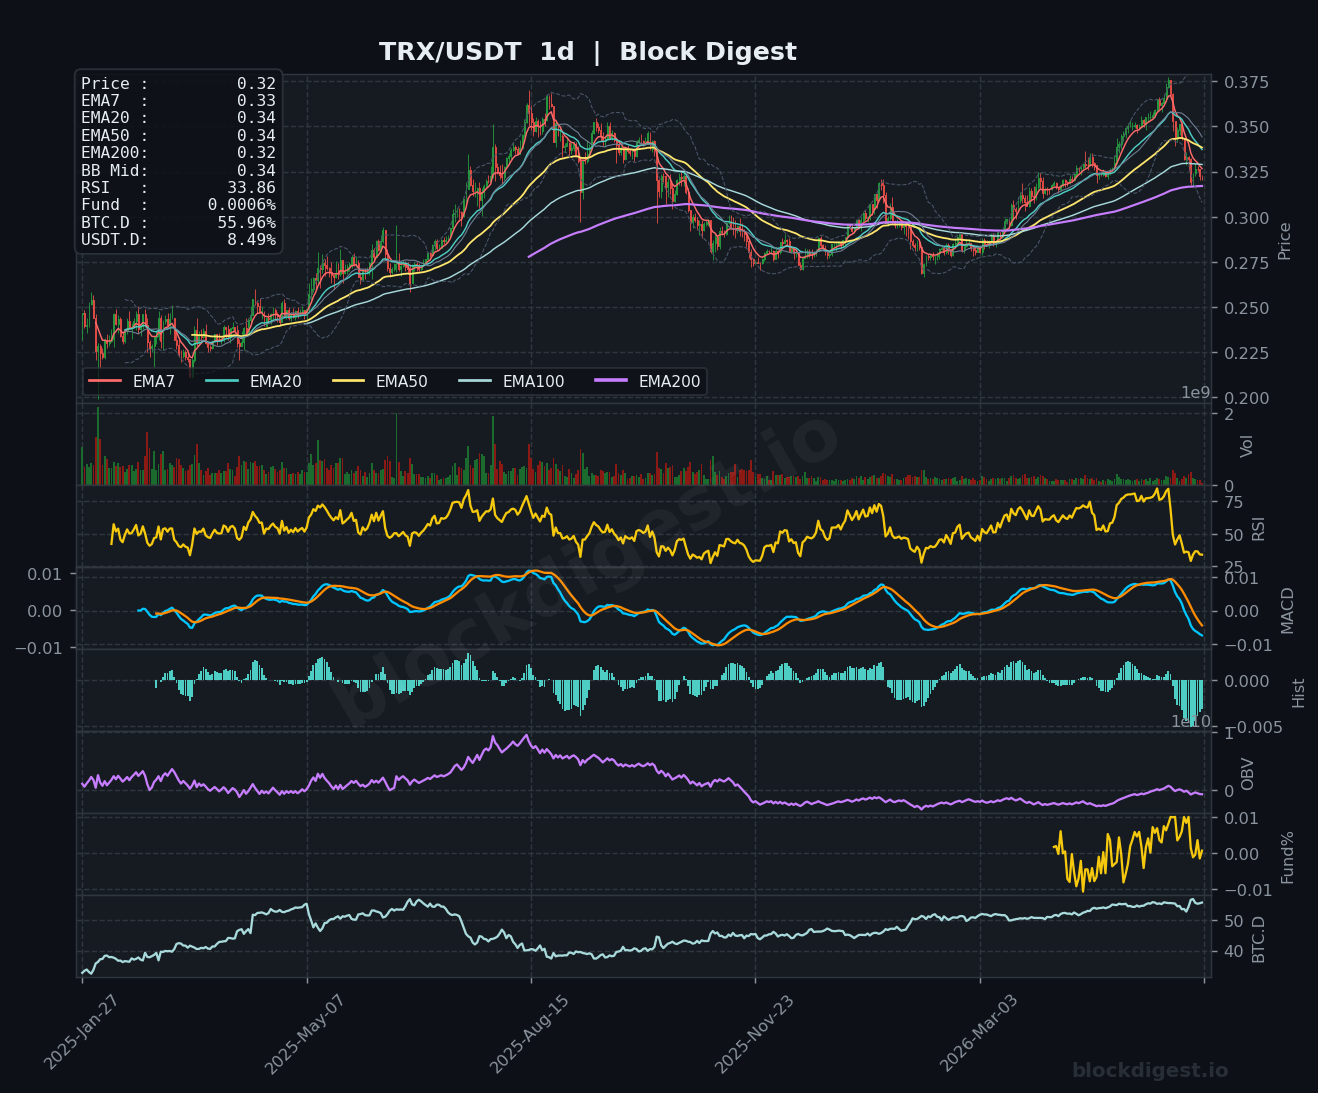
TRON (TRX)
TRX presents a somewhat different structural picture compared to its peers, trading at $0.32 — still above its longer-term EMA200 on the daily chart at $0.32 and retaining a higher macro baseline thanks to a strong rally throughout 2025 and early 2026. However, the daily RSI has dropped to 33.86 following a sharp pullback from highs near $0.375, and the daily MACD has crossed bearish after an extended bullish run, signaling a meaningful trend change. On the 4h chart, RSI at 41.40 and a recovering MACD histogram hint at short-term stabilization, with price consolidating in the $0.32–$0.33 band. TRX remains the most structurally sound of the six assets reviewed, but a failure to hold the $0.31–$0.32 support zone would accelerate downside toward $0.29–$0.30.
Altcoin Outlook
The overall altcoin landscape on June 10, 2026 is characterized by broad bearish pressure, with BTC dominance near 56% and elevated USDT dominance suppressing risk appetite across the board. Among the six assets, TRX stands out as the most structurally resilient given its higher daily baseline and EMA200 proximity, while LTC and SOL present the weakest setups — both printing daily RSIs below 27 with no credible near-term recovery signals. Multiple assets are entering or already in daily oversold territory (XRP, DOGE, LTC, SOL), which warrants close monitoring for potential mean-reversion bounces, though any such moves should be treated as counter-trend until BTC dominance retreats below 54% and USDT.D shows a clear declining trend. Traders should watch for a decisive reclaim of near-term EMA clusters as the first signal that conditions are improving; until then, capital preservation and patience remain the prudent approach.
Disclaimer: This analysis is for informational purposes only and does not constitute financial advice. Cryptocurrency markets are highly volatile and unpredictable. All trading decisions should be made based on your own research and risk tolerance. Block Digest is not responsible for any financial losses incurred as a result of acting on this content.