BTC Weekly Analysis — Week of May 11, 2026
BTC Weekly Analysis – Week of May 11, 2026
Weekly Market Overview
Bitcoin continues to consolidate in a tight range around $80,700, marking several weeks of sideways accumulation following the sharp decline from the October 2025 all-time high near $126,000. The current weekly candle is forming as a narrow-range inside bar, suggesting market indecision as bulls and bears battle for directional control. Price remains above the critical weekly EMA7 ($77,339), indicating short-term support is holding, though the broader weekly structure shows Bitcoin still trading below the EMA50 ($85,610), keeping the intermediate trend slightly bearish. This consolidation phase mirrors the “cooling and accumulation” pattern referenced in recent market commentary, as institutional buyers appear to be absorbing supply at these levels.
Higher Timeframe Structure
On the weekly timeframe, Bitcoin’s EMA structure reveals a challenged uptrend with price currently sandwiched between the EMA7 ($77,339) and EMA50 ($85,610), while the EMA200 ($69,081) provides strong macro support well below current levels. The weekly Bollinger Bands show price trading near the middle band around $75,900, suggesting reduced volatility after the violent Q4 2025 selloff. This positioning indicates Bitcoin is neither in an aggressive bullish expansion nor a bearish breakdown scenario—rather, it’s in a neutral consolidation zone that typically precedes a significant directional move. The fact that price has held above $75,000 for multiple weeks suggests accumulation is occurring, consistent with the institutional-driven cycle characterized by steadier buying patterns rather than parabolic retail momentum.
Multi-Timeframe Confluence
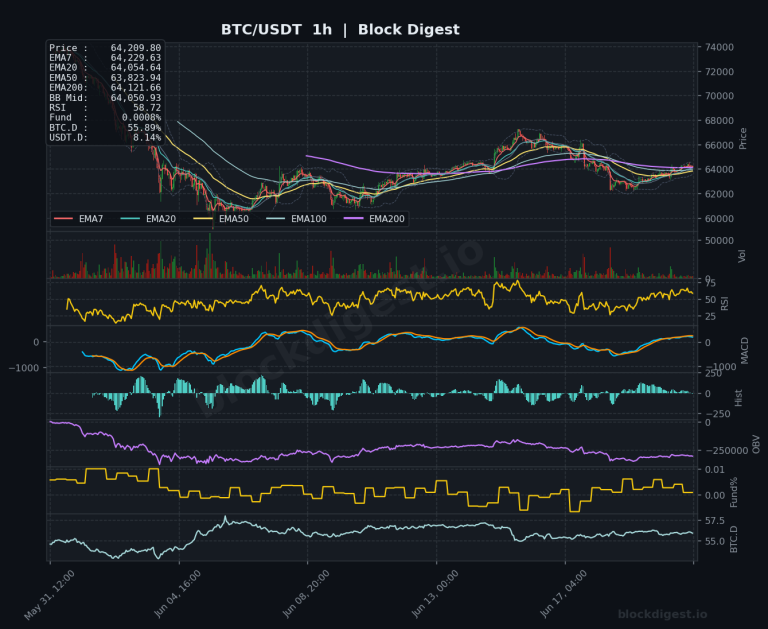
The multi-timeframe analysis reveals improving alignment favoring a potential breakout setup. While the weekly chart shows neutral consolidation, the daily timeframe has rotated bullish with price reclaiming both the EMA7 ($80,580) and approaching the EMA20 ($78,757), with the daily RSI at 61.88 showing healthy momentum without being overbought. The 4-hour chart confirms this constructive structure with a tight bullish EMA stack (7/20/50 all clustered between $80,162-$81,025) and price respecting these levels as support. The 1-hour timeframe shows short-term consolidation near $80,726 with EMAs coiling tightly, typically a precursor to expansion. The confluence zone between $78,000-$80,000 represents where weekly support, daily EMA50 ($75,976), and 4-hour EMA200 ($76,866) converge, creating a significant demand area that has successfully defended multiple tests.
Key Weekly Levels
Weekly Resistance:
- $85,610 (Weekly EMA50): Critical intermediate resistance and gateway to resuming the broader uptrend; reclaiming this level would signal strength
- $90,000-$92,000: Previous consolidation zone visible on weekly chart and psychological resistance area
- $100,000: Major psychological level and the lower bound of the Q4 2025 distribution zone
Weekly Support:
- $77,339 (Weekly EMA7): Immediate support that has held the recent consolidation; losing this would trigger concern
- $75,000-$75,976: Critical support zone combining psychological level and daily EMA50; failure here opens downside
- $69,081 (Weekly EMA200): Ultimate macro support representing the long-term bull market structure
Momentum & Volume Analysis
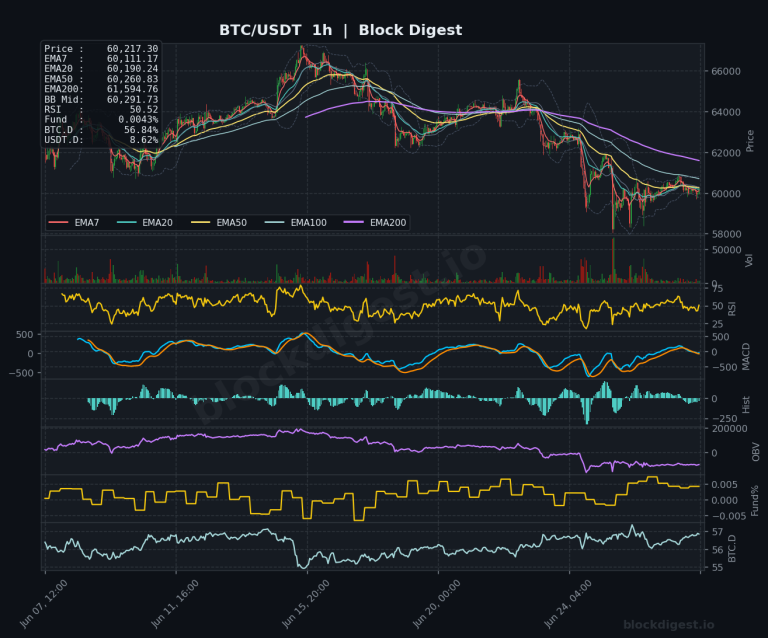
Weekly momentum indicators are showing early signs of stabilization after the prolonged bearish divergence. The weekly RSI at 49.63 sits in neutral territory, neither overbought nor oversold, with room to move in either direction—this positioning is constructive as it allows for upside expansion without immediate resistance from overheated conditions. The weekly MACD remains in negative territory with both lines below zero, though the histogram is showing slight convergence, suggesting bearish momentum is weakening. Daily RSI at 61.88 and 4-hour RSI at 50.73 both confirm improving momentum across timeframes. The OBV on weekly and daily charts shows flat to slightly positive accumulation, indicating that volume is supporting the price consolidation rather than suggesting distribution. The Funding Rate at 0.0058% (roughly 1.5% monthly) remains slightly positive but not extreme, suggesting mild long bias in the derivatives market without signaling overleveraged positioning that could trigger cascade liquidations.
BTC Dominance & Altcoin Implications
Bitcoin Dominance (BTC.D) currently sits at 54.49%, showing a gradual uptrend from the lows around 50% earlier in the cycle, indicating capital is flowing back into Bitcoin relative to altcoins. This rising dominance during a consolidation phase typically suggests defensive positioning as market participants seek safety in BTC while uncertainty persists. USDT Dominance at 6.83% remains elevated, confirming that significant stablecoin liquidity sits on the sidelines waiting for clearer directional signals. The combination of rising BTC.D and elevated USDT.D creates a challenging environment for altcoins in the near term, as capital is neither flowing aggressively into Bitcoin nor rotating into alternative assets. However, should Bitcoin break above $85,000-$90,000 with conviction, the historical pattern suggests BTC.D could peak and initiate an altcoin season as risk appetite returns.
Risk Scenarios
Bull Case: A decisive weekly close above the EMA50 at $85,610, accompanied by expanding volume and RSI breaking above 55, would confirm resumption of the intermediate uptrend and target the $90,000-$92,000 resistance zone. Follow-through above $92,000 would open the path toward retesting the psychological $100,000 level, with the most bullish scenario seeing Bitcoin challenge the prior all-time highs near $126,000 if macroeconomic conditions remain supportive. The CME bitcoin volatility futures launch in June could provide additional derivative-driven momentum. Weekly targets in this scenario: $85,600 → $92,000 → $100,000.
Bear Case: Failure to hold the weekly EMA7 at $77,339, particularly on a weekly close basis with increasing volume, would negate the consolidation thesis and suggest distribution is occurring. A breakdown below the critical $75,000-$75,976 support cluster would likely trigger algorithmic selling and cascade into the $69,000-$70,000 zone where the weekly EMA200 resides. The most bearish scenario would see weekly RSI breaking below 40 and MACD accelerating downward, potentially testing the $65,000-$67,000 region where previous consolidation occurred. Weekly targets in this scenario: $75,000 → $69,000 → $65,000.
Weekly Outlook
The week ahead is likely to determine whether Bitcoin’s multi-week consolidation resolves to the upside or requires another test of lower support. With price holding above weekly EMA7 and short-term timeframes showing improving structure, the path of least resistance appears skewed slightly bullish, particularly if Bitcoin can reclaim and hold above $82,000 on the daily timeframe. Key catalysts to monitor include macroeconomic data releases, institutional flow data, and any regulatory developments following the failed Swiss bitcoin reserve initiative. The critical levels to watch are $77,300 support (weekly EMA7 test would signal weakness) and $85,600 resistance (reclaiming EMA50 would confirm bullish intent). The current risk/reward favors patient accumulation in the $78,000-$81,000 zone with tight risk management below $75,000, while aggressive traders may wait for a confirmed breakout above $85,600 before committing to new long positions. The overall weekly setup suggests the consolidation is nearing resolution, with the next significant move likely to define the trajectory for the broader May-June period.
Disclaimer: This analysis is for informational purposes only and does not constitute financial advice. Cryptocurrency markets are highly volatile and unpredictable. All trading decisions should be made based on your own research and risk tolerance. Block Digest is not responsible for any financial losses incurred as a result of acting on this content.