Altcoin Daily Analysis: Bitcoin Dominance at 55.5% Amid Stablecoin Consolidation
Market Context
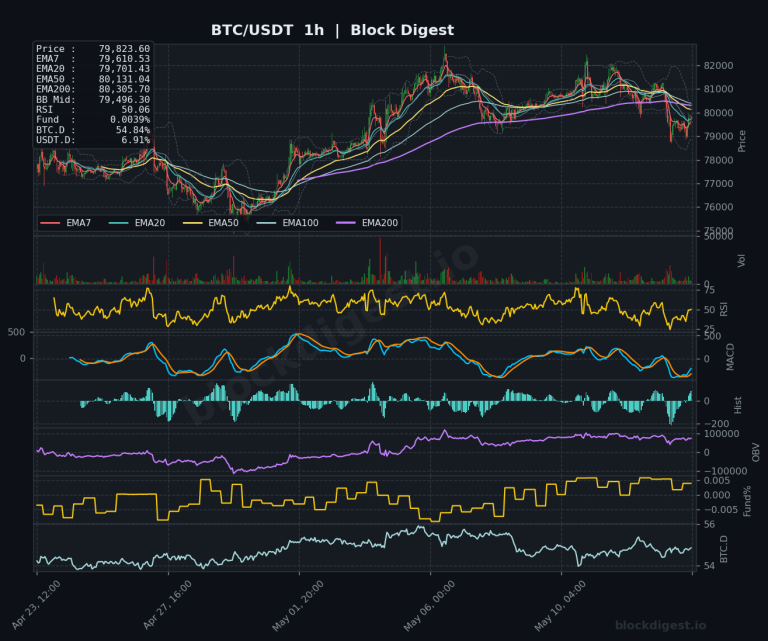
Bitcoin dominance sits at a notable 55.51–55.52% across all charts, reflecting continued capital concentration in BTC at the expense of altcoins. USDT dominance at 8.09% remains elevated, signaling that a meaningful portion of market participants are still sitting in stablecoins rather than deploying into risk assets. The global crypto market cap of $2.19T is essentially flat on a 24-hour basis, painting a picture of a market in consolidation with a mild bearish tilt — altcoins are struggling to find directional conviction under these macro conditions.
Solana (SOL)
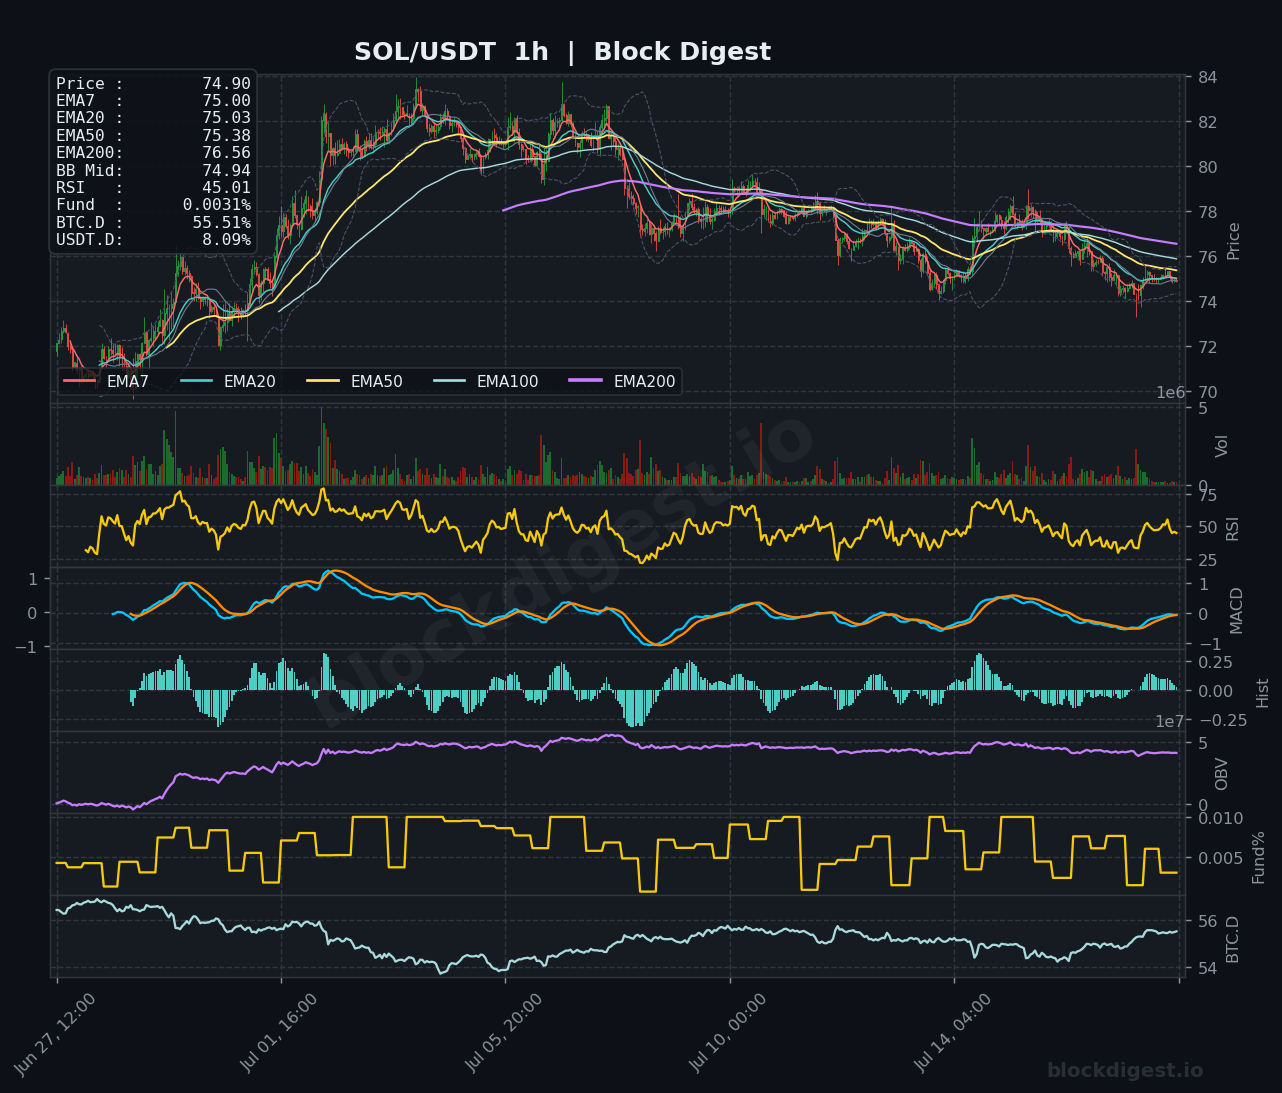
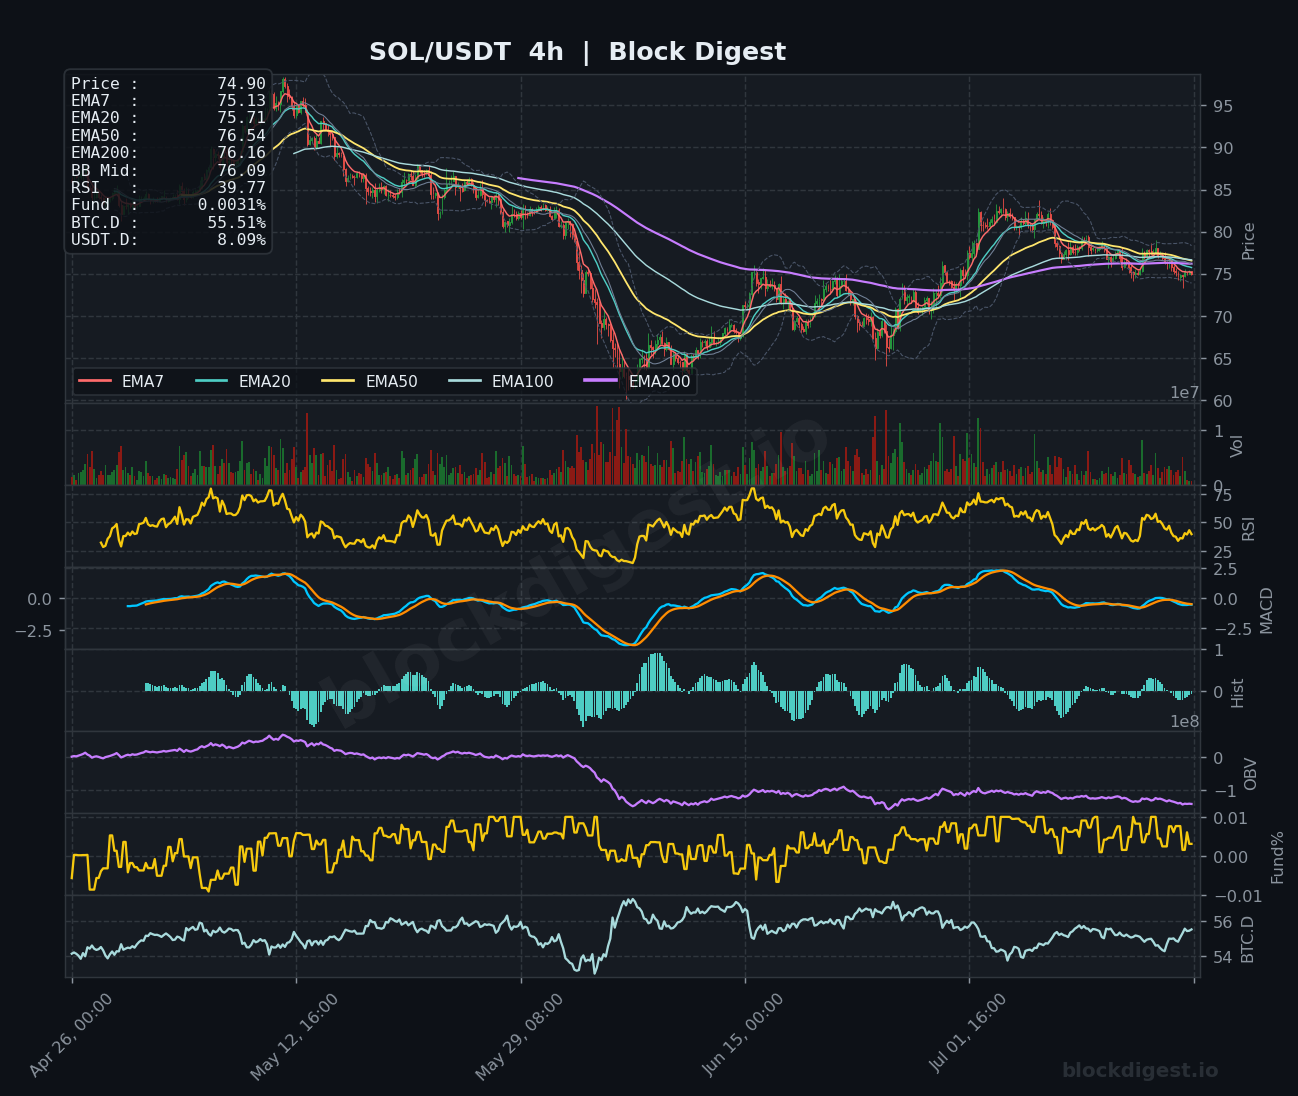
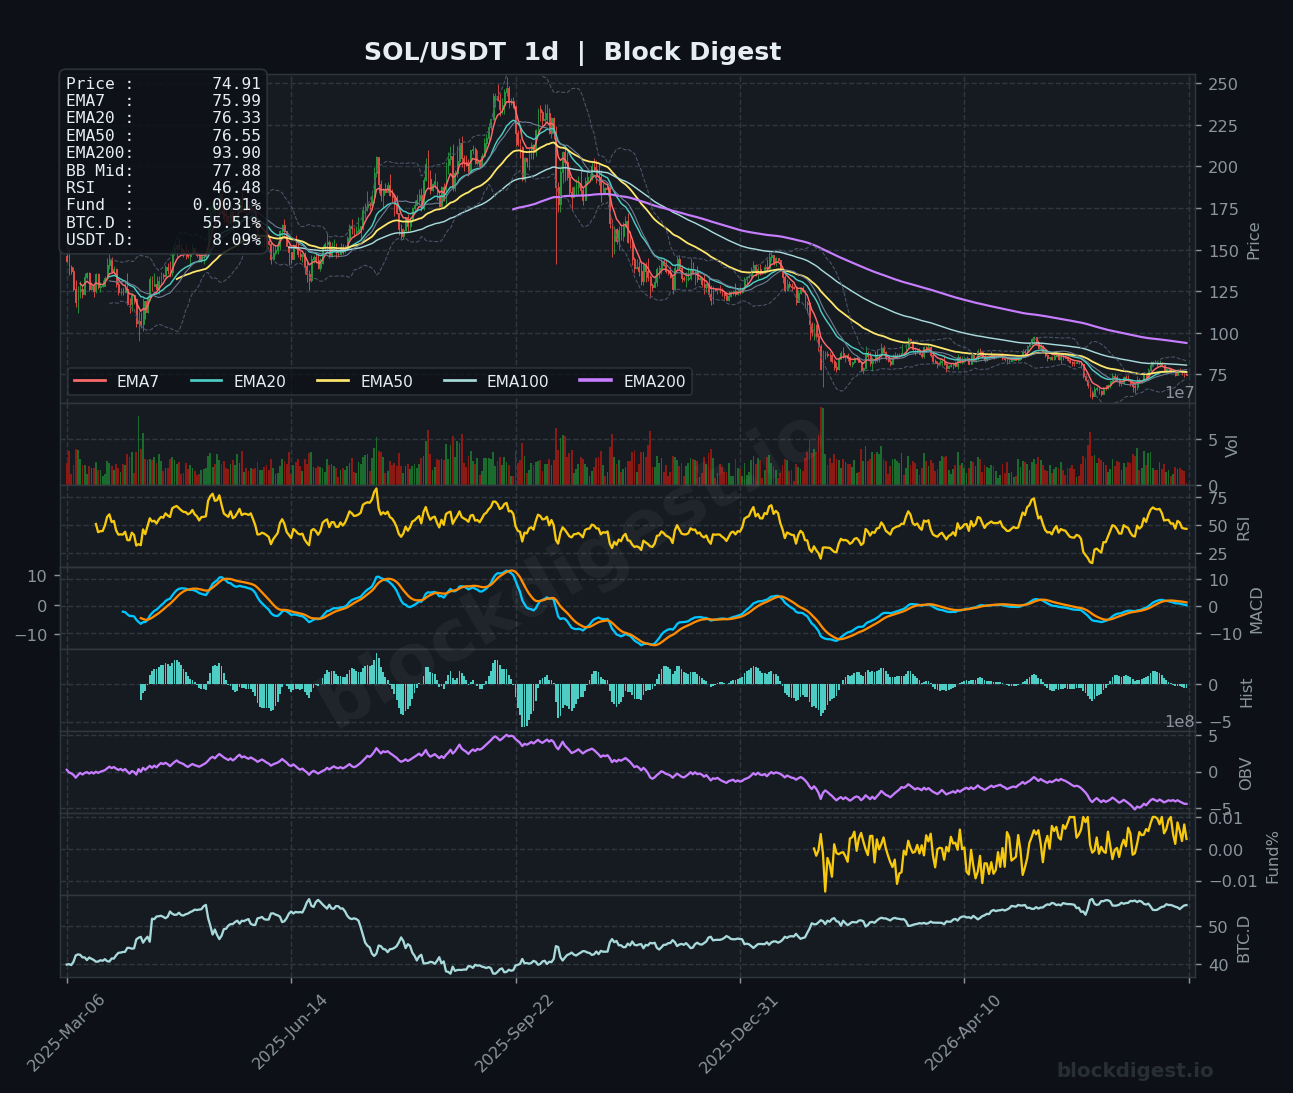
SOL is trading at $74.90–$74.91, printing below all key EMAs on both the 1h and 4h timeframes — the EMA7 ($75.00), EMA20 ($75.03), EMA50 ($75.38), and EMA200 ($76.56) are all stacked bearishly overhead. The 4h RSI at 39.77 is approaching oversold territory without yet showing a definitive reversal signal, while the MACD remains in negative territory with the histogram printing small but persistent bearish bars. On the daily chart, SOL is deeply beneath its EMA200 ($93.90), underscoring the severity of the longer-term downtrend from prior highs above $200. While Solana’s perpetual DEXs crossing $1B in daily trading volume is a constructive on-chain development, the technical setup remains bearish in the short term, with $73–$74 as the next meaningful support and $76.50–$77 as the key resistance cluster to reclaim.
XRP (XRP)
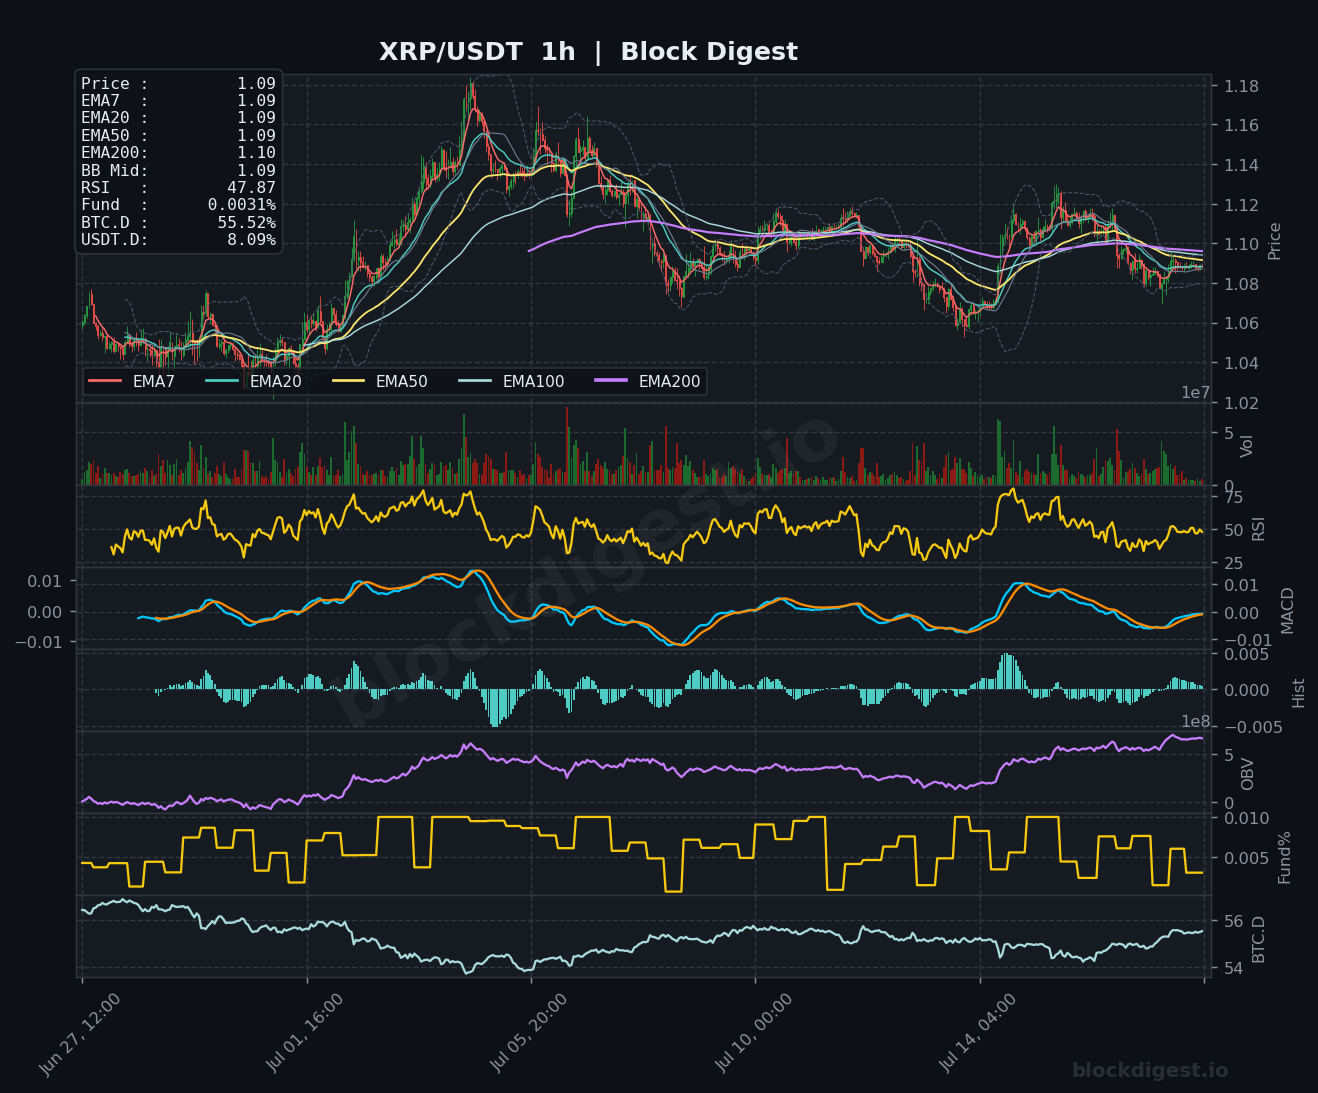
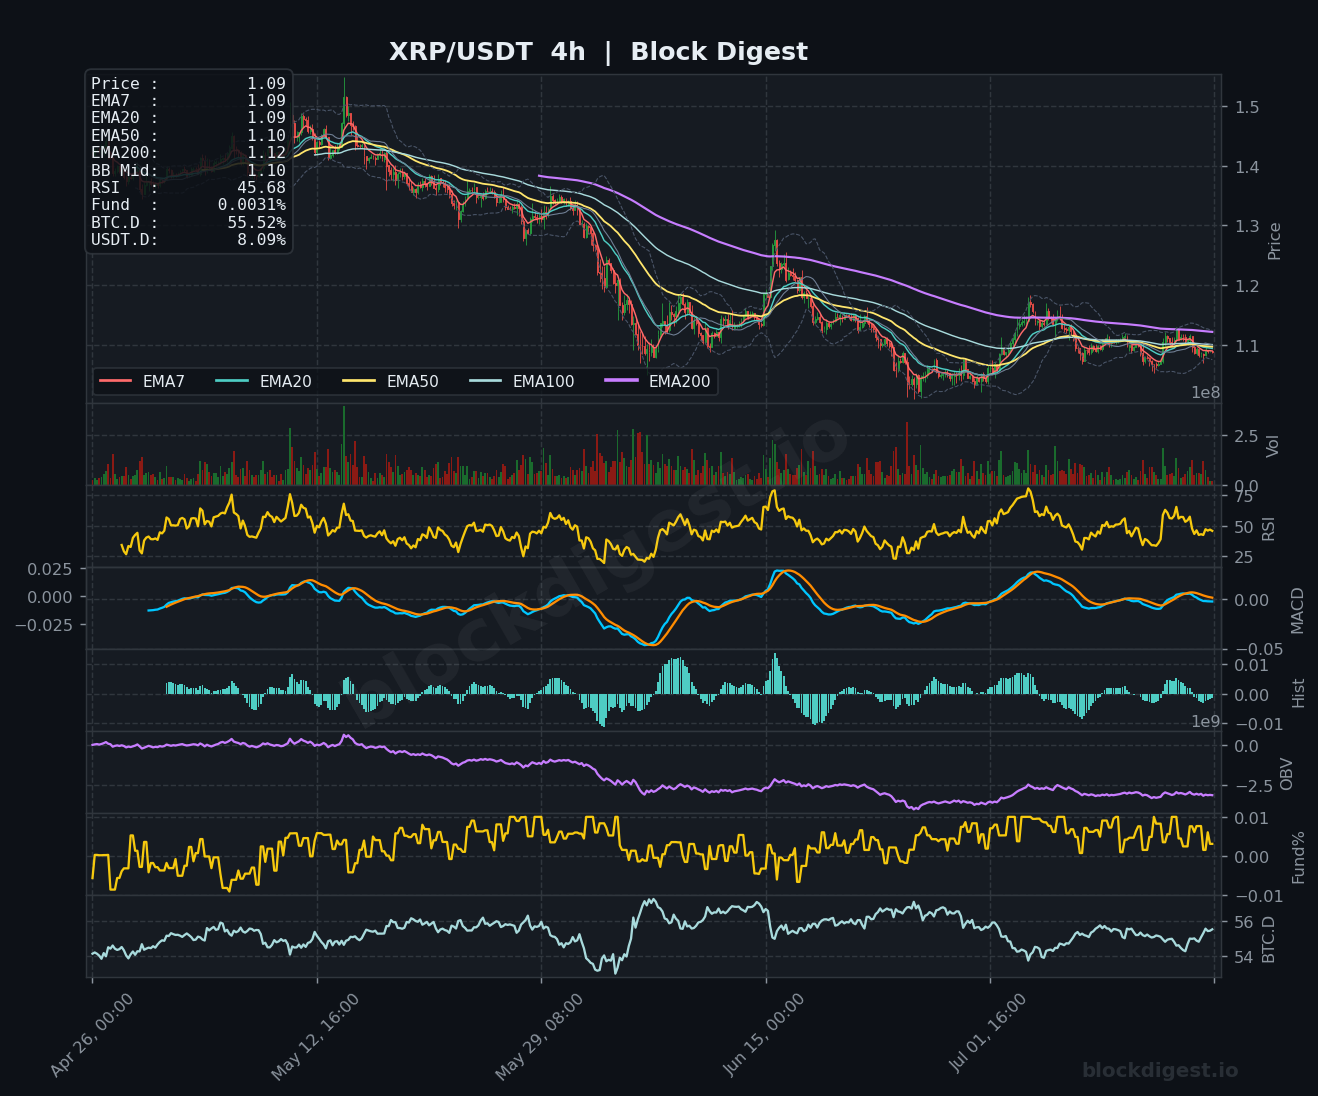
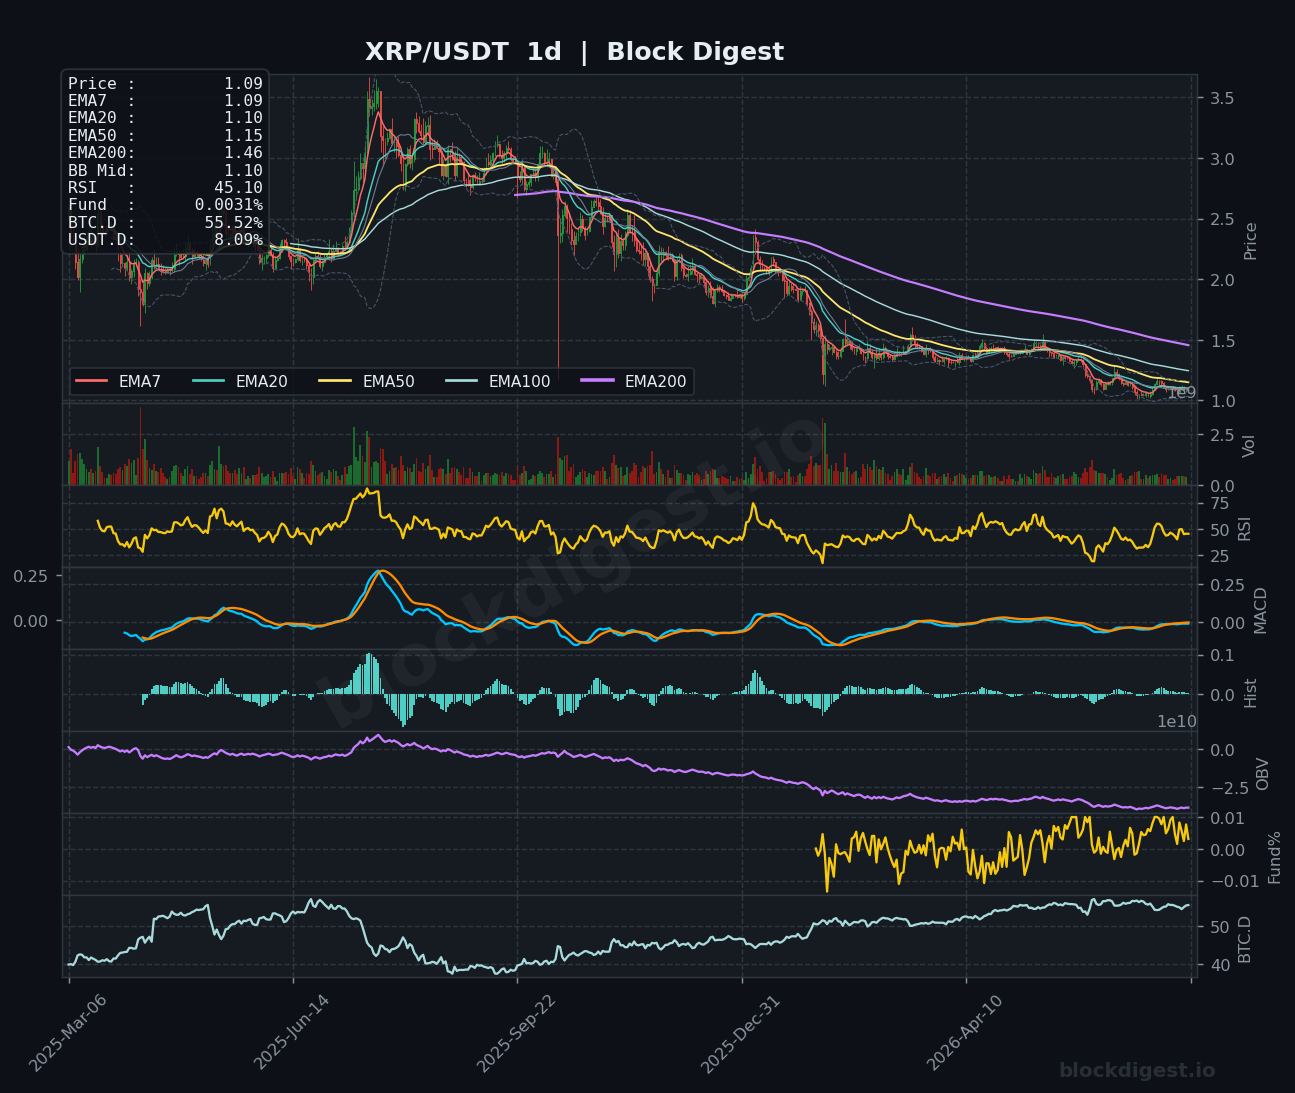
XRP is trading at $1.09, with price compressed tightly between the EMA7, EMA20, and EMA50 on the 1h chart — all converging around $1.09–$1.10 — indicating a coiling structure with potential for an imminent directional move. The 1h RSI at 47.87 and the 4h RSI at 45.68 are both hovering just below the neutral 50 line, reflecting indecision rather than clear directional momentum. On the daily chart, XRP remains below the EMA50 ($1.15) and steeply below the EMA200 ($1.46), confirming that the longer-term trend is still bearish following the extended decline from the $3.50 peak. Community bullishness and XRP’s inclusion in T. Rowe Price’s new TKNZ multi-token ETF offer fundamental tailwinds, but price needs a decisive close above $1.12–$1.15 to signal any meaningful shift in structure.
BNB (BNB)
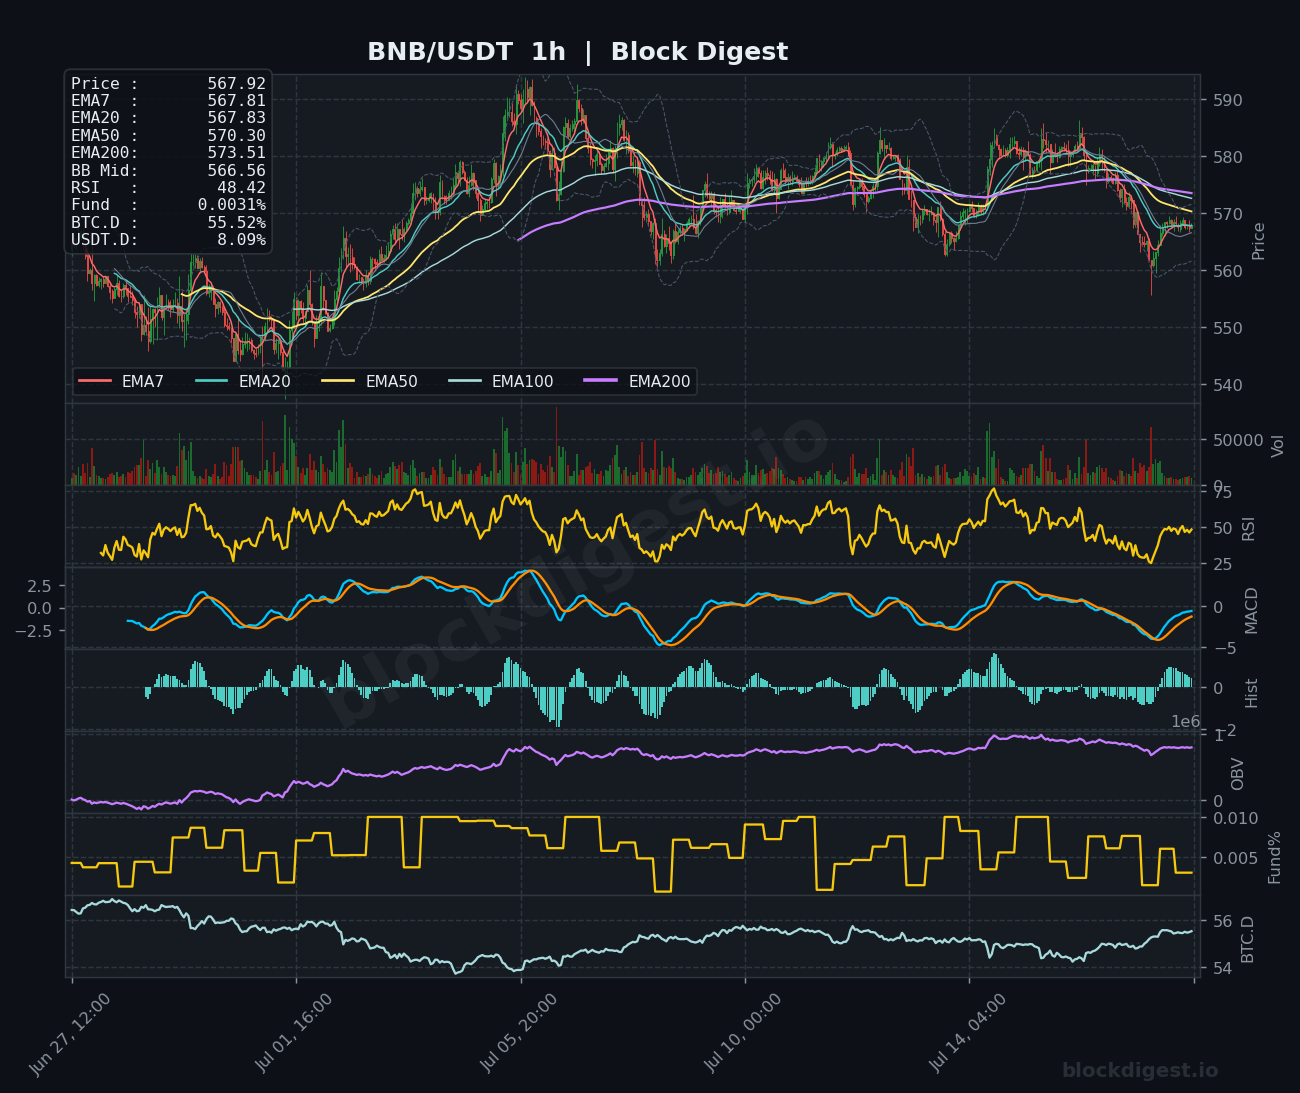
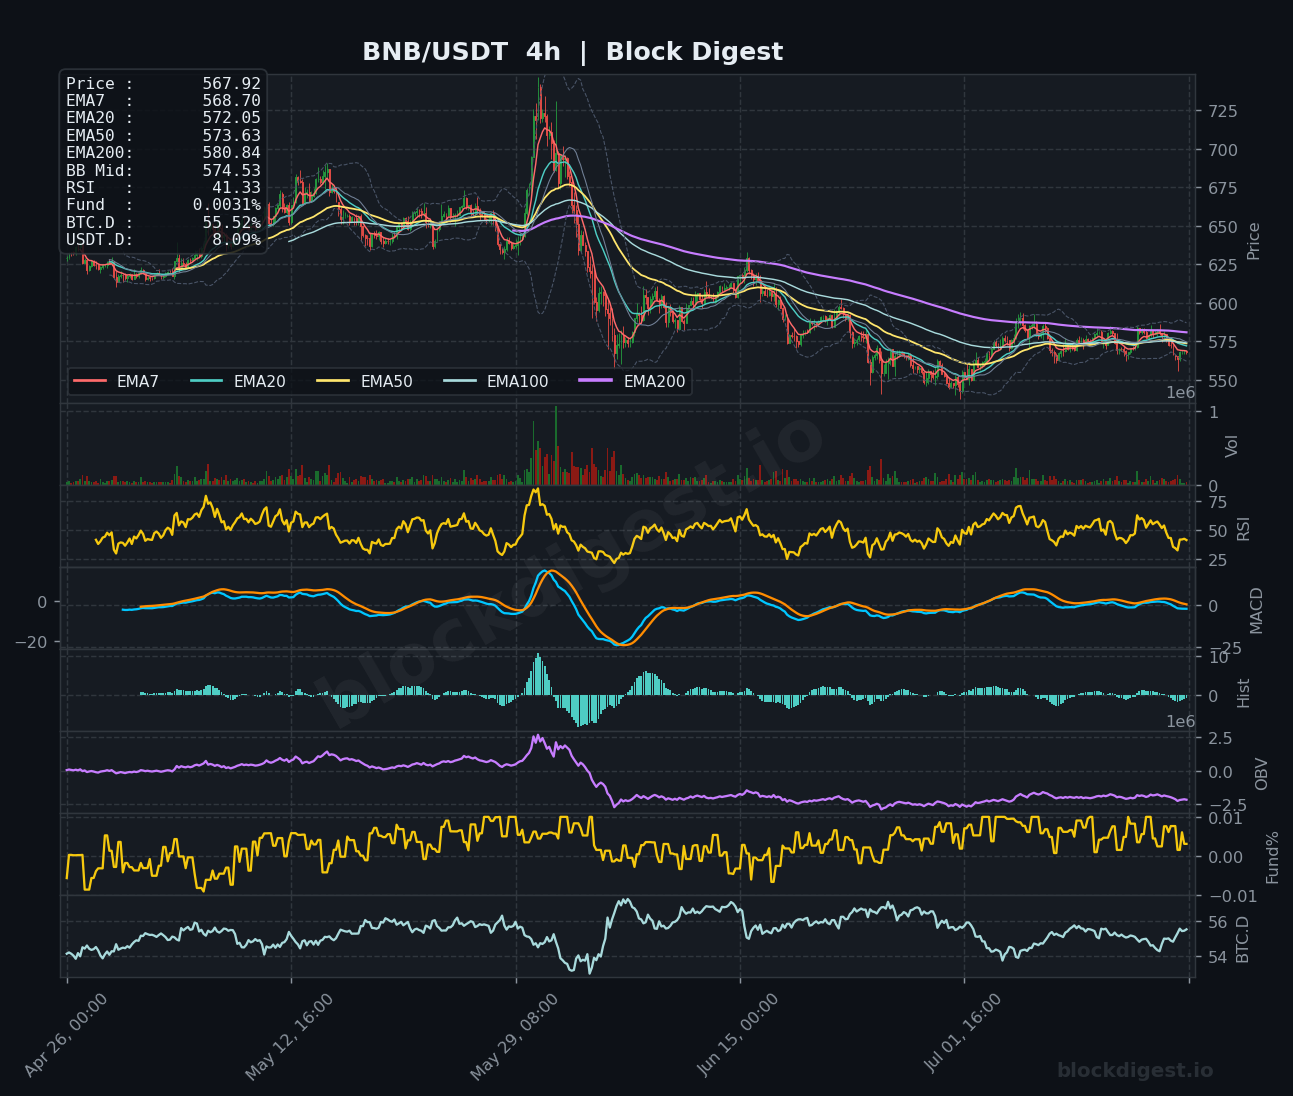
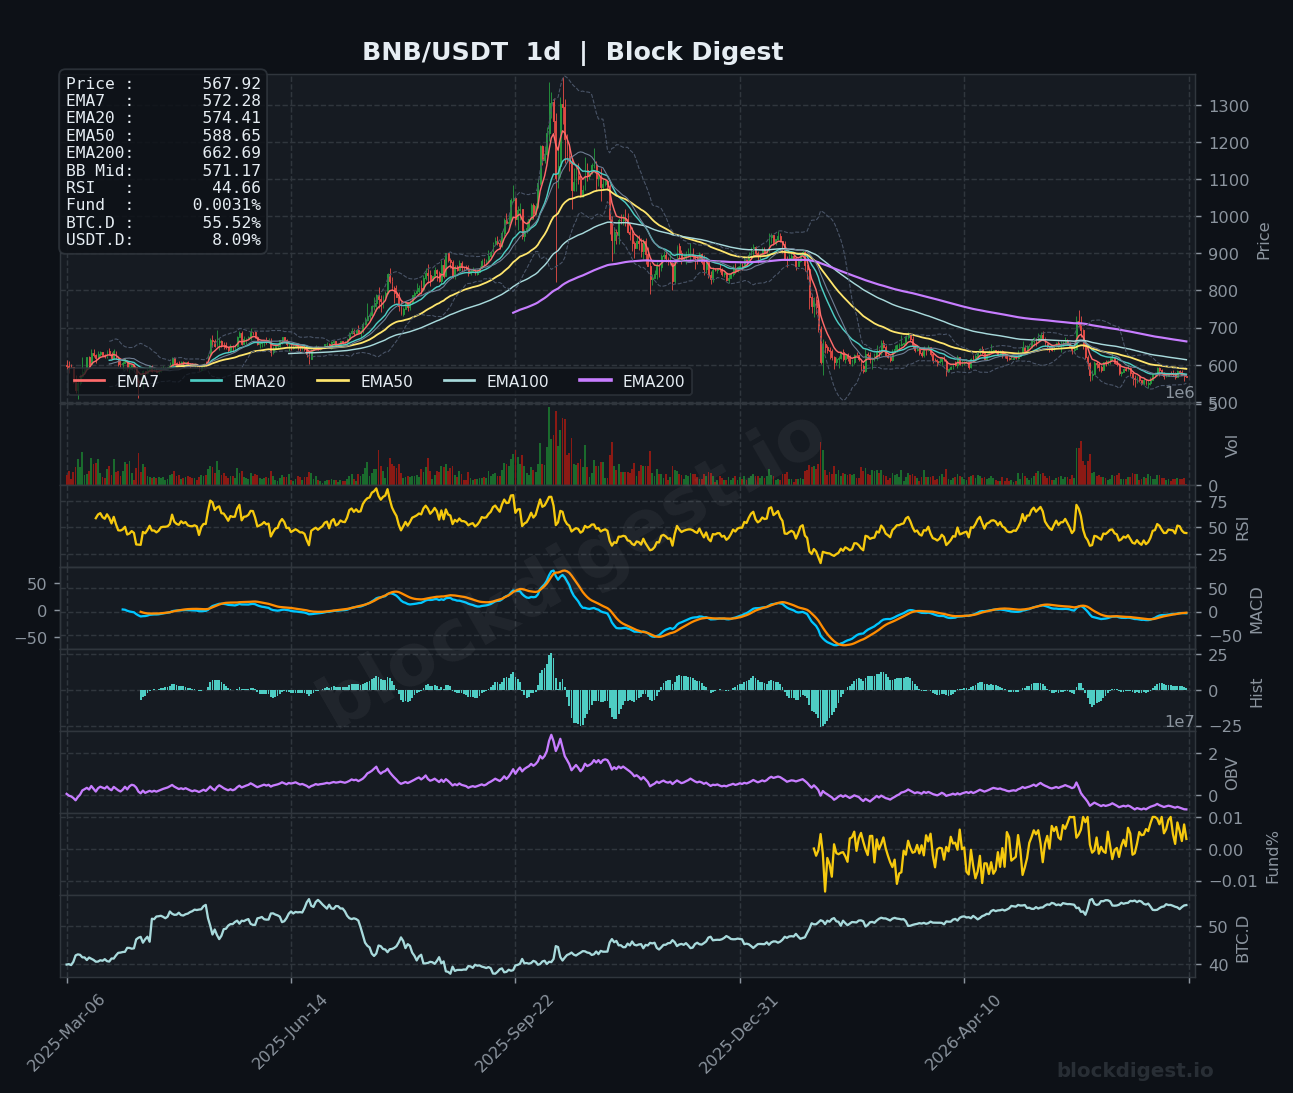
BNB is currently trading at $567.92, sitting below the EMA50 ($570.30) and EMA200 ($573.51) on the 1h chart, with a neutral-to-slightly-bearish RSI reading of 48.42. The 4h chart tells a more concerning story, with RSI at just 41.33 and the MACD signal lines hovering near zero after a failed recovery attempt, suggesting bullish momentum has stalled after a modest bounce off the $550 region. On the daily timeframe, BNB remains far beneath its EMA200 ($662.69) and EMA50 ($588.65), with the OBV in a persistent downtrend that reflects sustained net selling pressure over recent months. Key support to watch is the $555–$560 zone; a breakdown below that level would open downside toward the mid-$530s, while reclaiming $580 would be the first meaningful signal of recovery.
Dogecoin (DOGE)
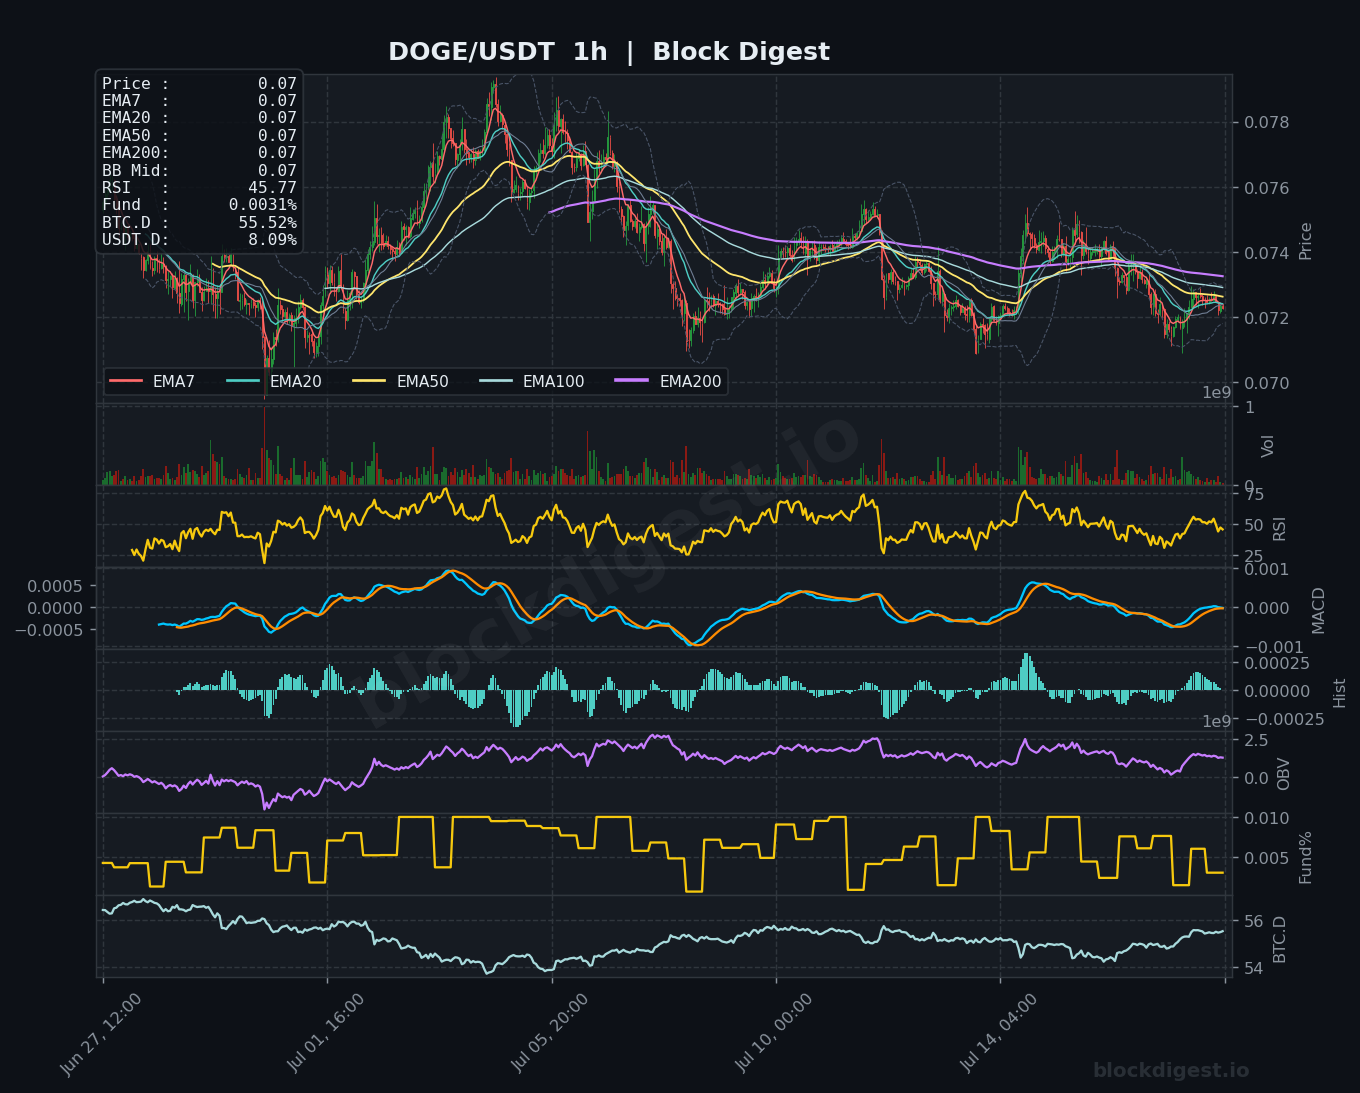
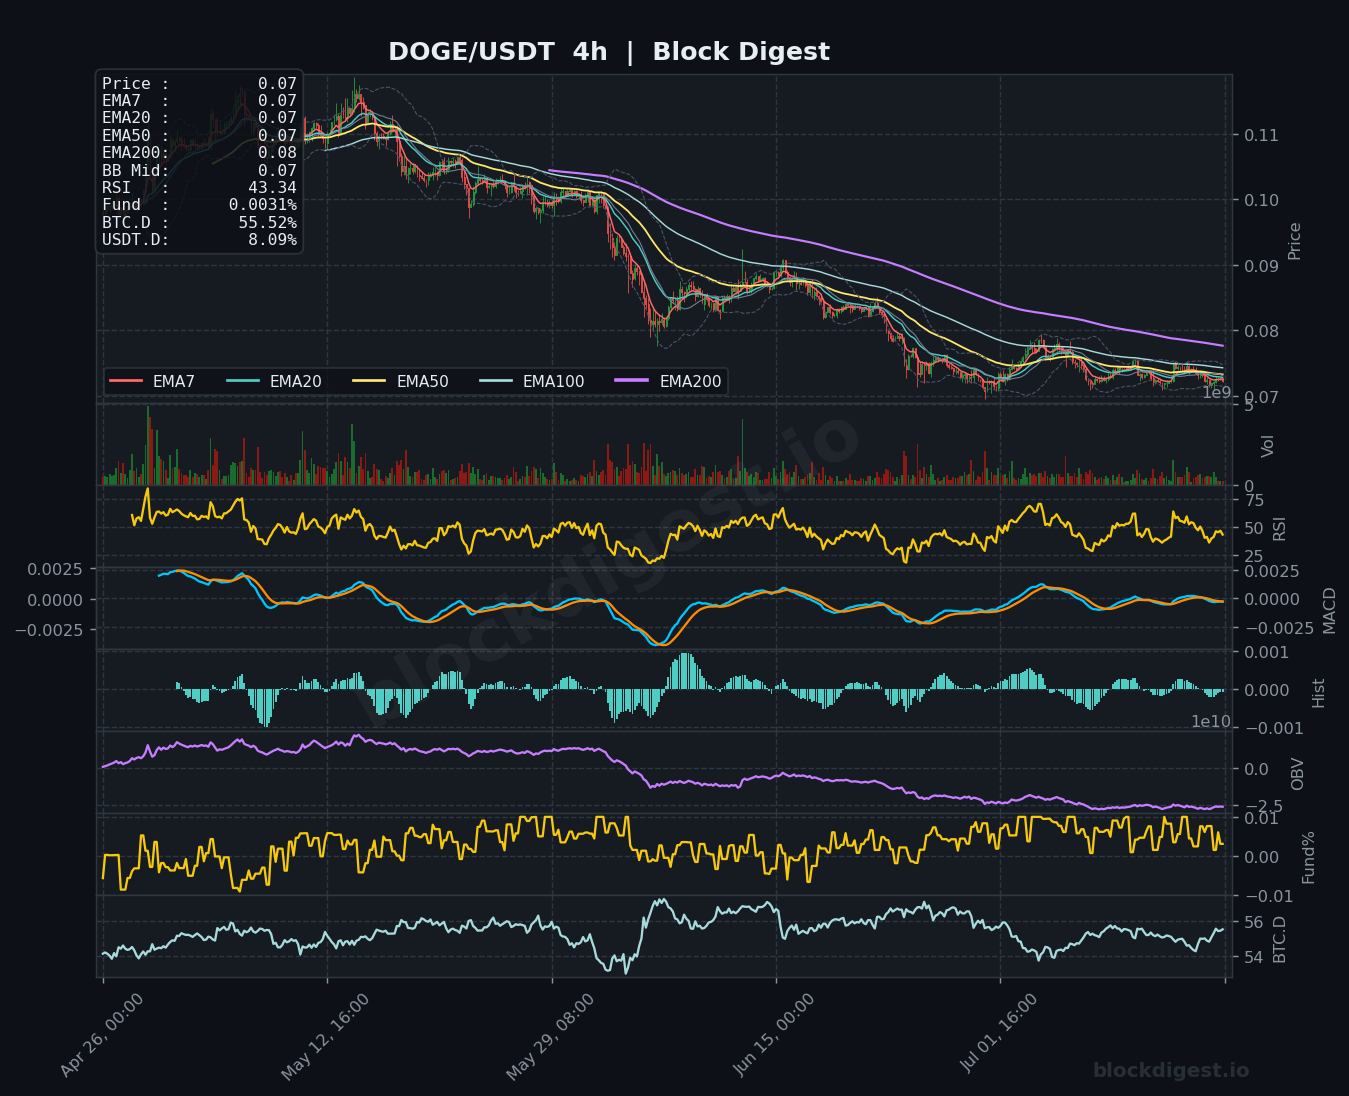
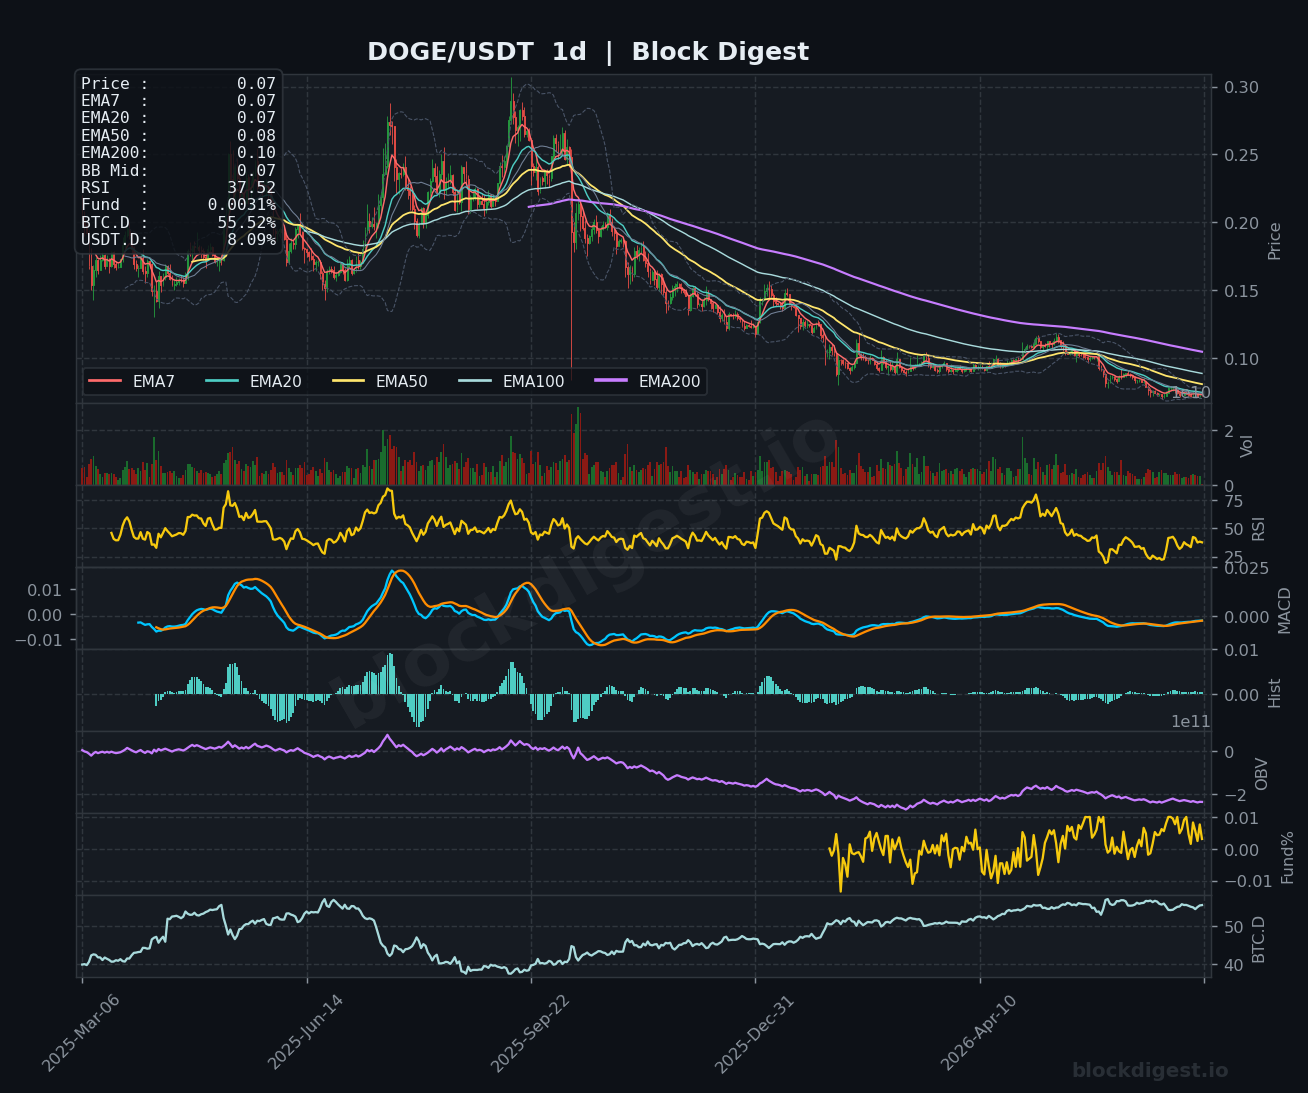
DOGE is trading at approximately $0.072, with all EMAs on the 1h chart stacked tightly around $0.07 — a flat, directionless structure that matches the symmetrical triangle consolidation noted in recent market commentary. The 1h RSI sits at 45.77 while the 4h RSI reads 43.34, both below the midpoint and leaning bearish without being deeply oversold. On the daily chart, the RSI at 37.52 is approaching oversold territory, the OBV continues its long-running downtrend, and price remains significantly beneath the EMA200 ($0.10), confirming the macro downtrend is intact. The $0.071–$0.072 area is acting as near-term support; a break below $0.070 could accelerate selling, while a push toward $0.075–$0.076 would be needed to generate any meaningful bullish interest.
Litecoin (LTC)
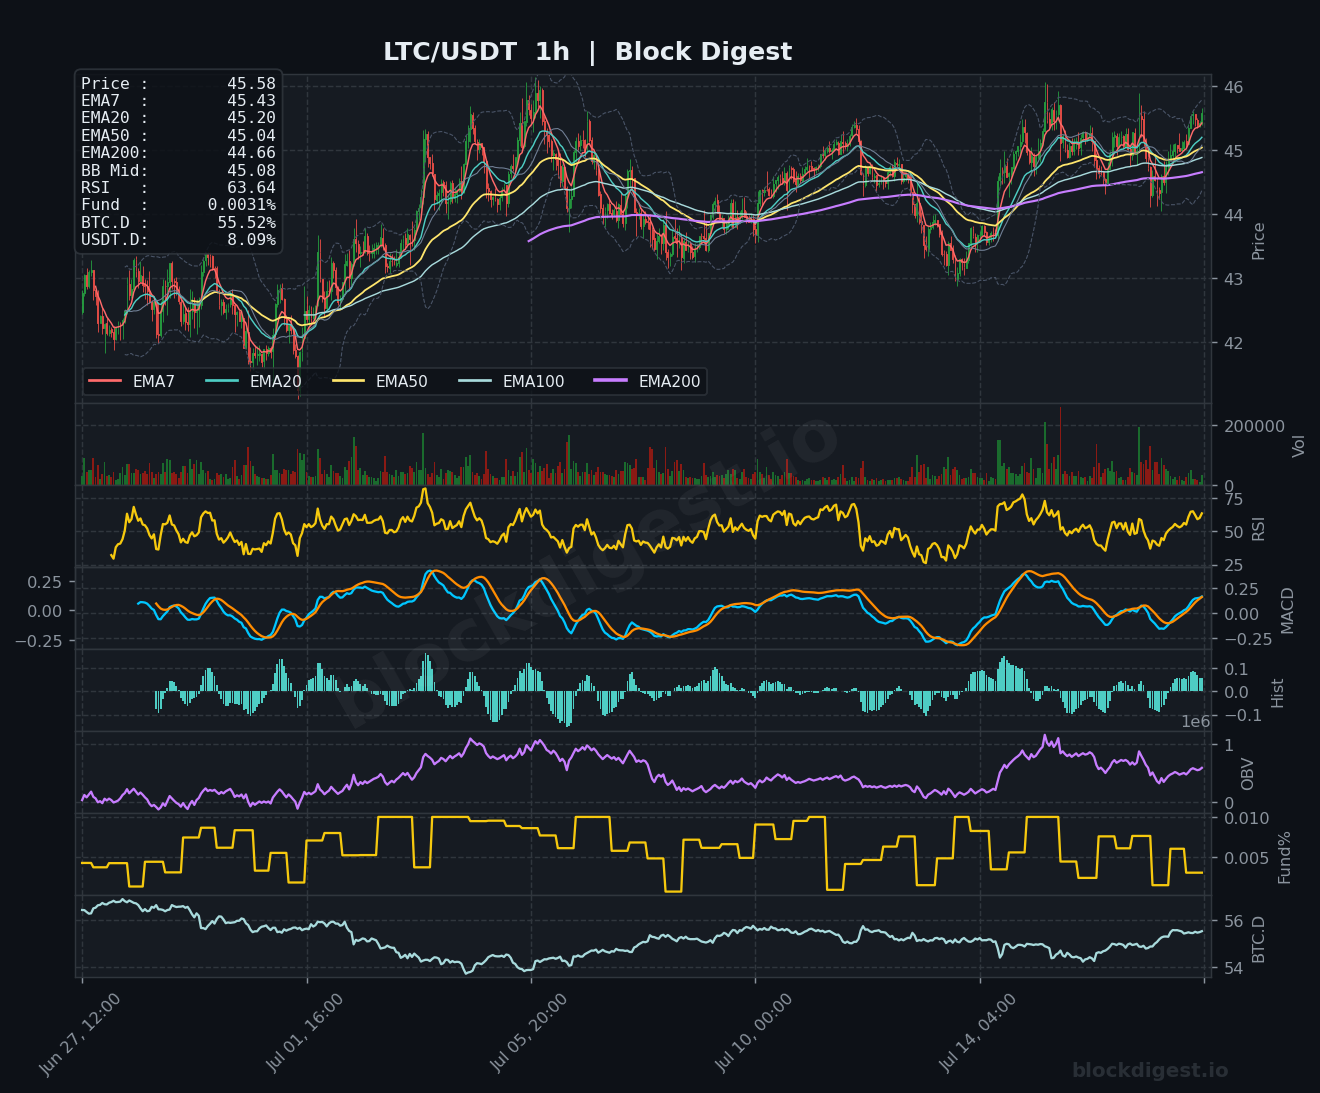
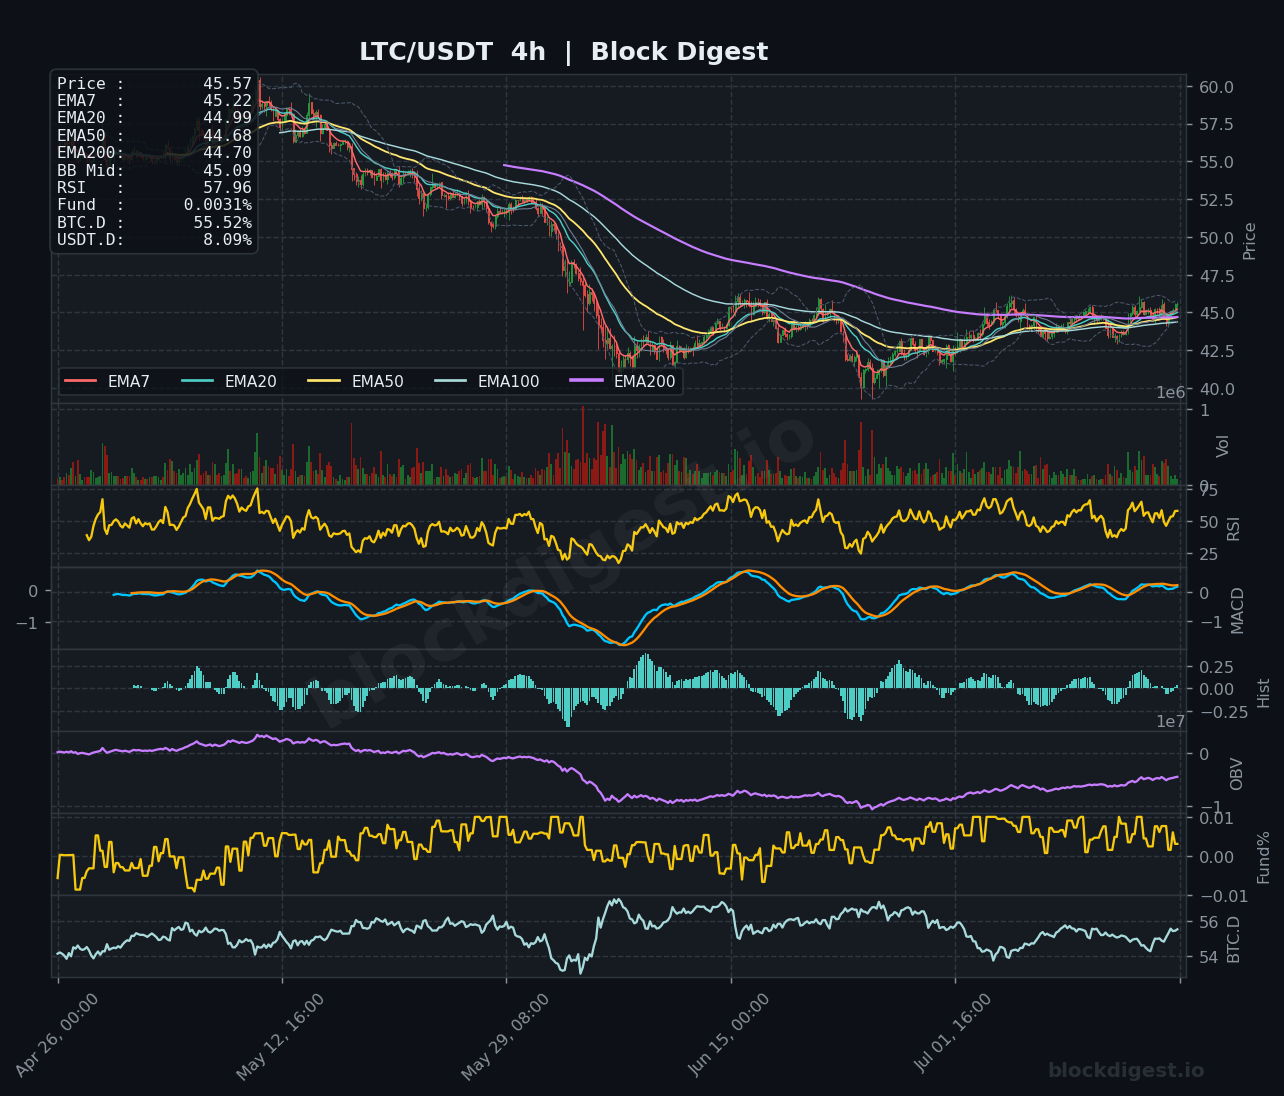
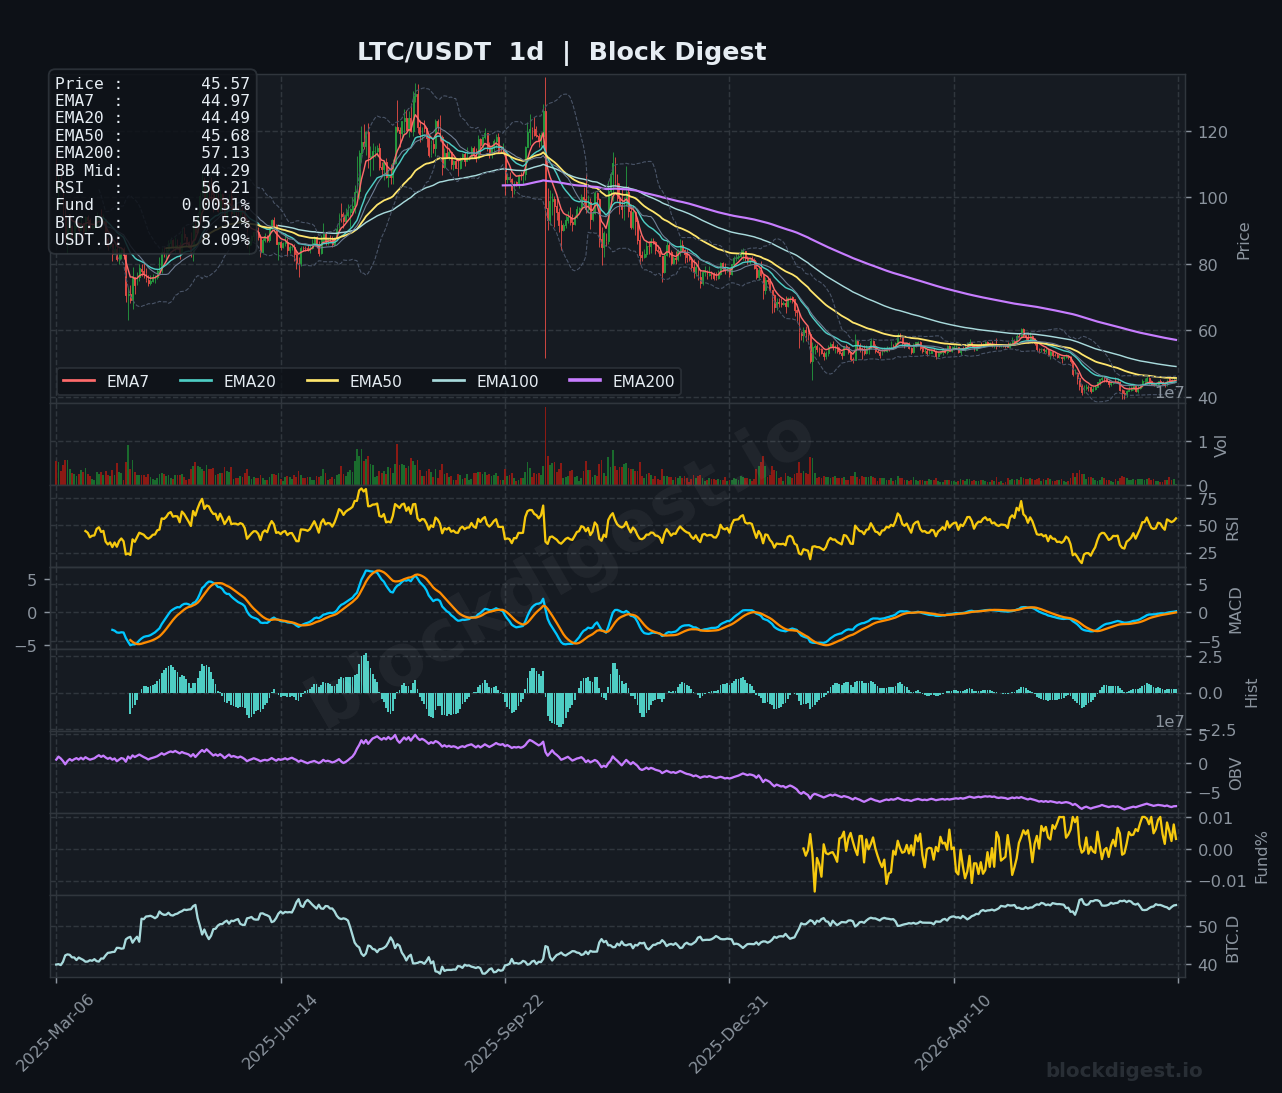
LTC is the relative standout among today’s cohort, trading at $45.57–$45.58 with price holding above all key short-term EMAs on the 1h chart — EMA7 ($45.43), EMA20 ($45.20), EMA50 ($45.04), and EMA200 ($44.66) — in a bullish alignment. The 1h RSI at 63.64 is the strongest reading across all six coins today, and the MACD histogram is printing positive bars, supporting the near-term upside bias. On the 4h timeframe, RSI at 57.96 confirms the momentum is constructive, though the OBV on the daily chart continues a longer-term downtrend, a reminder that the macro picture remains challenging. Immediate resistance sits at $46.00–$46.50; a sustained hold above $45.00 keeps the short-term bullish structure intact, with $44.00 as the key level to defend on any pullback.
TRON (TRX)
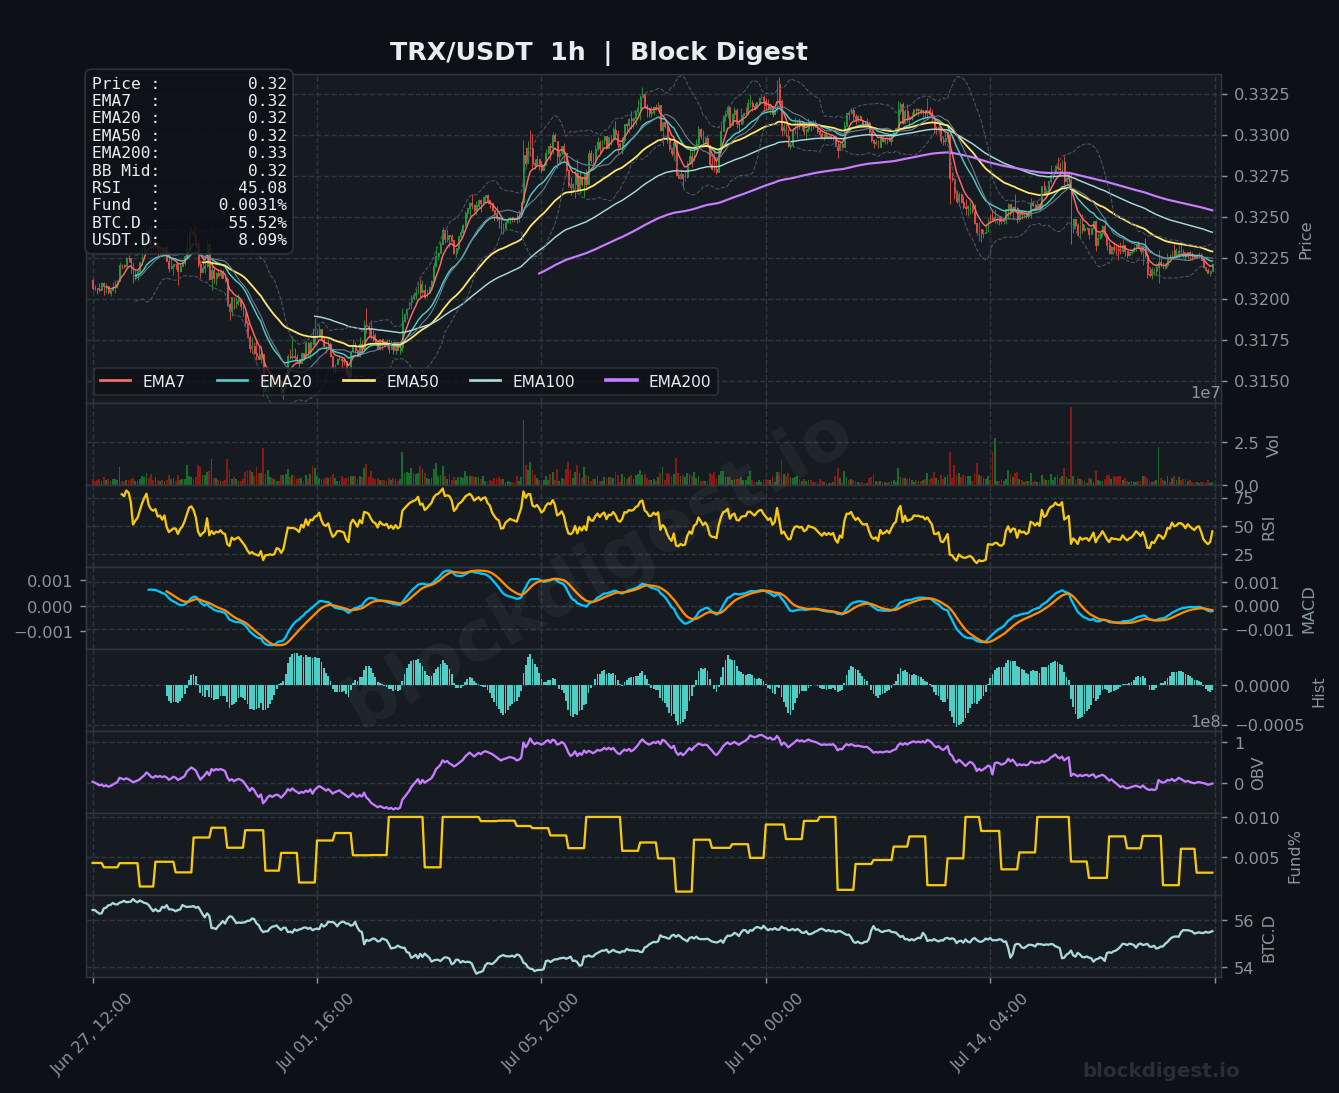
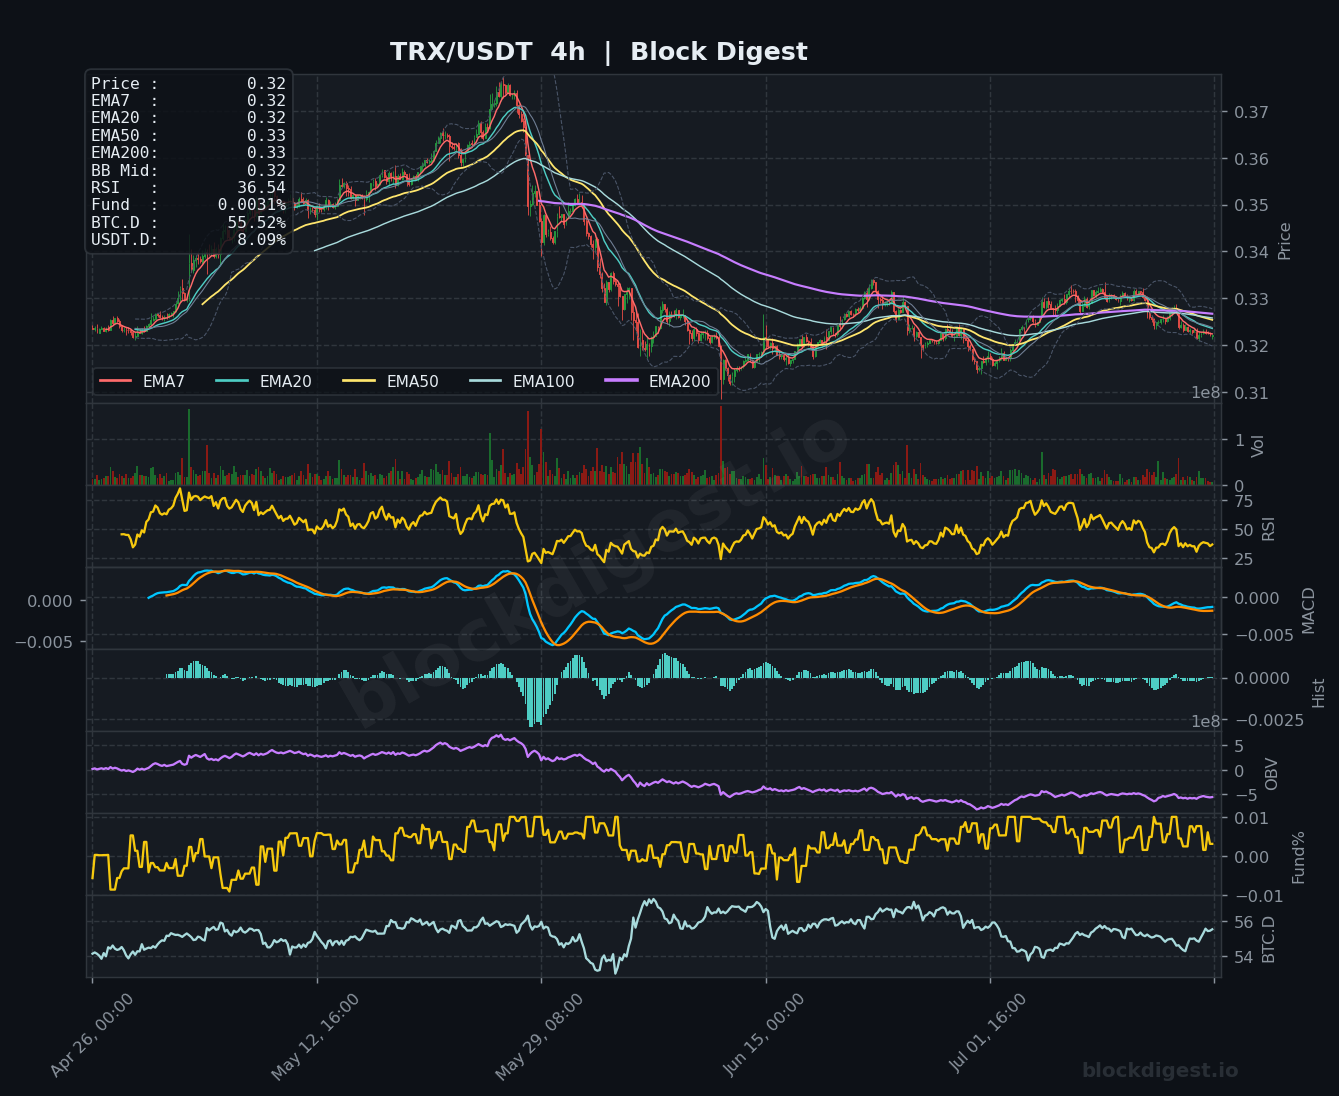
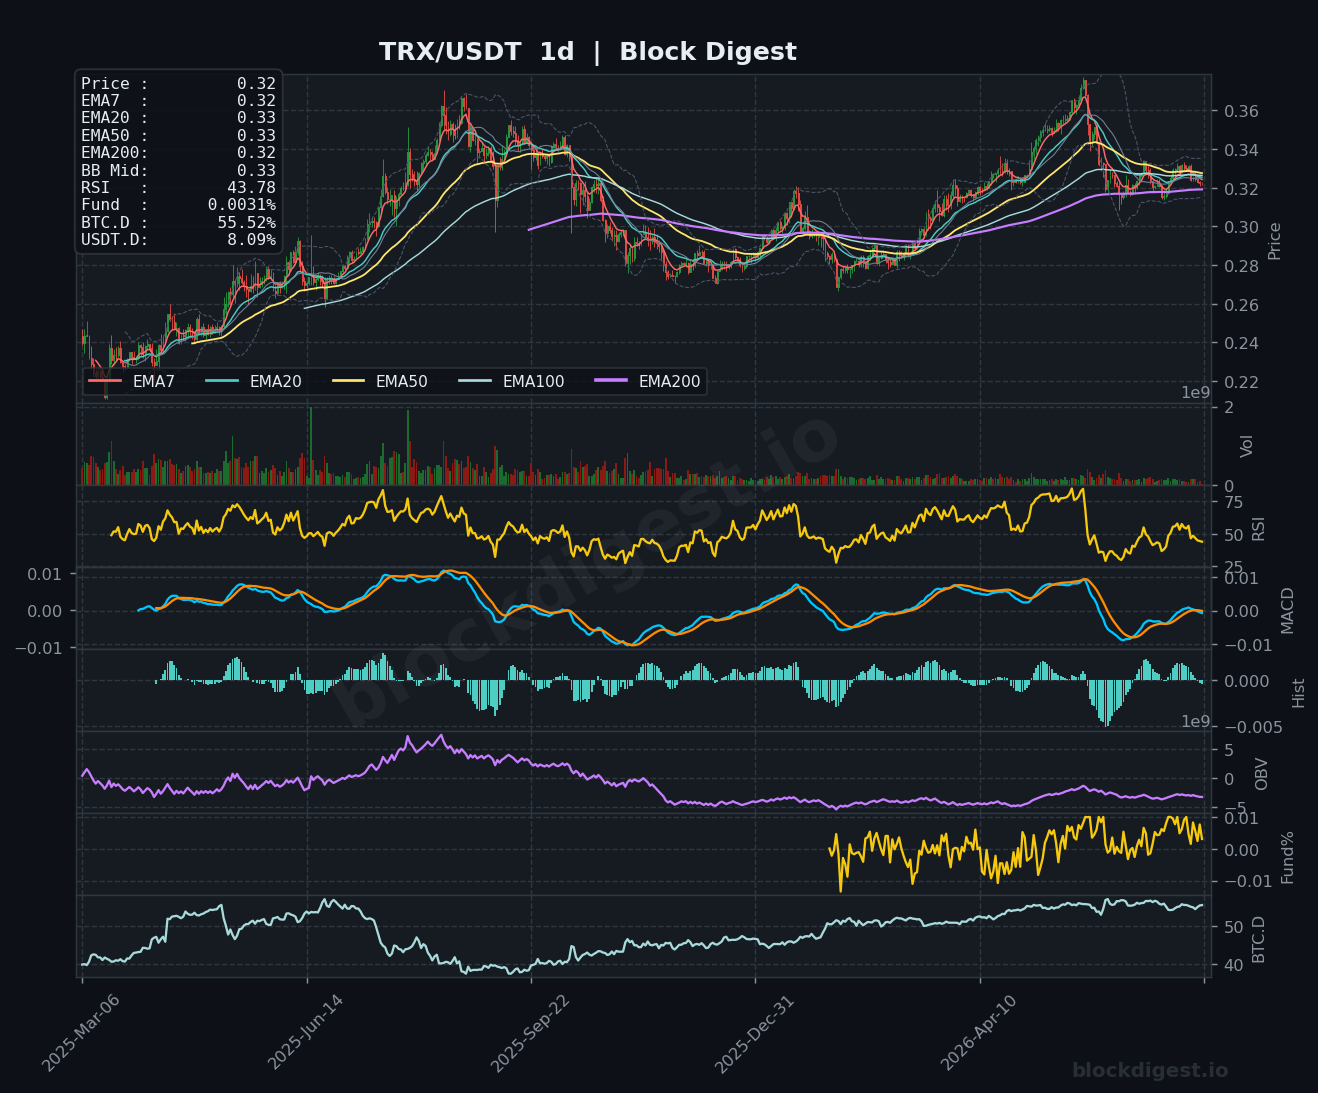
TRX is trading at $0.322, with the 1h chart showing price hugging the EMA7 and EMA20 just below the EMA200 ($0.33) — a subtle but notable bearish signal as the longer-term average continues to act as overhead resistance. The 1h RSI at 45.08 and 4h RSI at 36.54 reflect weakening momentum, with the 4h reading nearing oversold levels after a pullback from the $0.33 area. The daily chart provides some context for caution: while TRX has notably outperformed many altcoins on the macro timeframe — holding relatively well compared to SOL or DOGE — the recent daily MACD has rolled over with a bearish cross, and RSI at 43.78 confirms the near-term pressure. Support at $0.318–$0.320 is critical to hold; a break below could test $0.310, while recovery above $0.330 would reopen a push toward the recent highs near $0.336.
Altcoin Outlook
The broader altcoin picture as of July 18, 2026 is one of cautious consolidation under bearish macro pressure, with BTC dominance above 55% and elevated stablecoin levels constraining any sustained rally. Litecoin stands out as the strongest near-term setup, with bullish EMA alignment on the 1h chart and an RSI above 60 — a clear divergence from the rest of the field. SOL, BNB, and TRX show the most fragile structures technically, each trading below key EMAs with sub-50 RSI readings across multiple timeframes, while DOGE faces the most structurally challenged daily chart with RSI approaching oversold. For a broader altcoin recovery to take hold, markets will need to see USDT dominance pull back meaningfully from the 8% range and BTC dominance soften, which would serve as the key macro trigger to watch across the space.
Disclaimer: This analysis is for informational purposes only and does not constitute financial advice. Cryptocurrency markets are highly volatile and unpredictable. All trading decisions should be made based on your own research and risk tolerance. Block Digest is not responsible for any financial losses incurred as a result of acting on this content.