
Market Context
Bitcoin dominance is sitting at approximately 55.91% as of June 21, 2026, reflecting a persistent capital concentration in BTC that continues to weigh on broader altcoin performance. USDT dominance at 8.14% suggests that a meaningful portion of market capital remains parked in stablecoins, indicating cautious risk appetite rather than aggressive deployment into altcoins. The overall altcoin setup across the six coins reviewed today paints a picture of a market attempting localized recoveries from deeper structural downtrends, with selective short-term strength emerging but no convincing macro reversal in place.
Solana (SOL)
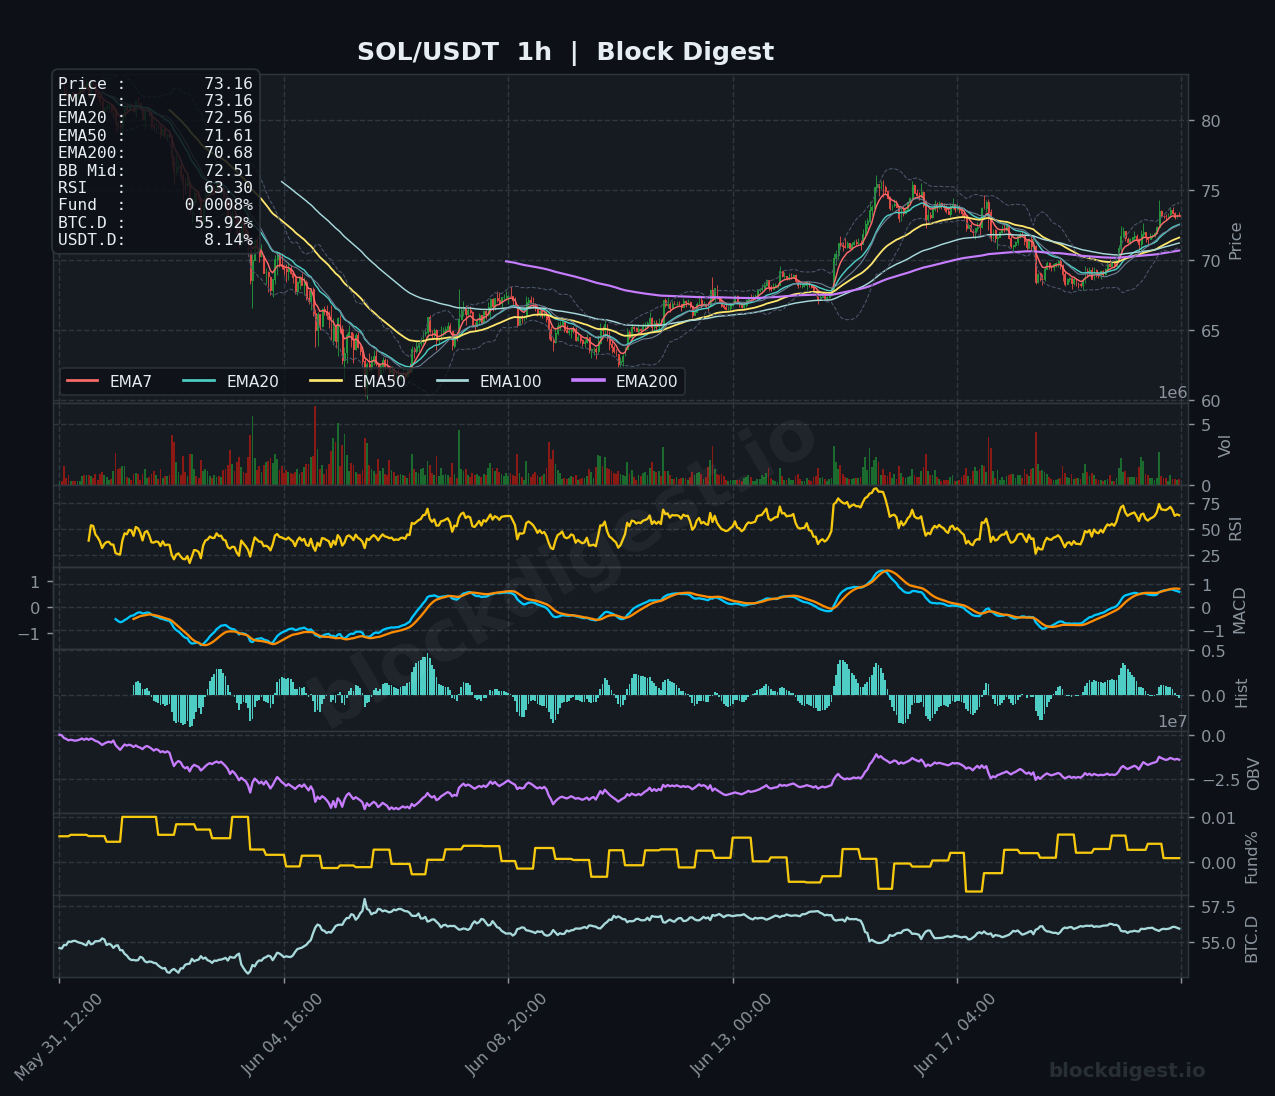
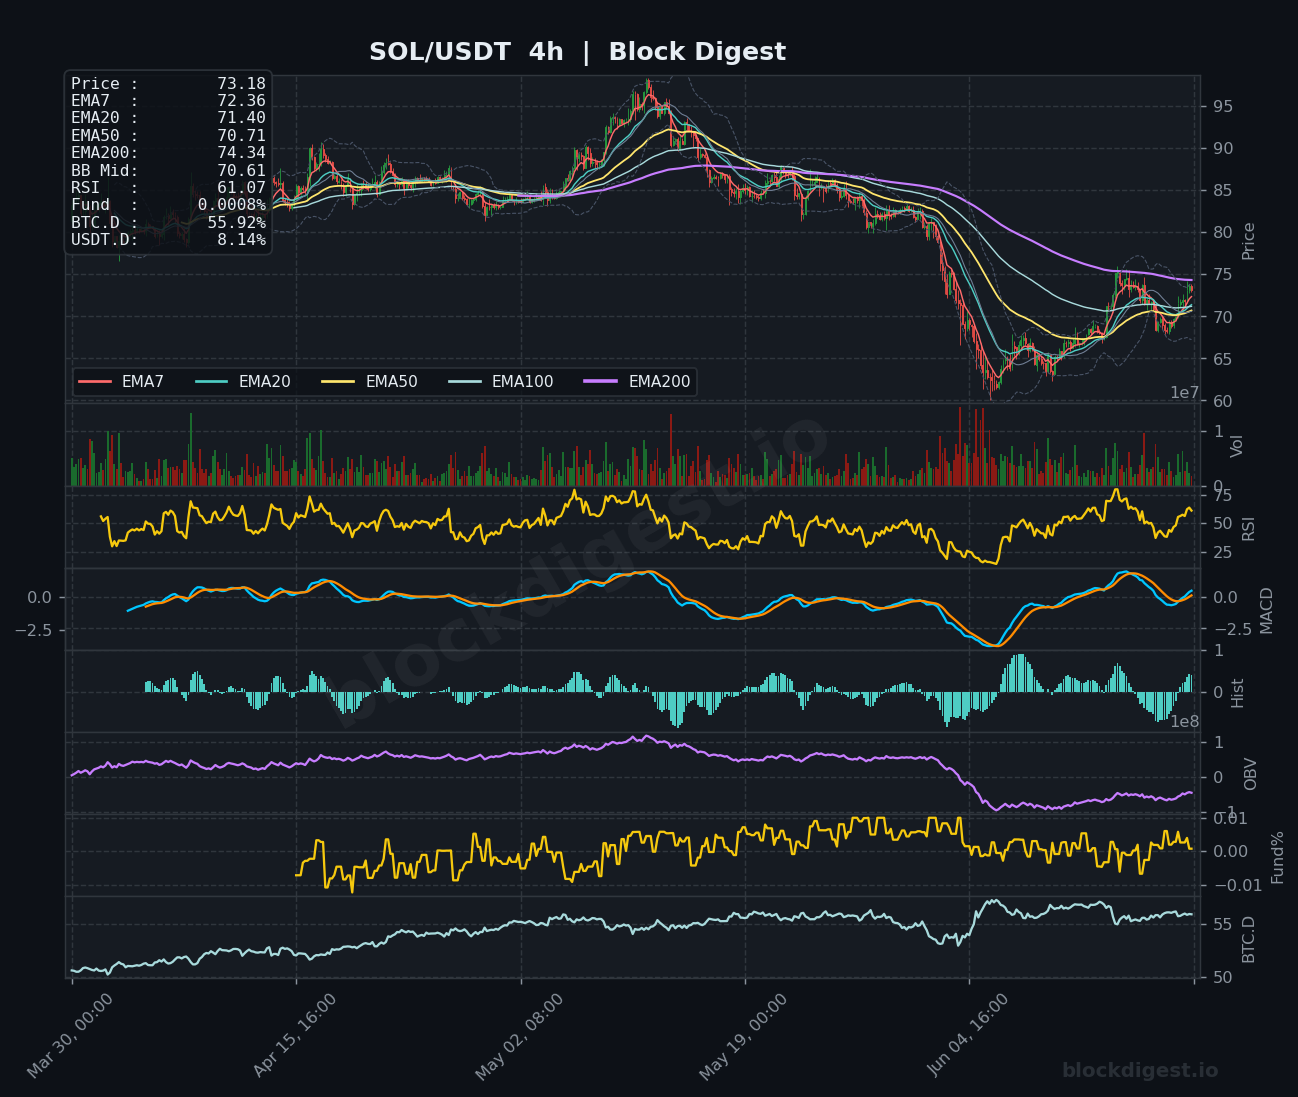
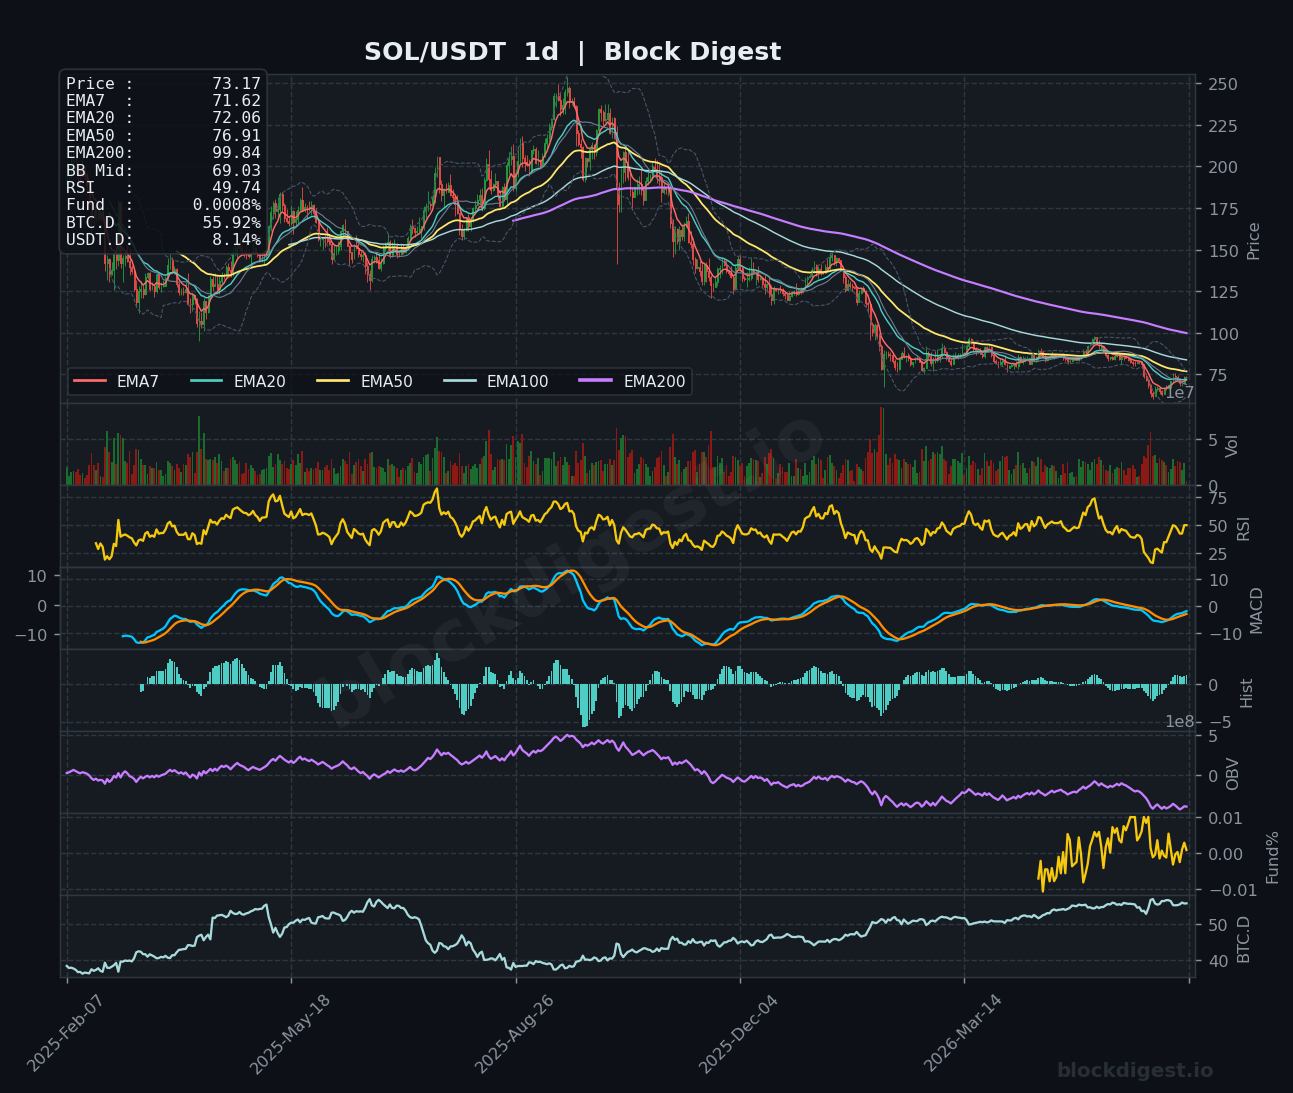
SOL is currently trading at $73.17, having rebounded off recent lows near $65 but now facing a dense cluster of overhead resistance with the EMA50 at $70.71 and EMA200 sitting well above at $99.84 on the daily chart, underscoring the severity of the longer-term downtrend. On the 1-hour frame, price is trading above all short-term EMAs with the EMA7 and EMA20 stacked bullishly at $73.16 and $72.56 respectively, and the RSI at 63.30 suggesting near-term momentum without yet entering overbought territory. The 4-hour MACD is crossing back toward positive territory after a deep bearish cycle, and OBV on that timeframe has begun to flatten and tick upward, hinting at improving accumulation. Immediate resistance lies around $75–$76 (daily EMA50); a failure to clear this zone would keep the short-term bias cautiously neutral, while a confirmed break above could target the $80 area.
XRP (XRP)
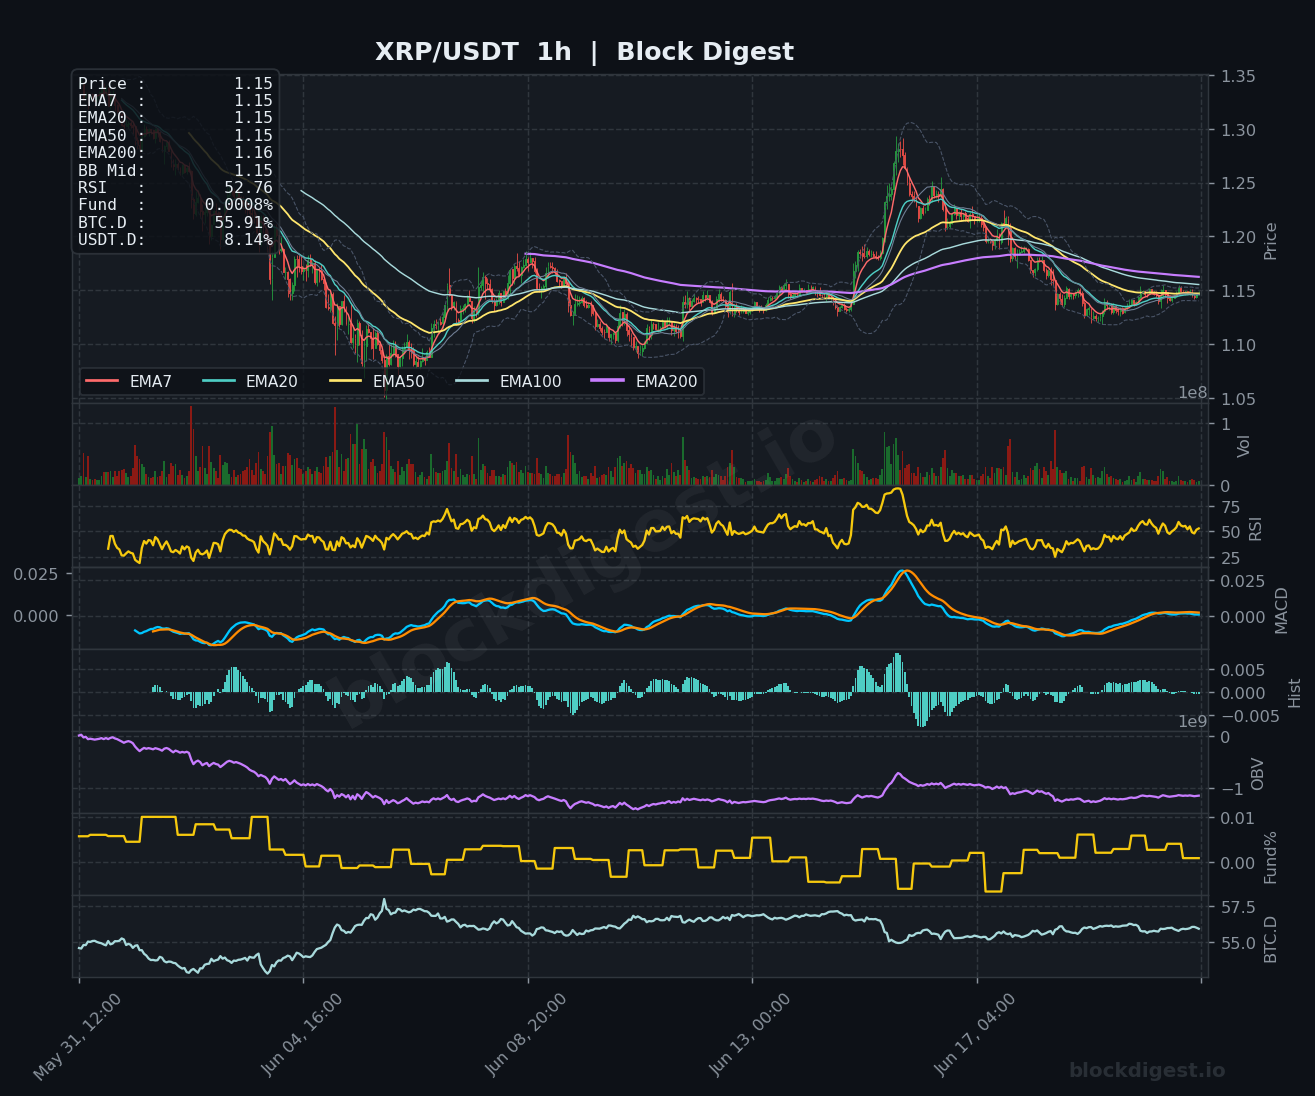
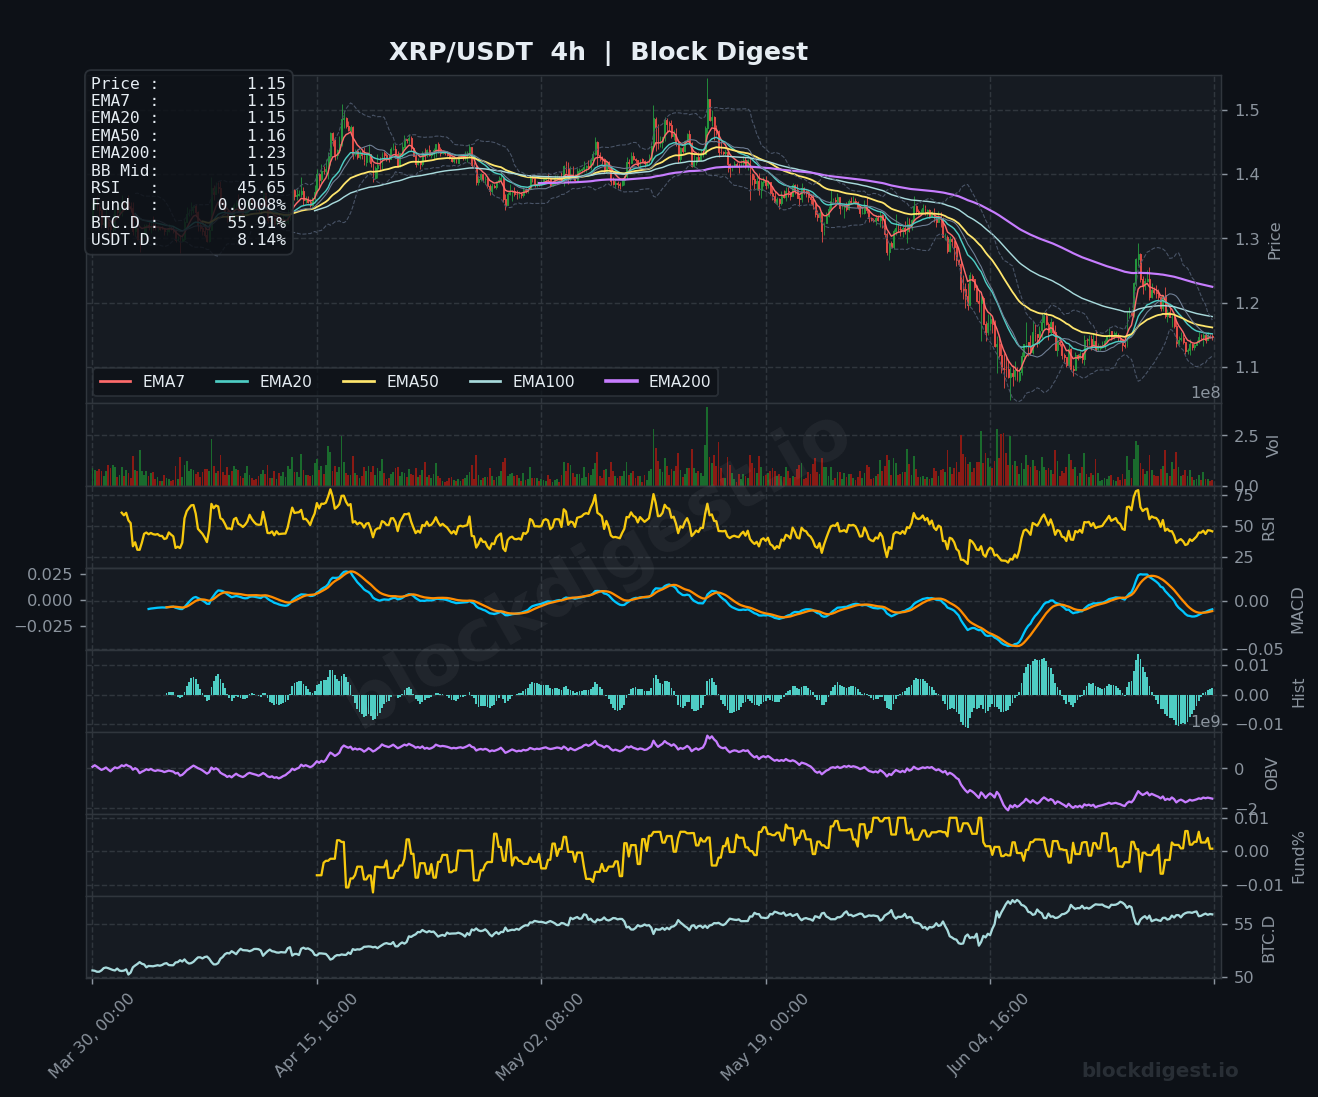
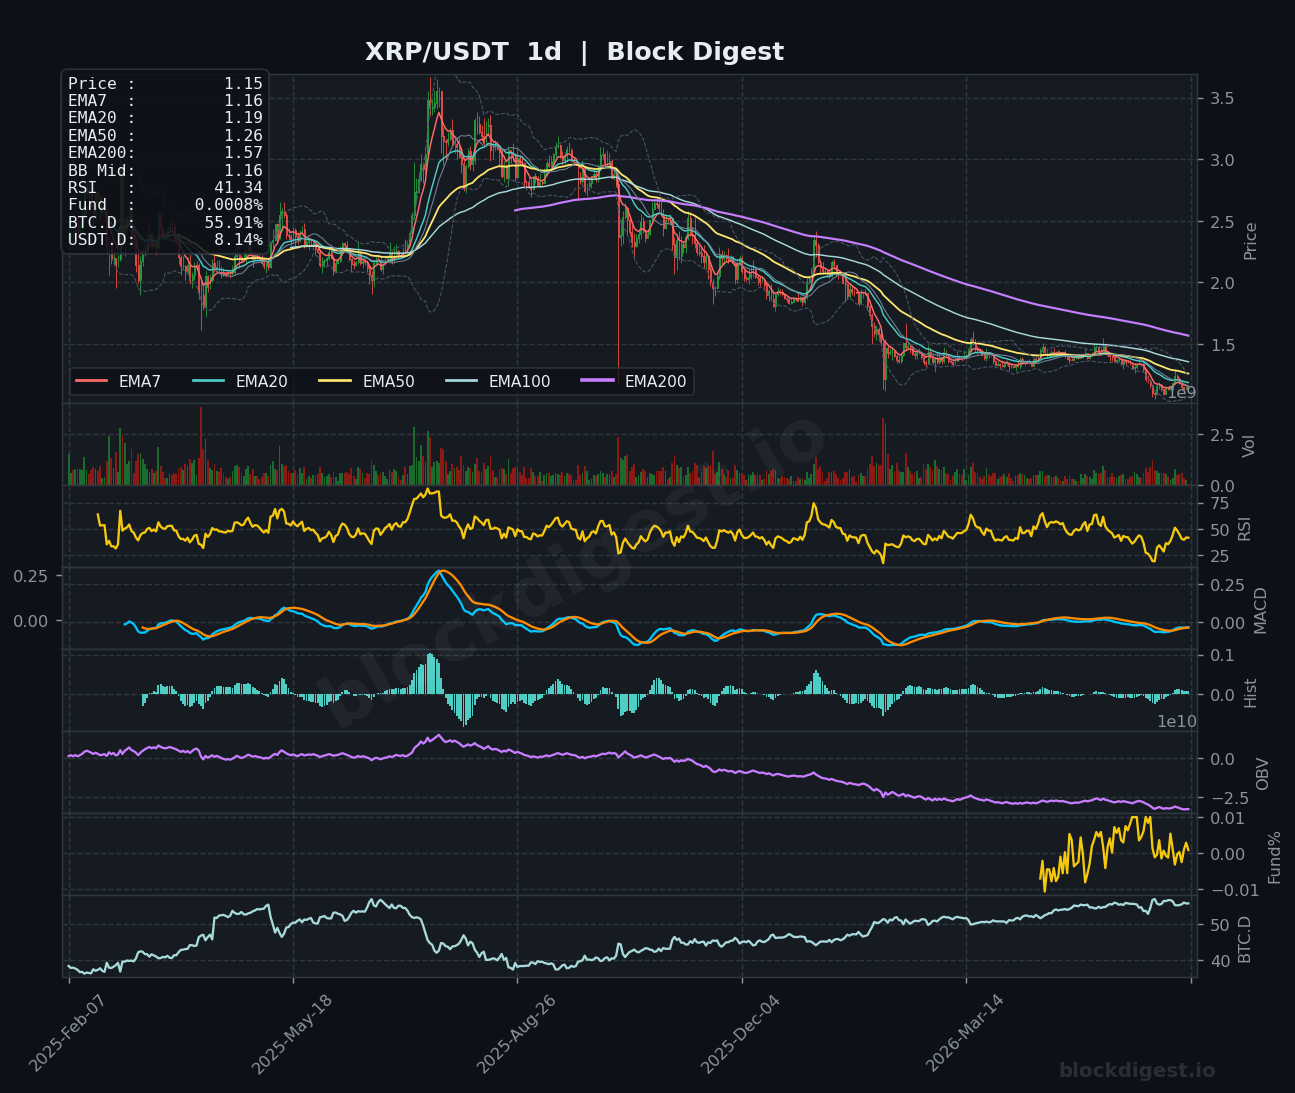
XRP is trading at $1.15, consolidated tightly near the BB midpoint on both the 1-hour and 4-hour charts, with all short-term EMAs (EMA7, EMA20, EMA50) converging at $1.15–$1.16, signaling a coil with a directional move potentially imminent. On the daily timeframe the picture is unambiguously bearish: price is below all major EMAs, with the EMA200 at $1.57 acting as distant overhead resistance, and the daily RSI has dropped to 41.34, approaching but not yet in oversold territory. The 4-hour RSI at 45.65 and MACD still negative — though beginning a tentative hook upward — suggest the corrective bounce is fragile at best. Key support to watch is the $1.10–$1.12 zone; any decisive break below that level risks accelerating selling pressure, while a reclaim of $1.20 is needed to shift the short-term bias neutral-to-bullish.
BNB (BNB)
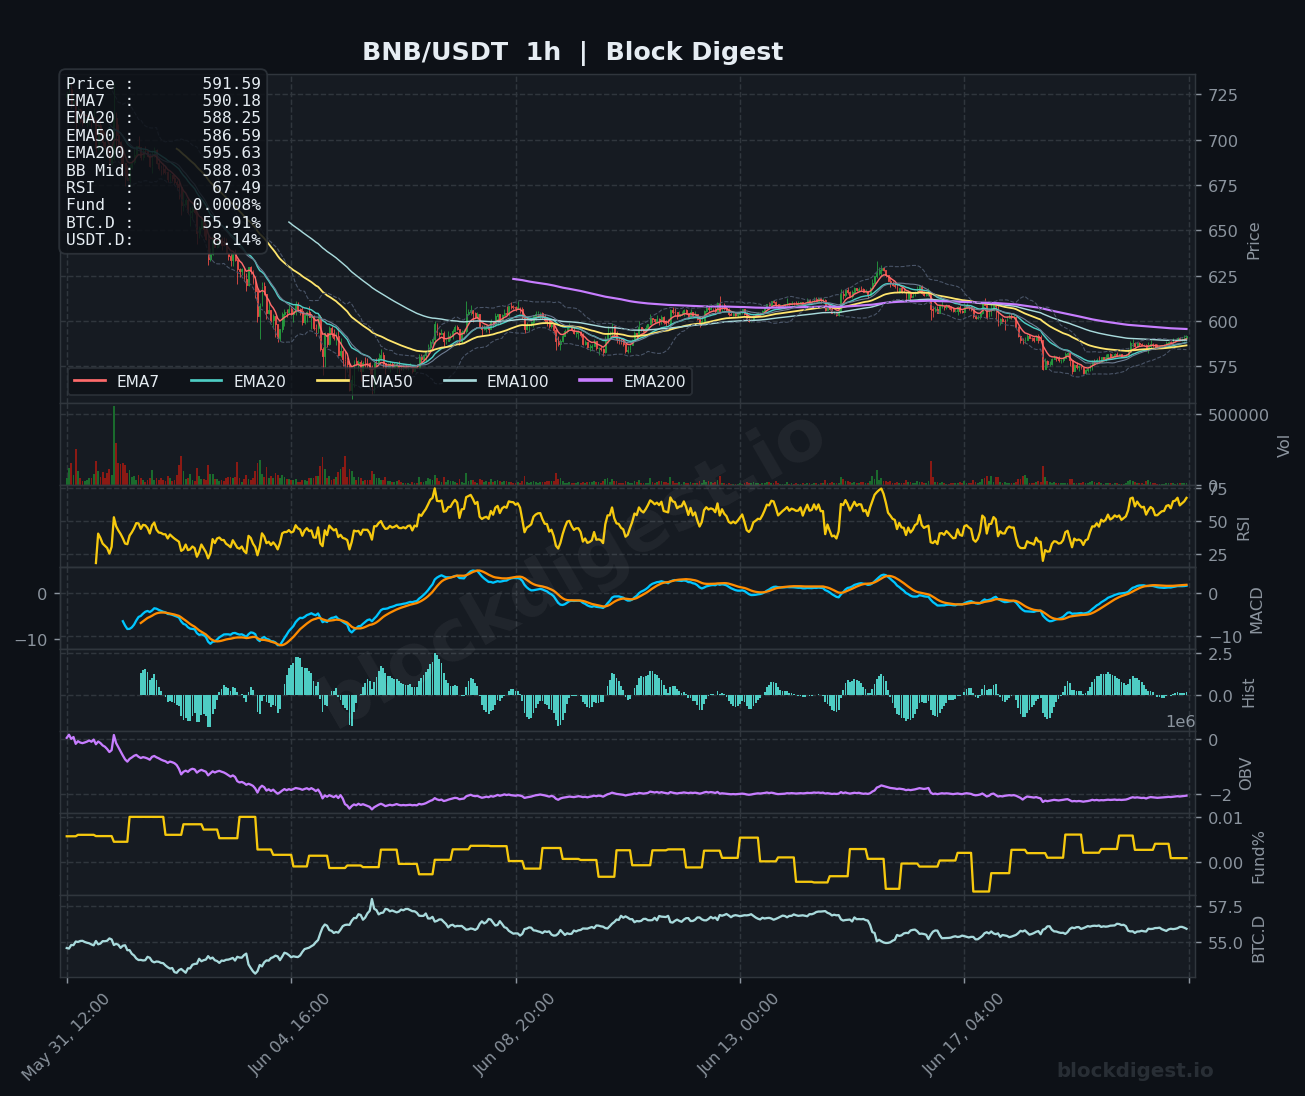
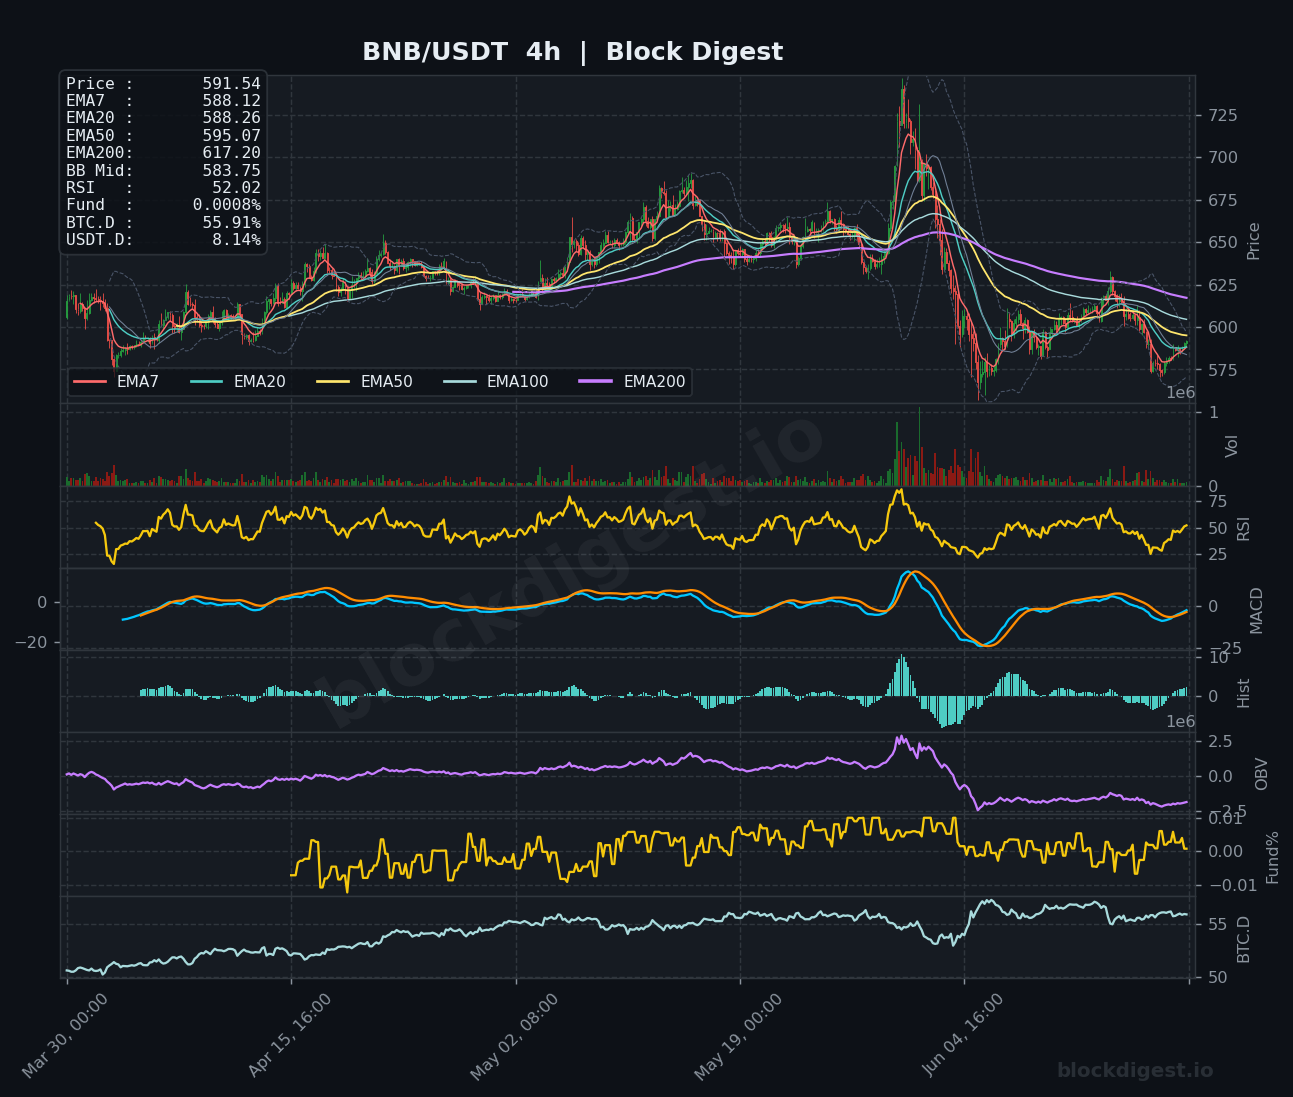
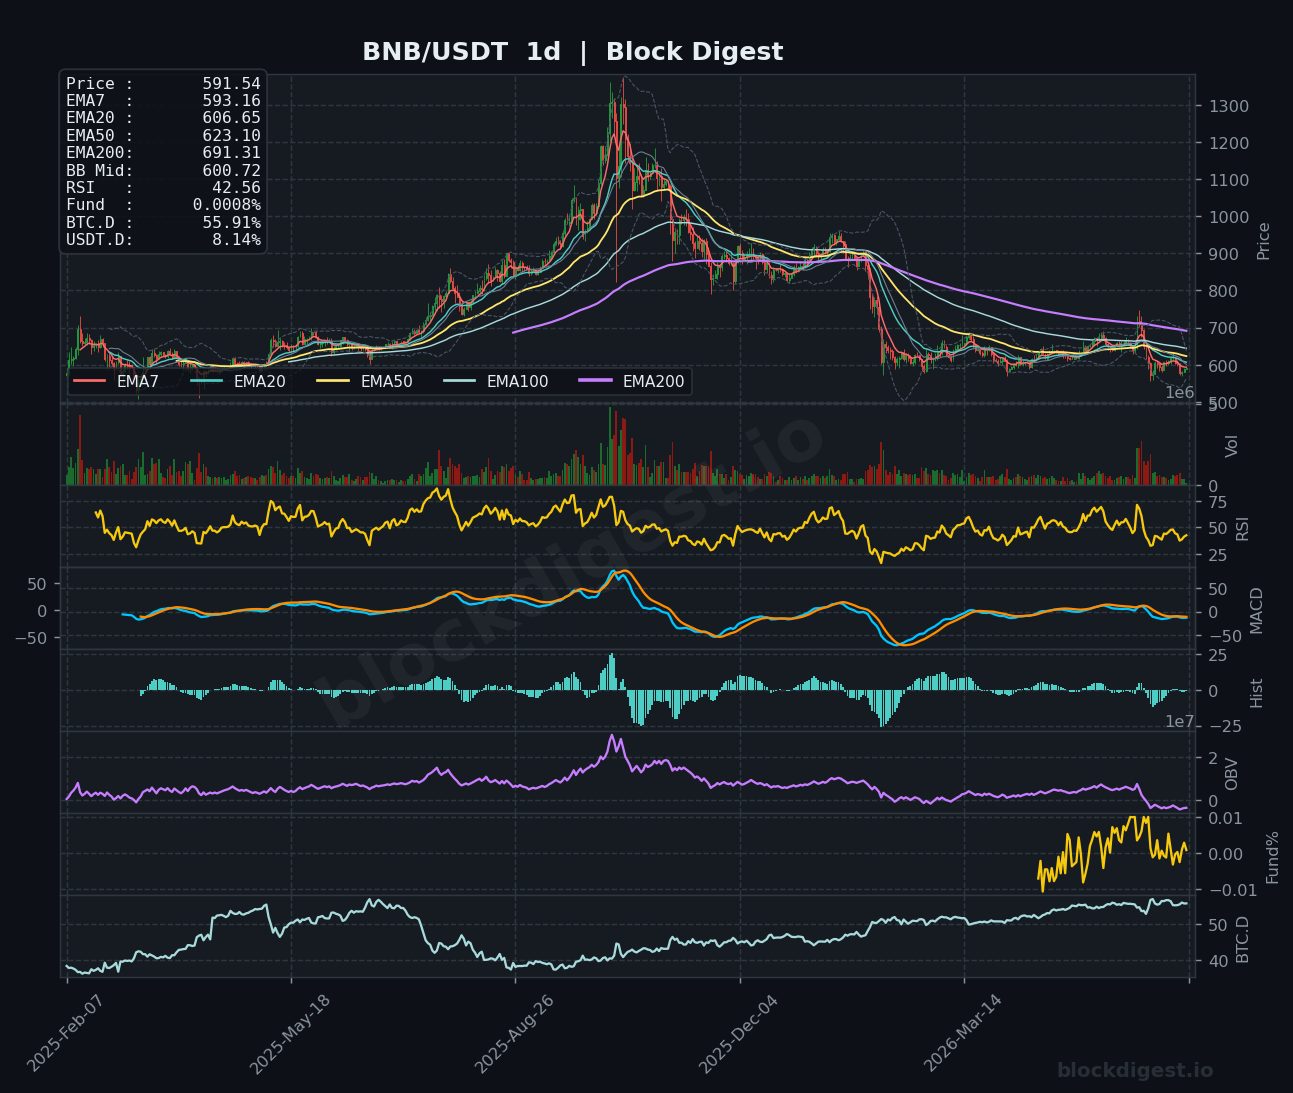
BNB is trading at $591.54, showing relative strength compared to many peers as the 1-hour RSI climbs to 67.49 and price holds above its short-term EMA stack (EMA7 at $590.18, EMA20 at $588.25, EMA50 at $586.59), all of which are now in bullish alignment. The 4-hour chart tells a more cautious story: price has recovered from a sharp flush to around $565 but now approaches overhead resistance at the EMA50 ($595.07) and EMA200 ($617.20), and the 4-hour MACD remains marginally negative despite a bullish histogram crossover forming. On the daily chart, RSI at 42.56 and price below both the EMA20 ($606.65) and EMA50 ($623.10) confirm BNB remains in a broader corrective phase after its peak, with the daily MACD still bearish. The short-term bias is mildly bullish given intraday momentum, but the $595–$625 zone represents a significant resistance band that needs to be absorbed before any meaningful recovery can be declared.
Dogecoin (DOGE)
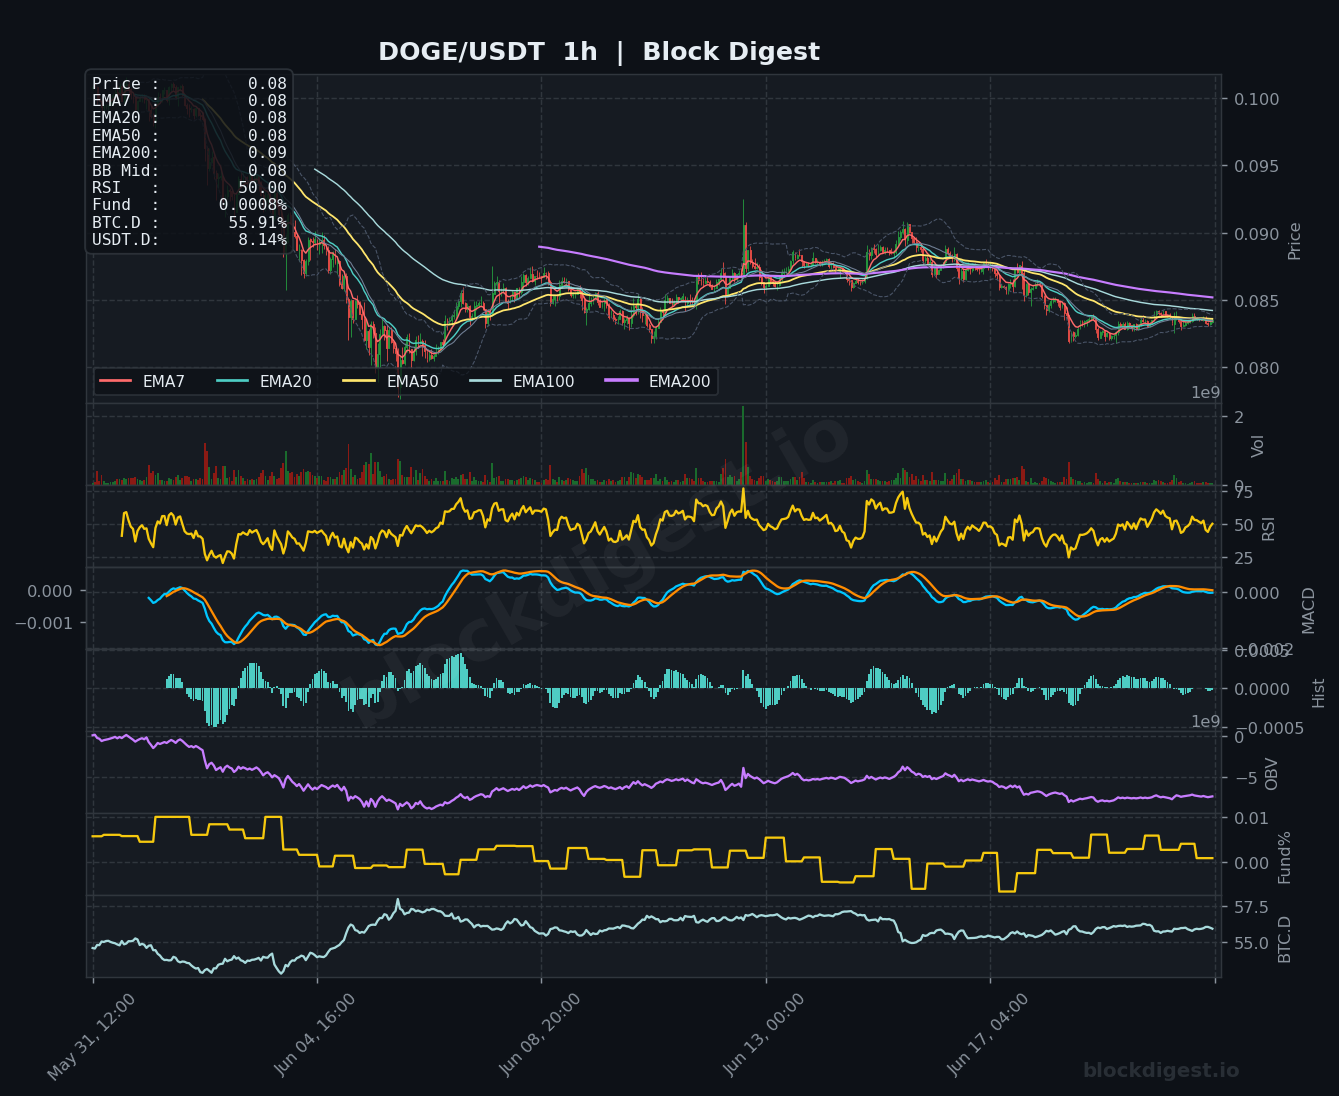
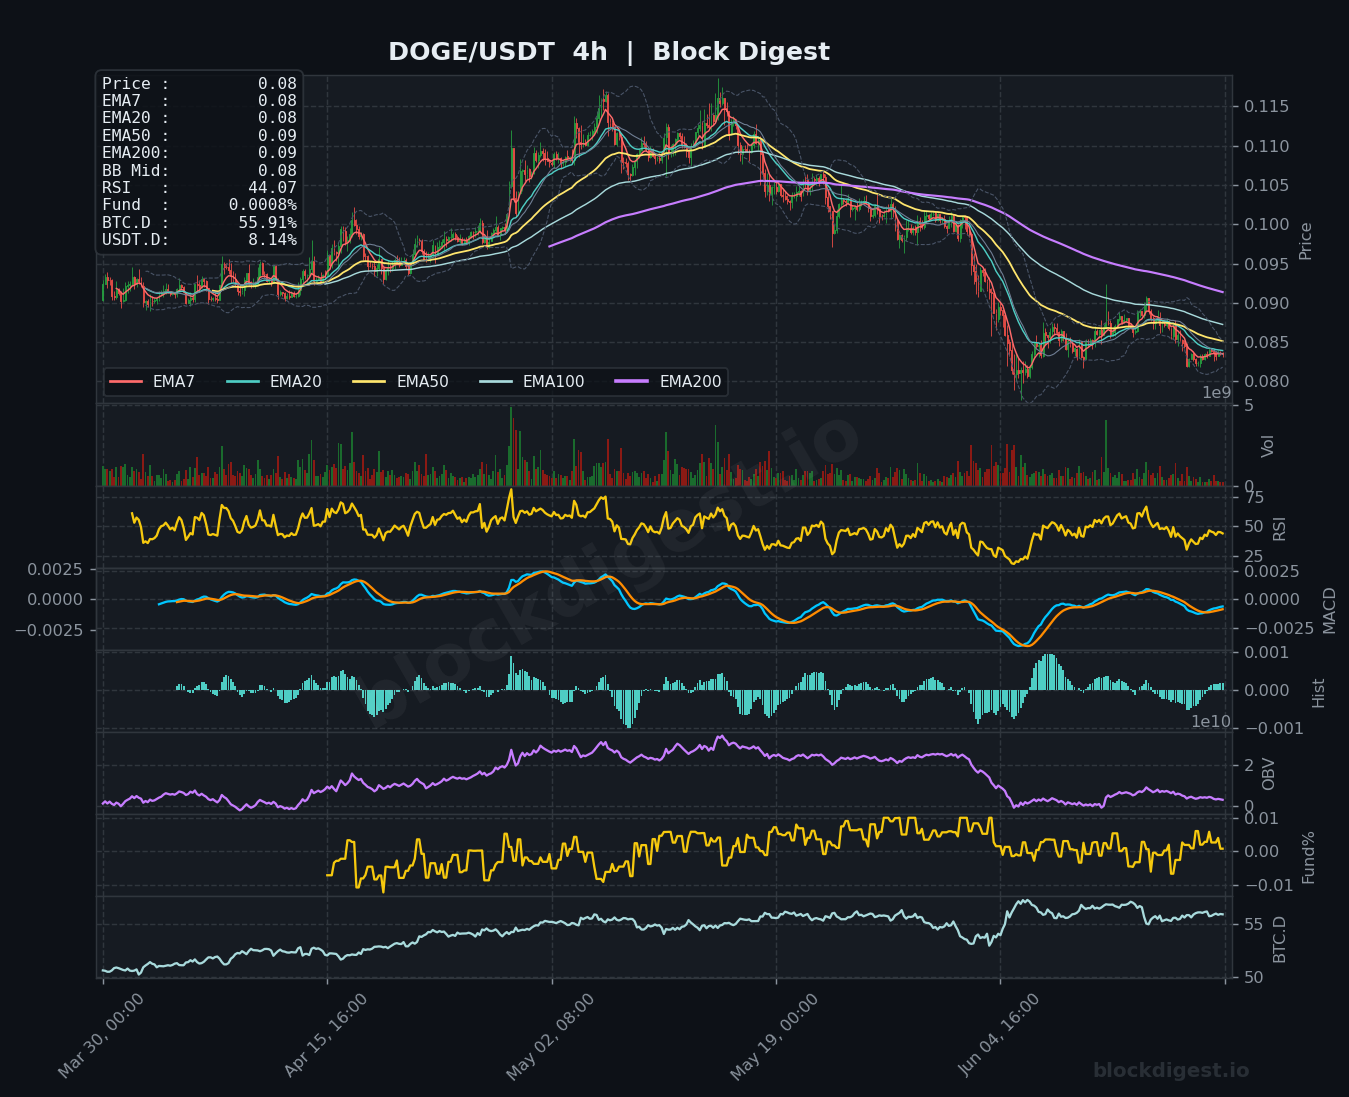
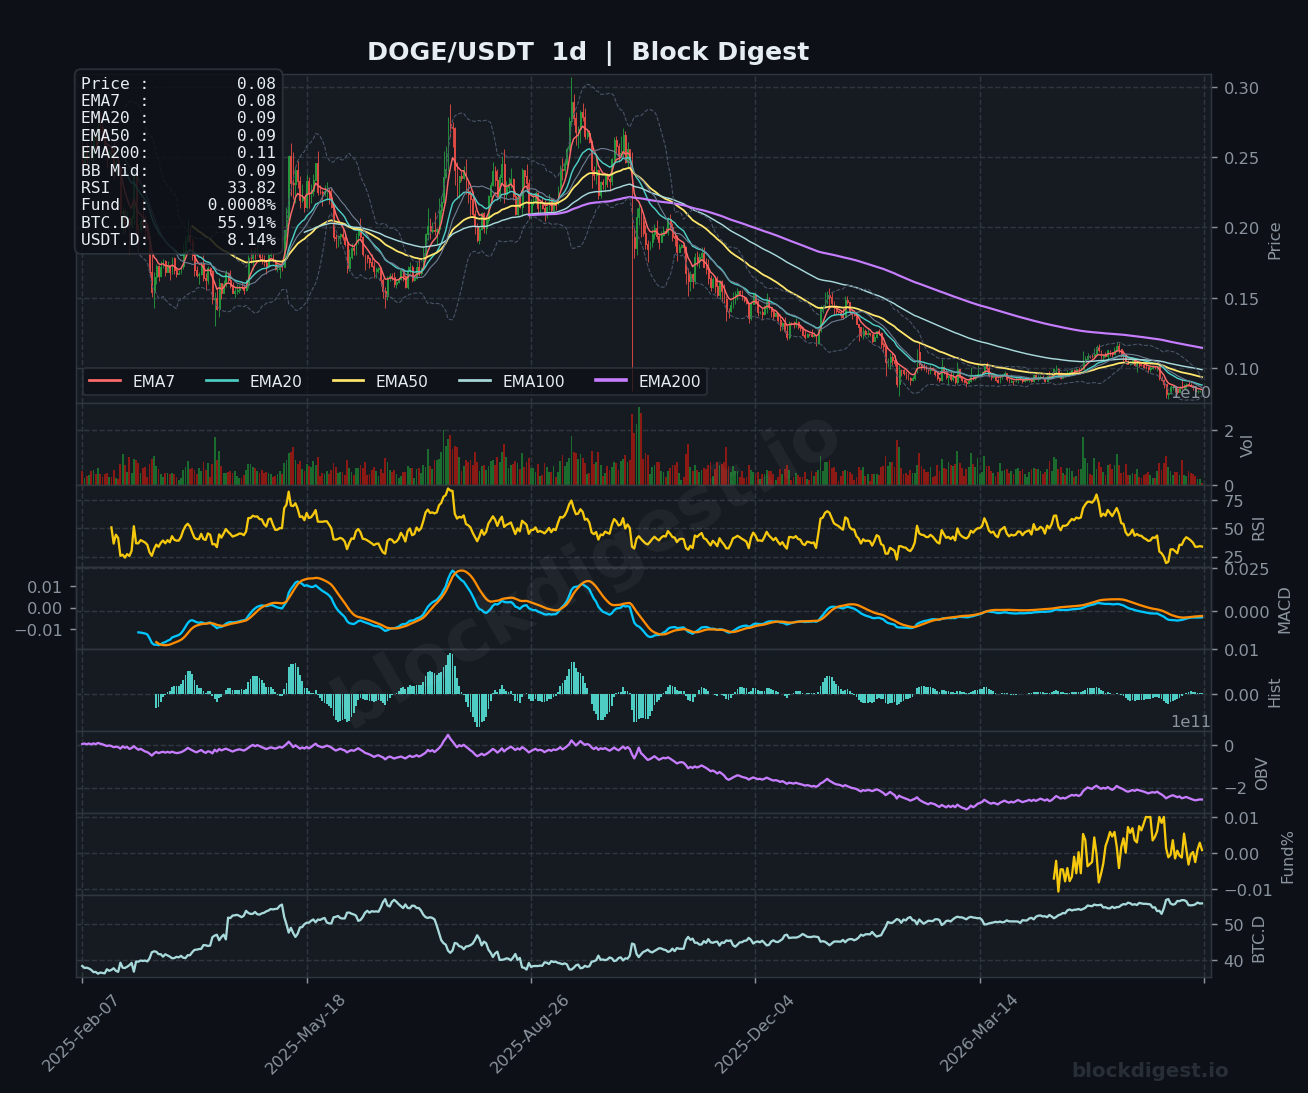
DOGE is trading at $0.0840, hovering near the lower end of its recent range with the 1-hour RSI sitting at an exactly neutral 50.00 and price essentially flat-lining across the EMA7, EMA20, and EMA50, all converged at $0.08. The 4-hour chart shows RSI at 44.07 with the MACD just barely turning positive from deep negative territory, while the price remains well below the EMA50 ($0.09) and EMA200 ($0.09), indicating the recent bounce lacks conviction. The daily chart is the most concerning: RSI at 33.82 is approaching oversold levels, the daily MACD remains bearish, and OBV has been in persistent decline, suggesting that selling pressure has not fully exhausted. DOGE needs to reclaim $0.088–$0.090 on a sustained basis to attract meaningful buying interest; absent that, the path of least resistance remains downward toward the $0.078–$0.080 support band.
Litecoin (LTC)
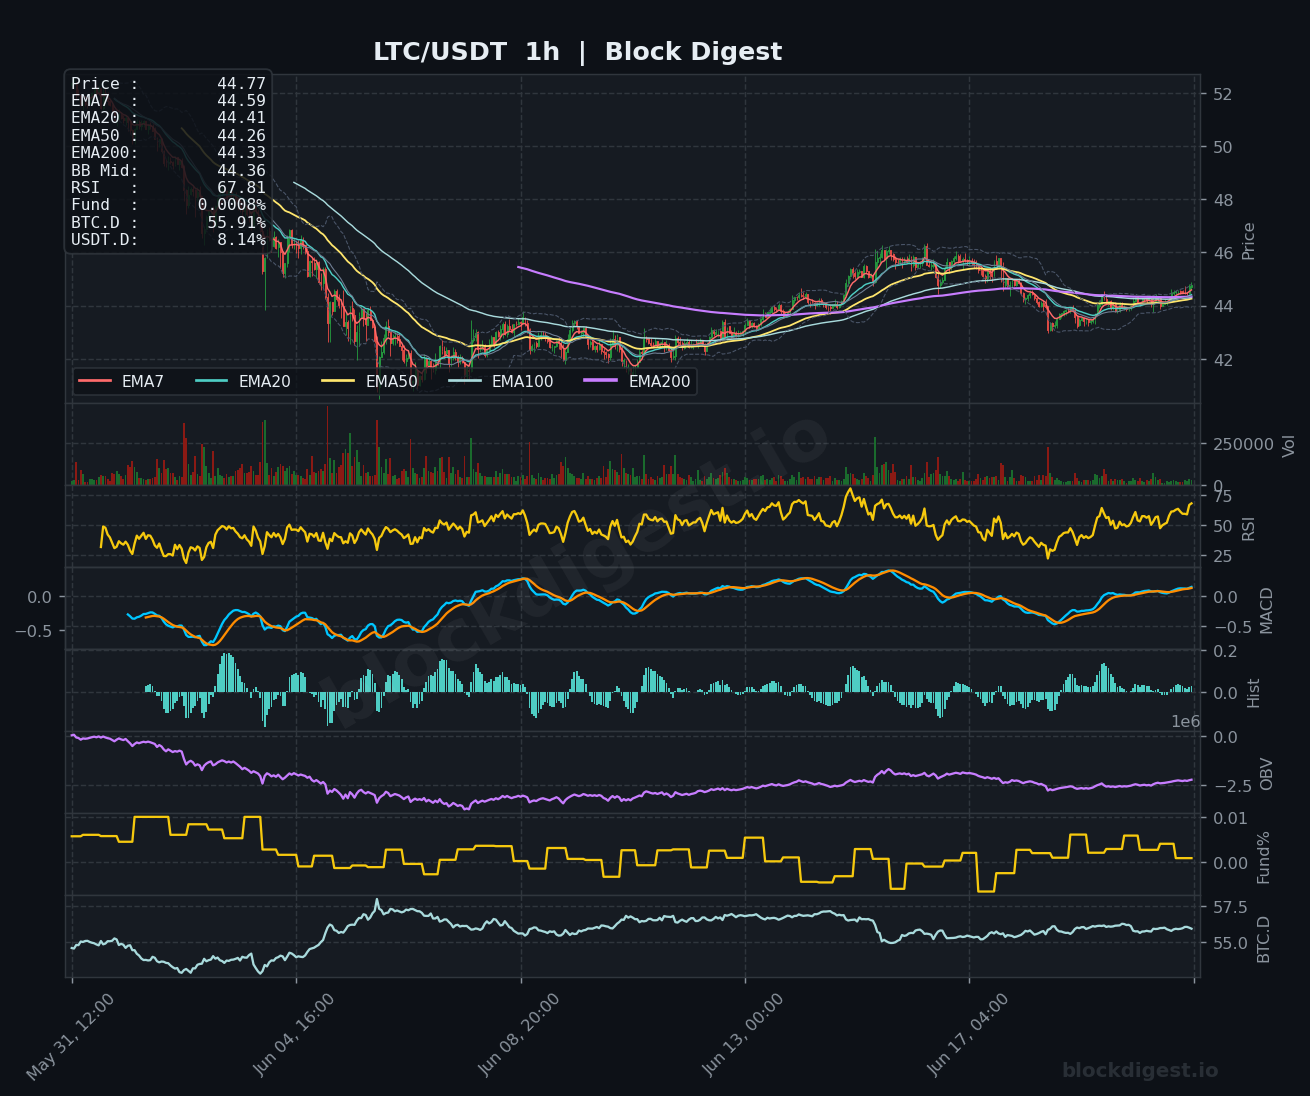
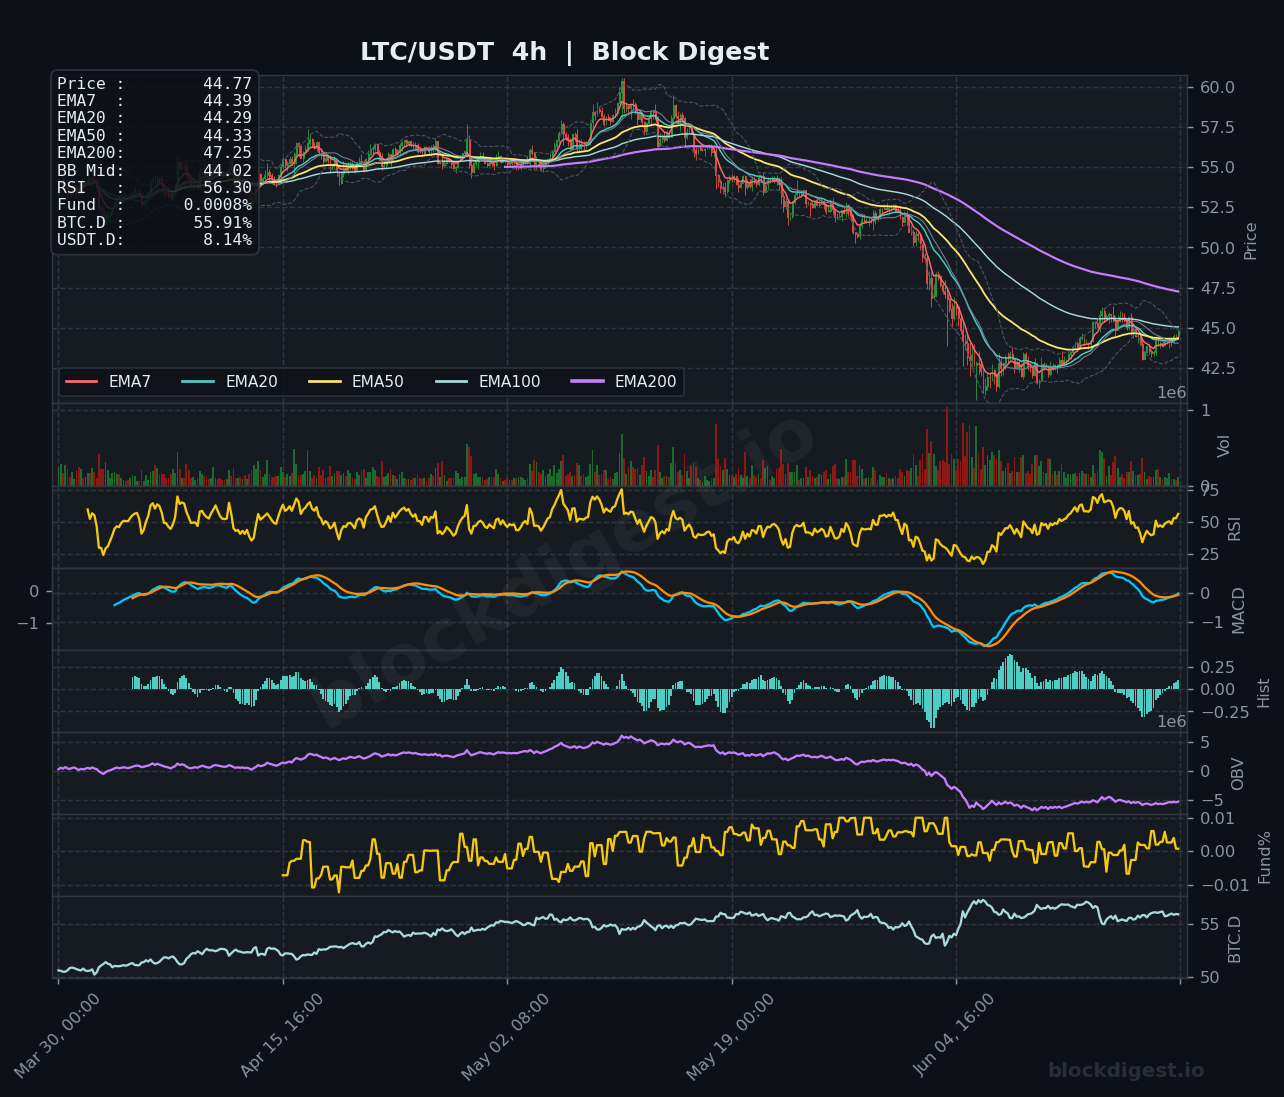
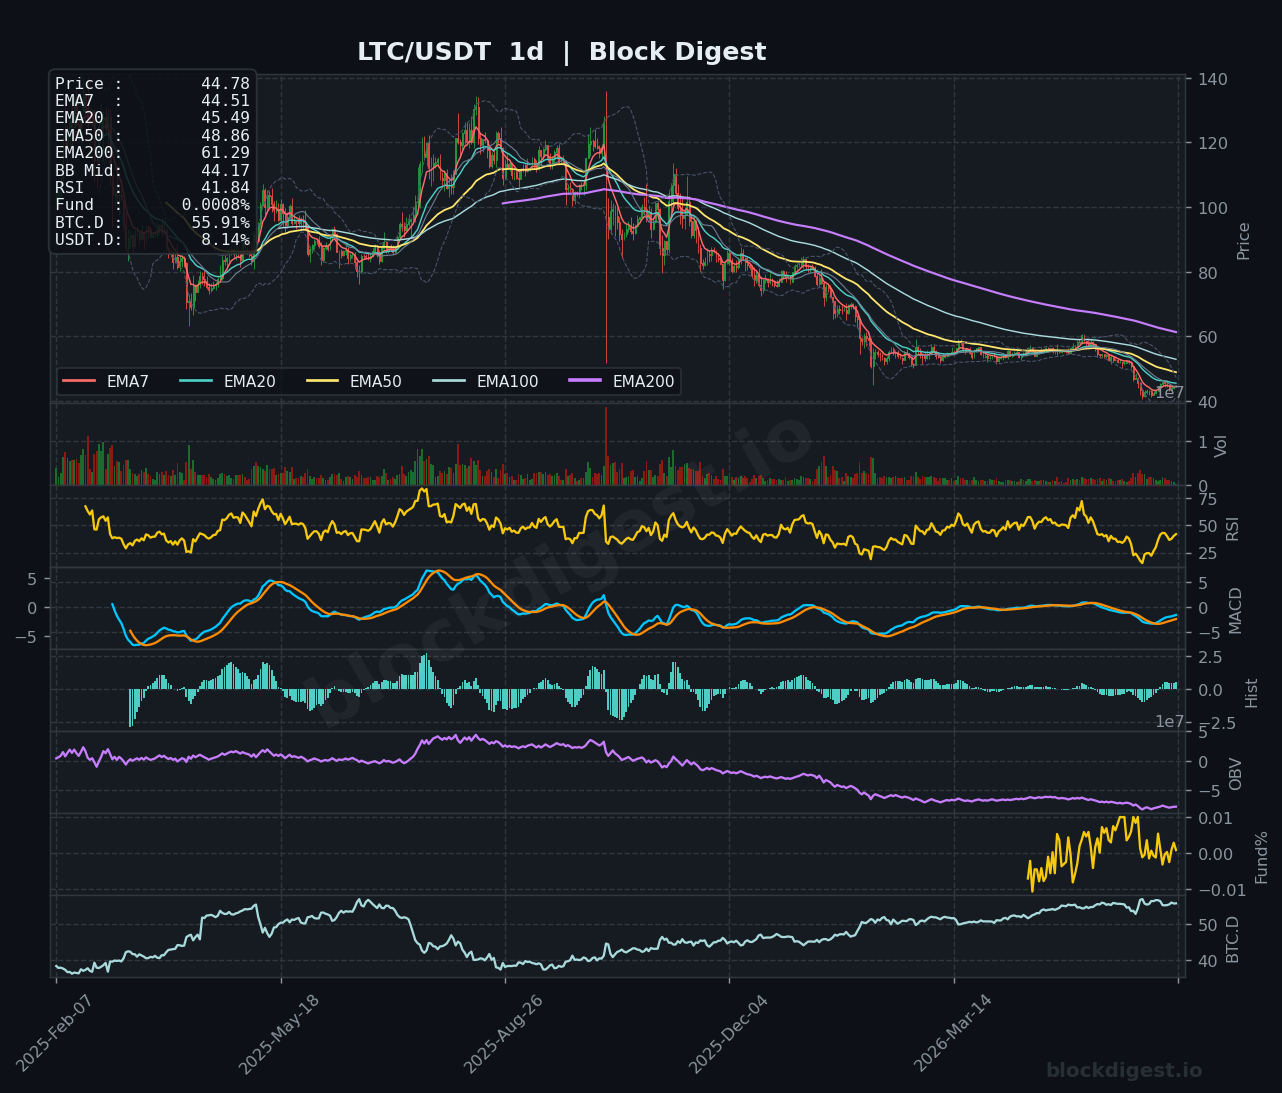
LTC is trading at $44.77, and the 1-hour chart shows an encouraging setup with RSI at 67.81 and all short-term EMAs in bullish alignment — EMA7 ($44.59), EMA20 ($44.41), EMA50 ($44.26), and even the EMA200 ($44.33) — tightly stacked in a near-golden configuration, suggesting the short-term trend has turned constructive. The 4-hour RSI at 56.30 is building above the midline and the MACD is making a positive crossover attempt after bottoming near -1.0, providing additional confirmation that recovery momentum is building on the intermediate timeframe. However, the daily chart remains challenging: RSI at 41.84, price below EMA20 ($45.49), EMA50 ($48.86), and EMA200 ($61.29), with OBV in a sustained downtrend reflecting persistent distribution over the longer term. The $46–$48 zone is immediate resistance; a clean break through that range would be a constructive development, but the daily structural backdrop warrants caution against reading too deeply into the intraday bounce.
TRON (TRX)
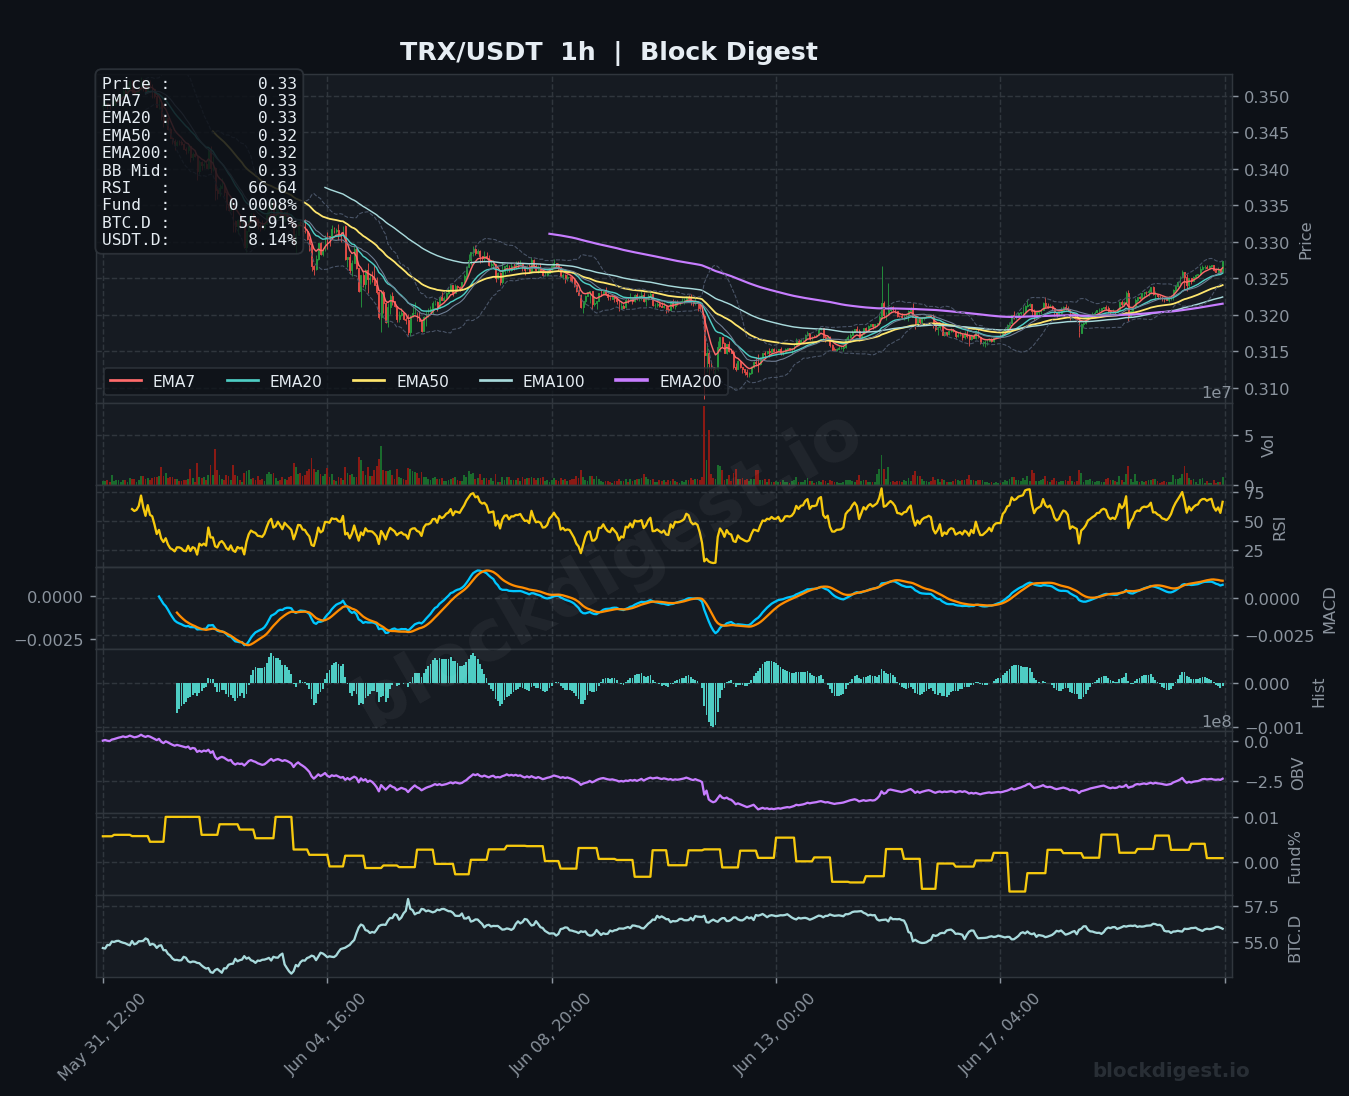
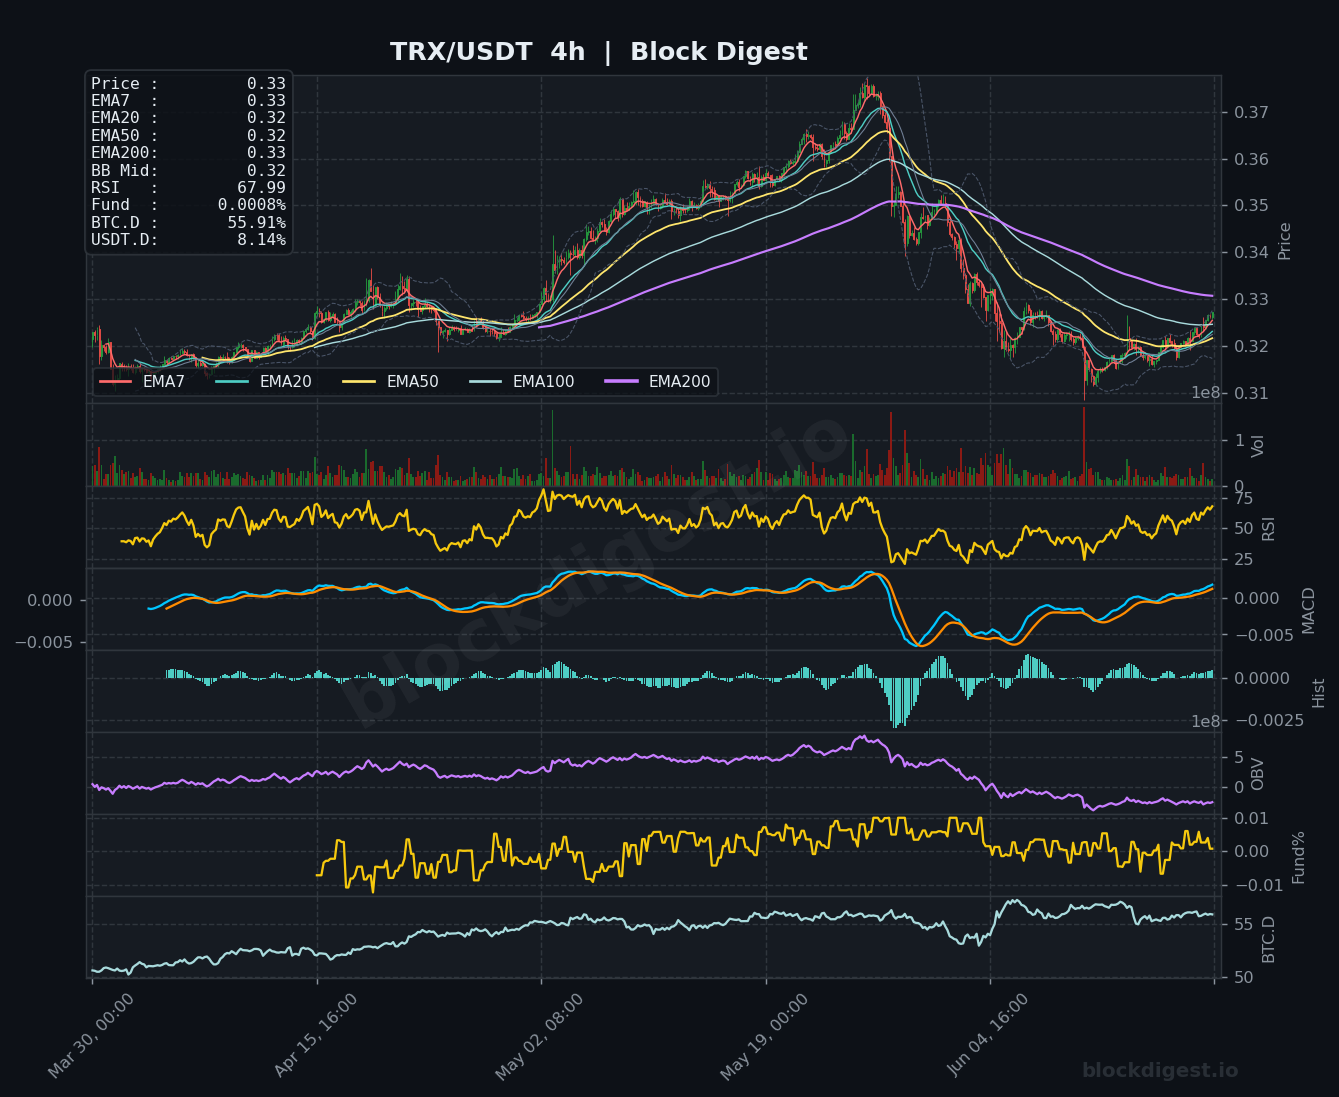
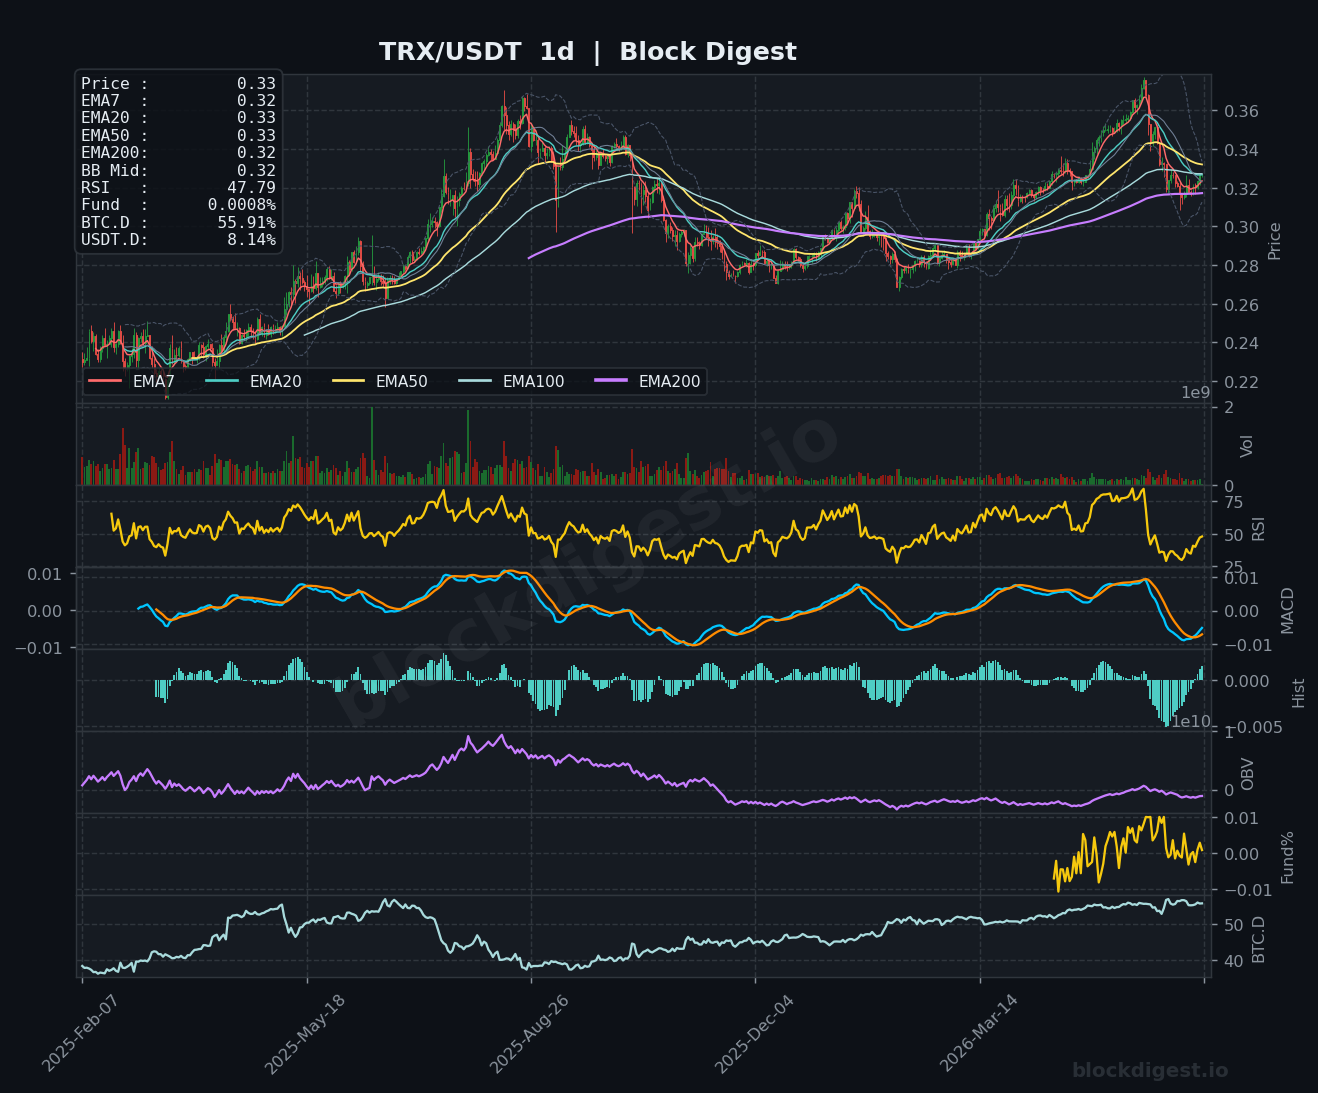
TRX is trading at $0.33 and stands out as the relatively strongest chart in today’s review: on the daily timeframe, price has crossed above both the EMA50 ($0.33) and EMA200 ($0.32), with the EMA structure beginning to shift from bearish to consolidative, a notable distinction versus peers that are still trading deep below their key daily EMAs. The 1-hour RSI at 66.64 and 4-hour RSI at 67.99 both indicate building bullish momentum without reaching overbought extremes, and the 4-hour MACD is recovering steadily from its post-correction lows with a positive histogram building. The daily RSI at 47.79 is mid-range, leaving room for further upside, though the daily MACD signal line remains negative, suggesting momentum has not fully turned on the macro timeframe. Key support is at $0.31–$0.32 with resistance at $0.34–$0.35; a sustained hold above $0.33 keeps the short-term bias bullish.
Altcoin Outlook
The altcoin space as of June 21, 2026 is broadly in a recovery-attempt mode following a prolonged corrective phase, but the quality of setups varies significantly across assets. TRX presents the most constructive daily chart structure of the six coins reviewed, having reclaimed key EMAs, while BNB and SOL show credible short-term recoveries that still need to overcome significant overhead supply. XRP and DOGE carry the weakest structural profiles, with deteriorating daily RSI readings, persistent OBV declines, and price action trapped beneath stacked bearish EMAs, making them vulnerable to further downside on any broad market weakness. Traders should watch BTC dominance closely — a meaningful decline from the 55.91% level would be the primary catalyst needed to unlock a more sustained altcoin rotation — and a contraction in USDT.D below 7.5% would signal the risk appetite shift required to support a broader altcoin recovery.
Disclaimer: This analysis is for informational purposes only and does not constitute financial advice. Cryptocurrency markets are highly volatile and unpredictable. All trading decisions should be made based on your own research and risk tolerance. Block Digest is not responsible for any financial losses incurred as a result of acting on this content.
Stay Ahead of the Market
Follow BlockDigest for crypto market intelligence, research and real-time updates.


