
Market Overview
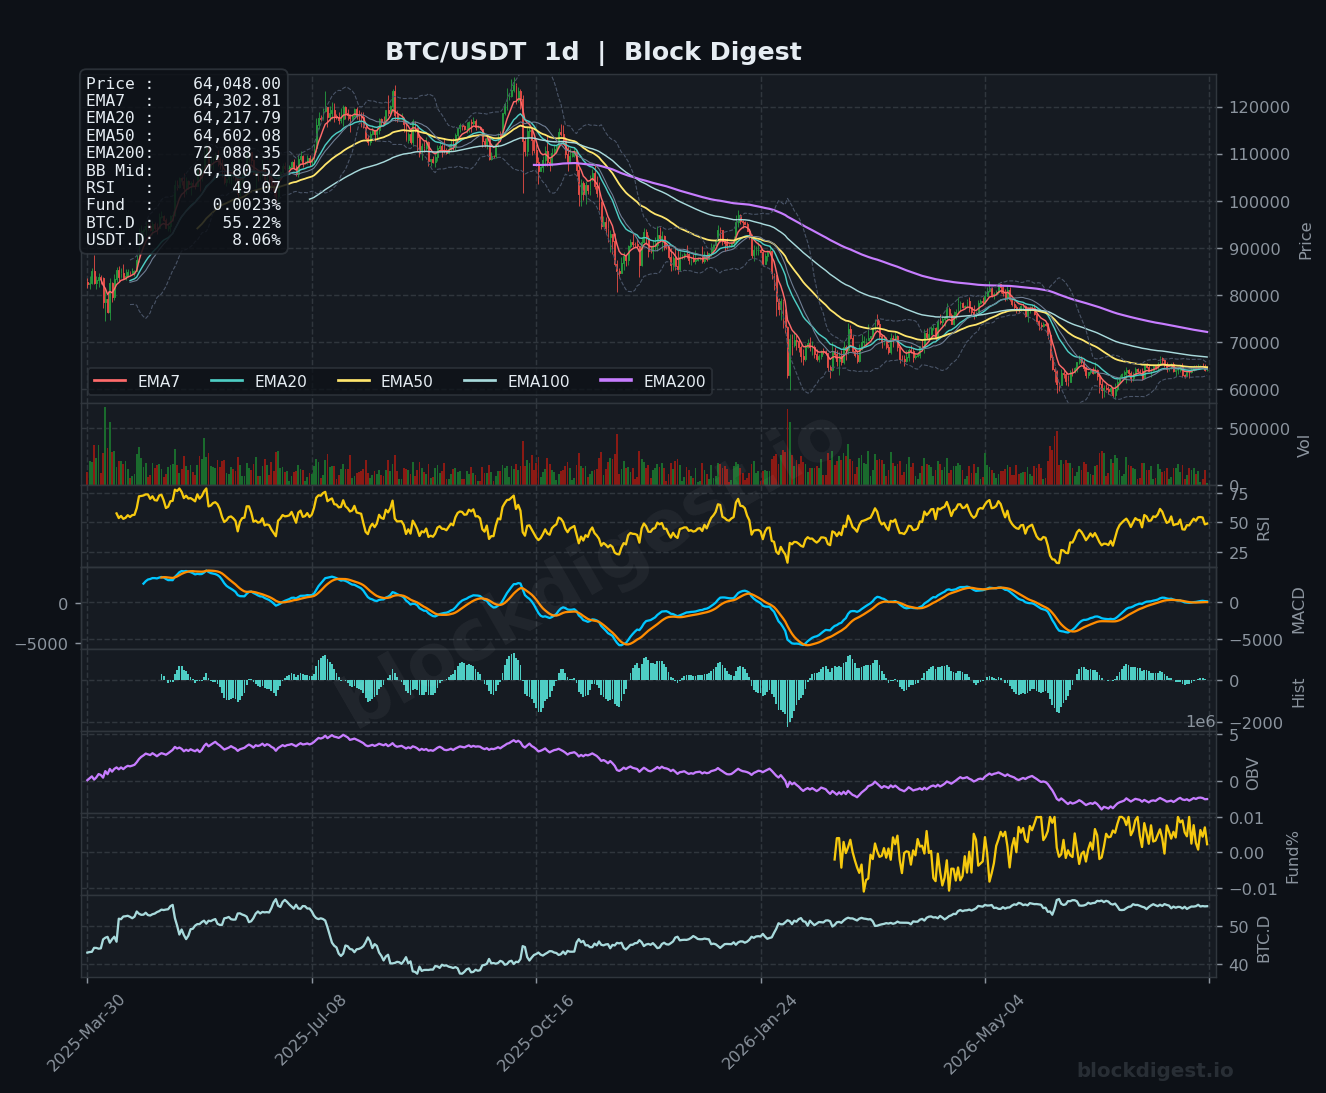
Bitcoin is currently trading at $64,048, caught in a tightening range as the market digests a recovery from early-August lows near $62,000. On the daily timeframe, price remains in a structurally bearish configuration — trading well below the EMA200 at $72,088, which has acted as a ceiling throughout the broader downtrend from 2025 highs. Price is hovering near the daily Bollinger Band midline at $64,180, suggesting a neutral-to-indecisive posture rather than a clear directional lean. The short-term EMAs on the daily (EMA7 at $64,302 and EMA20 at $64,217) are compressing around current price, reinforcing the sense of consolidation rather than trend establishment.
Multi-Timeframe Confluence
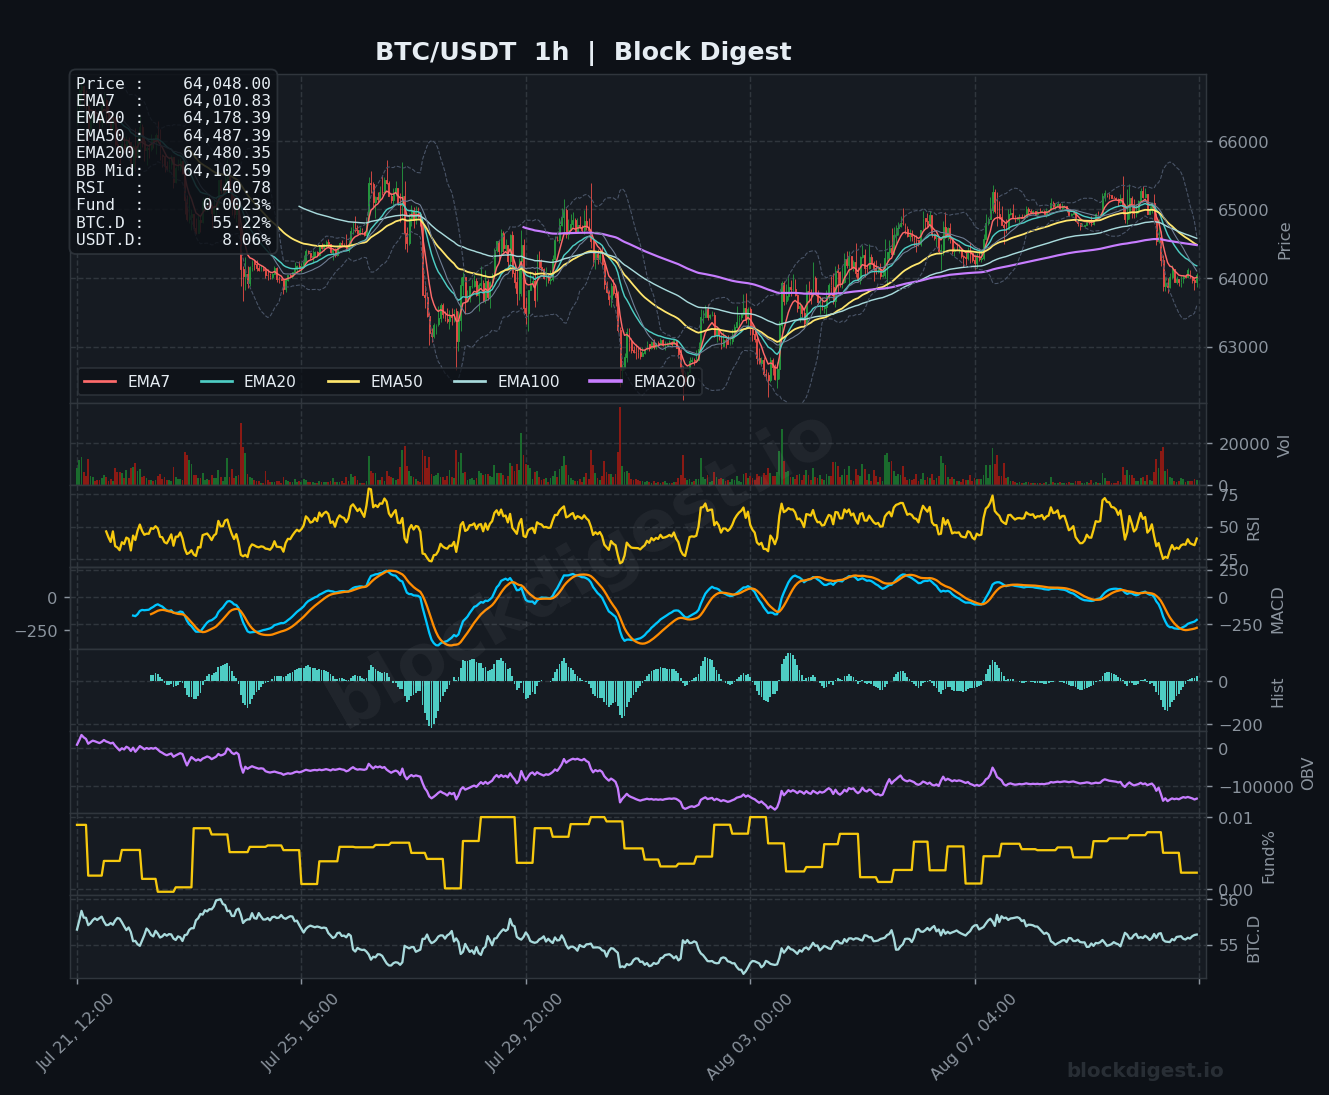
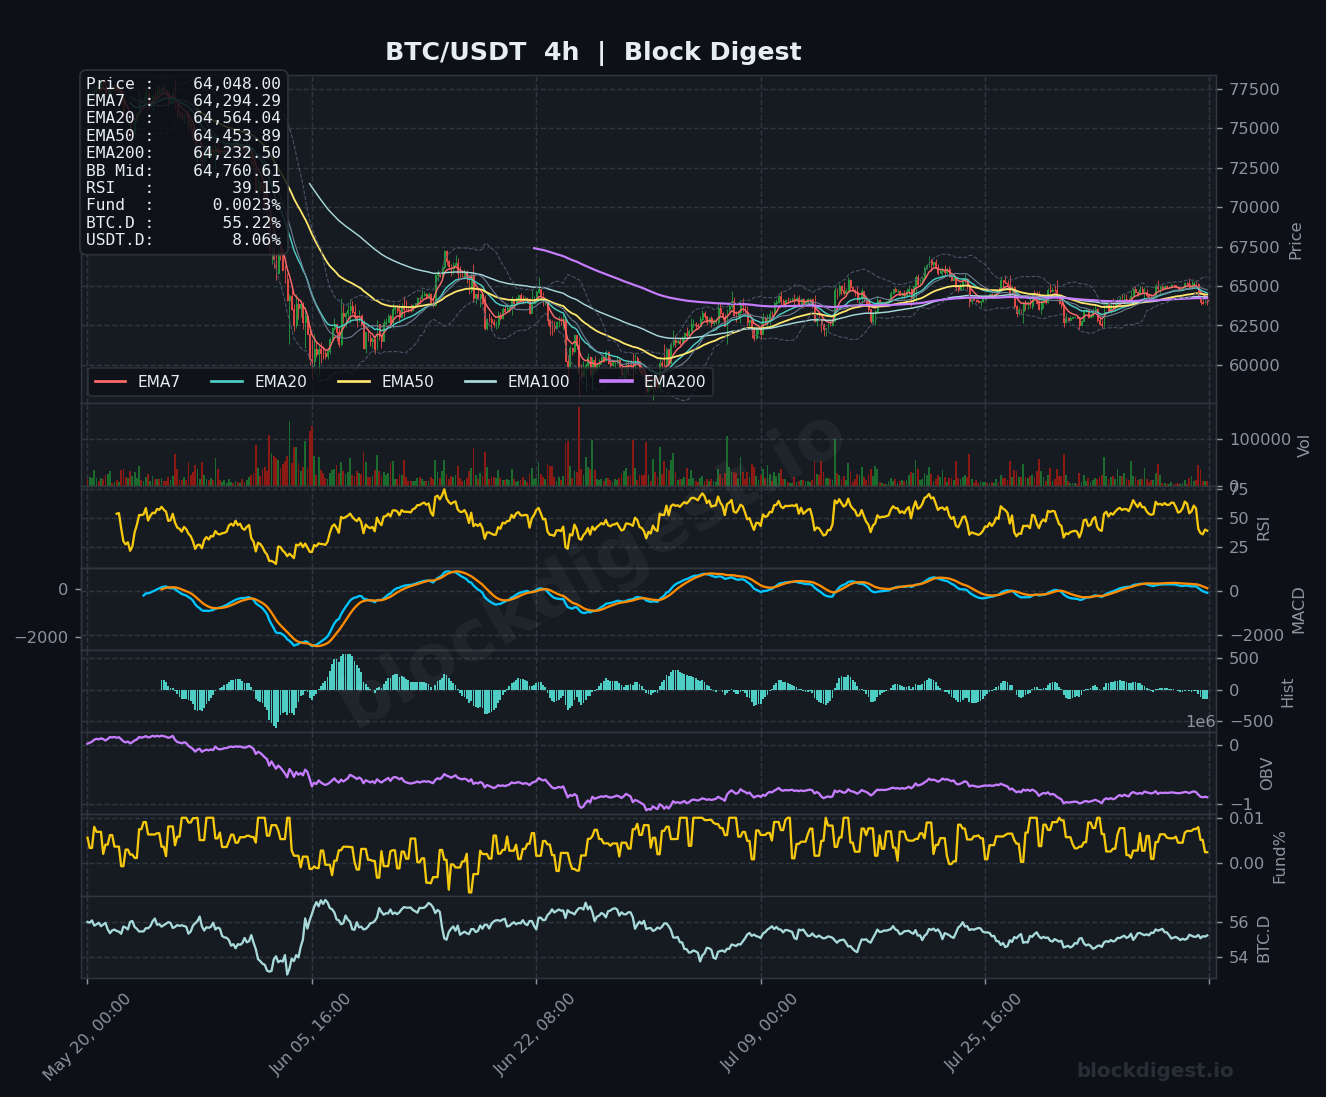
On the 1-hour chart, price sits below the EMA50 ($64,487) and EMA200 ($64,480), both of which are now converging and acting as immediate overhead resistance — a bearish alignment for near-term price action. The 4-hour chart tells a similar story: price is trading beneath the EMA20 ($64,564), EMA50 ($64,453), and EMA200 ($64,232), with all EMAs bunched tightly in the $64,200–$64,600 range, creating a dense resistance cluster. Notably, this cluster aligns with the $64,200–$64,600 zone across all three timeframes, making it a high-conviction resistance band. Short-term momentum on the hourly is leaning bearish and does not currently support a breakout attempt, contradicting any optimism from the week’s earlier recovery.
Key Levels to Watch
- Resistance: $64,450–$64,600 — converging EMA50/EMA200 on the 1h and 4h charts; a decisive close above this zone would shift short-term structure
- Resistance: $65,200 — recent swing high from earlier in the week where bulls failed to sustain momentum for a fourth consecutive day; a clear reclaim would re-open upside
- Resistance: $67,000–$67,500 — 4h Bollinger Band upper band region and a prior structural breakdown level from mid-summer
- Support: $63,800–$64,000 — immediate demand zone and current price floor; a confirmed break below triggers the next leg
- Support: $62,000 — early-August swing low and recent structural base; loss of this level would mark a significant deterioration in market structure
- Support: $60,000 — psychological and chart-based support, corresponding to a broader consolidation area visible on the daily
Momentum & On-Chain Signals
The RSI picture is uniformly subdued across timeframes — the 1-hour sits at 40.78, the 4-hour at 39.15, and the daily at 49.07, reflecting a market that has pulled back from overbought conditions without reaching oversold levels that typically attract aggressive buyers. Block Digest’s proprietary BD Pulse score of 41/100 reinforces this bearish lean, with on-chain momentum failing to confirm the price recovery seen earlier this week. The MACD on both the 1-hour and 4-hour charts shows declining histograms with lines converging toward zero but lacking a bullish crossover, while the daily MACD histogram remains compressed in negative territory. The OBV trend reading of +1 offers a faint positive signal, but the OBV curve on the daily chart has been trending downward for months, suggesting persistent distribution rather than meaningful accumulation.
BTC Dominance & Market Sentiment
BTC dominance stands at 55.22%, holding relatively firm and suggesting that capital has not rotated aggressively into altcoins — Bitcoin remains the preferred holding during this period of uncertainty. USDT.D at 8.06% indicates a moderate but not extreme level of risk-off positioning, consistent with cautious sentiment rather than outright panic. Together, these readings point to a market in wait-and-see mode, with traders unwilling to commit strongly in either direction ahead of Wednesday’s U.S. inflation data.
Risk Scenarios
- Bullish case: A sustained hourly close above the $64,450–$64,600 EMA cluster, followed by reclaim of $65,200, would invalidate the short-term bearish structure and open a path toward $67,000–$67,500. Favorable CPI data on Wednesday could be the macro catalyst needed to drive that breakout.
- Bearish case: Failure to hold $63,800 on a closing basis would expose the $62,000 swing low; a break below that level would confirm a continuation of the broader downtrend with $60,000 as the next meaningful target.
Outlook
The setup as of August 11 is one of cautious consolidation, with the weight of evidence tilting modestly bearish — the BD Pulse at 41/100, sub-50 RSI readings across all timeframes, and price below a dense EMA resistance cluster all argue against a straightforward bullish continuation. The next 24–48 hours are largely macro-driven, with Wednesday’s U.S. CPI print serving as the pivotal catalyst; oil-driven inflation concerns have already pressured sentiment and could compound any upside surprise in the data. Bulls need a decisive close above $64,600 to shift the near-term narrative, while bears need a break below $63,800 to reassert control. Until one of those levels cracks with volume confirmation, range-bound chop between $63,800 and $65,200 remains the most probable near-term outcome.
Disclaimer: This analysis is for informational purposes only and does not constitute financial advice. Cryptocurrency markets are highly volatile and unpredictable. All trading decisions should be made based on your own research and risk tolerance. Block Digest is not responsible for any financial losses incurred as a result of acting on this content.
Stay Ahead of the Market
Follow BlockDigest for crypto market intelligence, research and real-time updates.


