
Market Overview
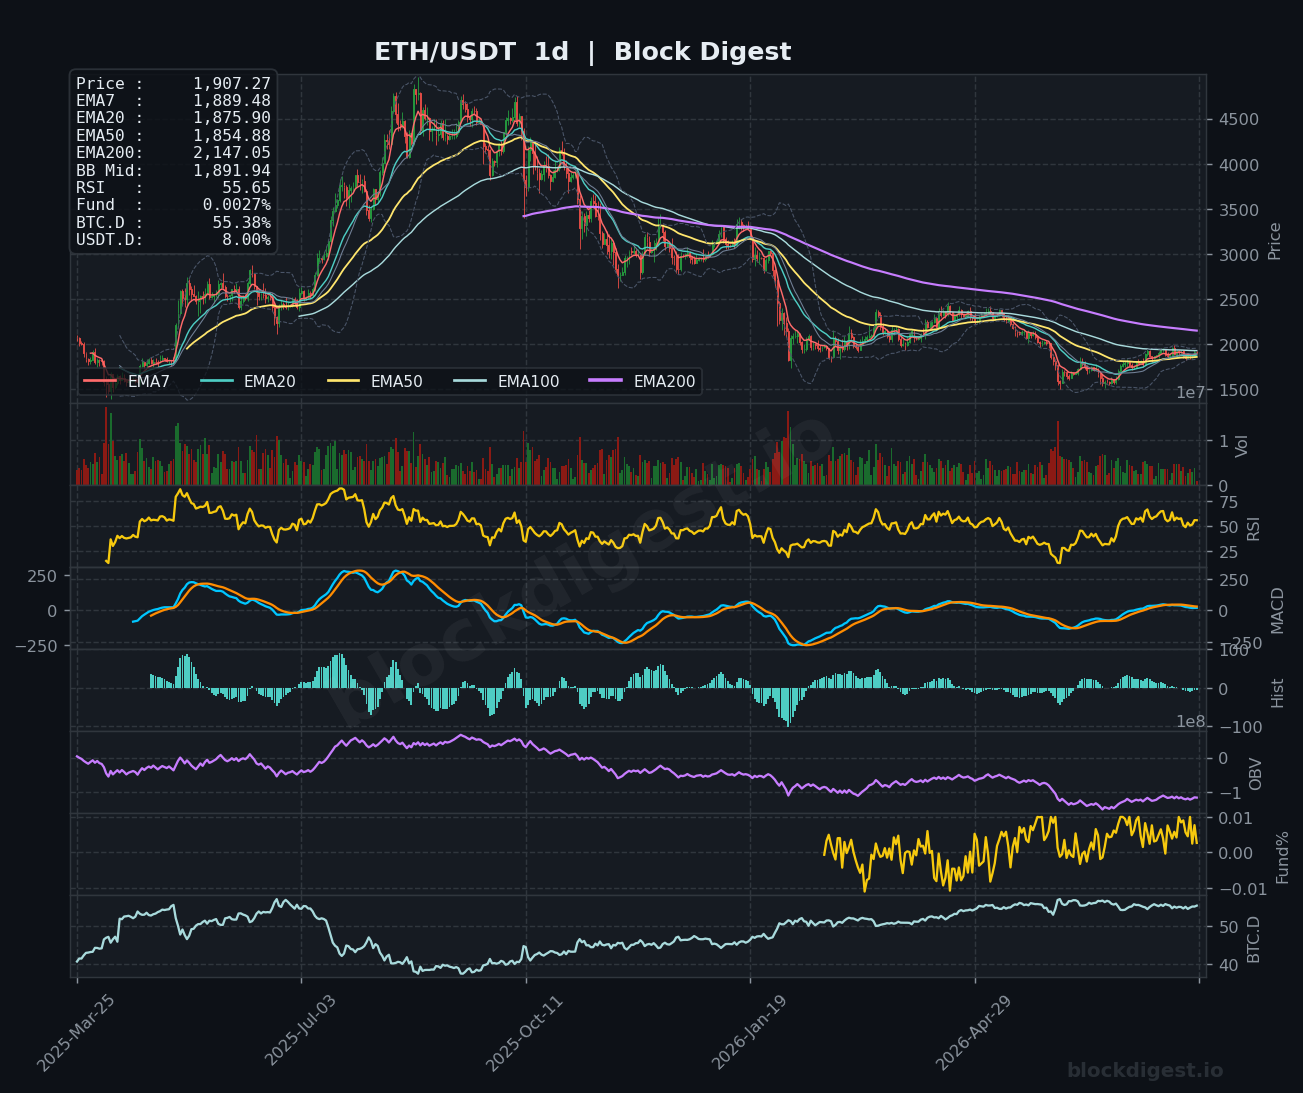
Ethereum is trading at $1,907.27 as of August 6, 2026, sitting just above a cluster of short-term EMAs after a sharp recovery from lows near $1,825 seen in recent sessions. On the daily timeframe, price remains in a broader recovery structure, having bounced meaningfully off multi-month lows, but it continues to trade well beneath the daily EMA200 at $2,147.05 — a level that has acted as a persistent ceiling throughout the 2026 downtrend. The Bollinger Band midline on the daily sits at $1,891.94, and ETH’s current position above it is a modest positive signal, though the overall daily structure remains technically bearish with all major EMAs fanning downward above current price. The near-term bid is encouraging, but the macro trend has not yet flipped.
Multi-Timeframe Confluence
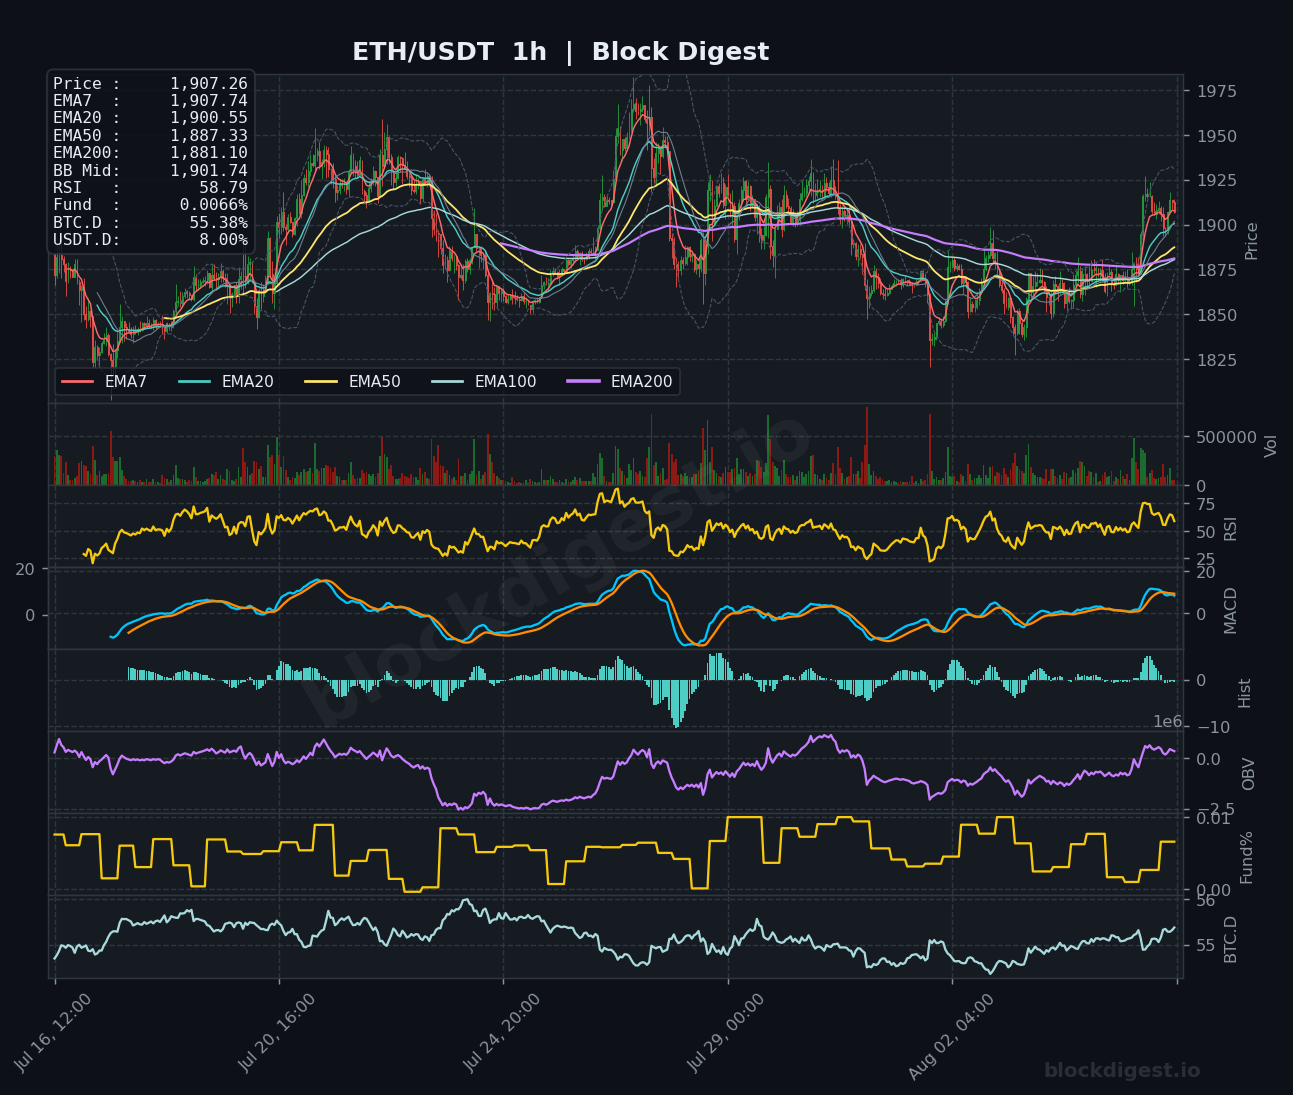
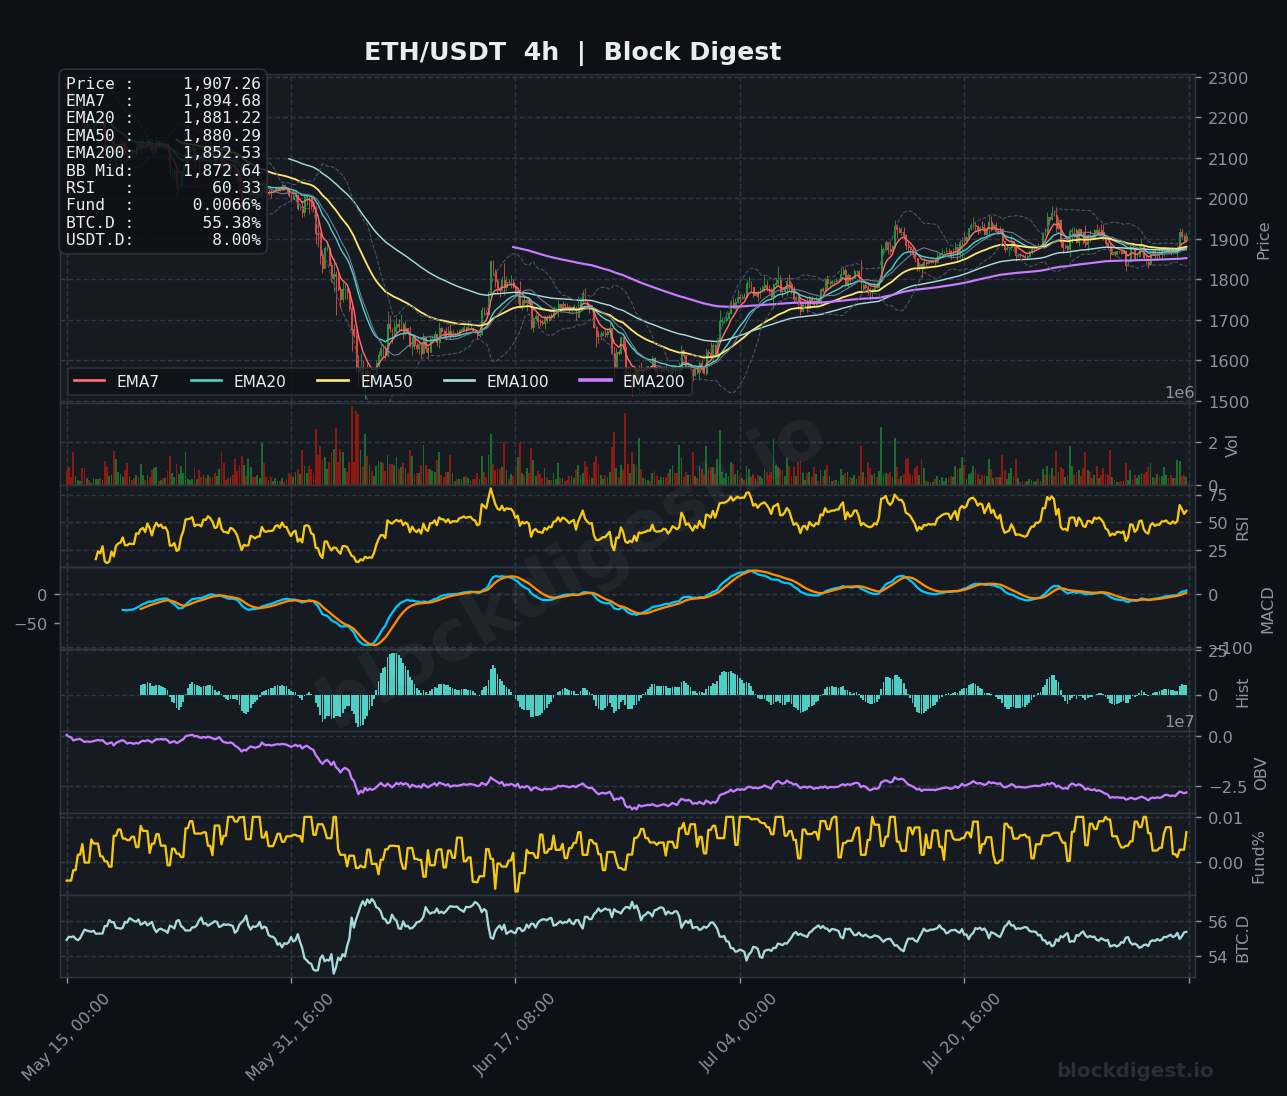
On the 1-hour chart, ETH has reclaimed all short-term EMAs — EMA7 ($1,907.74), EMA20 ($1,900.55), EMA50 ($1,887.33), and EMA200 ($1,881.10) — all tightly compressed, signaling a potential short-term momentum shift but also indecision at this range. The 4-hour chart shows a more constructive setup, with price clearing its EMA7 ($1,894.68), EMA20 ($1,881.22), and EMA50 ($1,880.29) in a bullish stack, while trading well above the 4H EMA200 at $1,852.53 — the first timeframe where price has convincingly reclaimed the 200 EMA. However, the daily chart tells a more cautious story: the EMA7 ($1,889.48) and EMA20 ($1,875.90) are just being tested from below, and the daily EMA200 at $2,147.05 remains a formidable overhead barrier. Short-term momentum is beginning to align bullishly, but it has not yet earned higher-timeframe confirmation.
Key Levels to Watch
- Resistance: $1,925–$1,935 — Recent 1H swing high zone where sellers have previously capped rallies; a clean break here would open the path toward $1,970.
- Resistance: $1,970–$1,980 — Prior consolidation ceiling visible on both the 1H and 4H charts; a key inflection point for determining whether ETH can challenge the $2,000 psychological level.
- Resistance: $2,147 — The daily EMA200, acting as the dominant macro resistance; reclaiming this level would mark a structural trend change.
- Support: $1,880–$1,887 — Confluence of the 4H EMA50 and 1H EMA50; a retest of this zone would be a natural pullback within the current structure.
- Support: $1,852 — The 4H EMA200, which recently flipped to support after multiple weeks of acting as resistance; a breakdown here would be technically significant.
- Support: $1,825 — Recent swing low and the lower Bollinger Band region on the 1H chart; the last meaningful demand zone before a retest of the $1,780–$1,800 area.
Momentum & On-Chain Signals
The RSI across timeframes tells a consistent story of cautious recovery: 58.79 on the 1H, 60.33 on the 4H, and 55.65 on the daily — all sitting in neutral-to-mildly-bullish territory without being overbought, which leaves room for further upside. Block Digest’s proprietary BD Pulse Score currently reads 48/100, firmly neutral, corroborating what the RSI data suggests: this is a market in transition rather than one with confirmed directional conviction. The MACD on the 4H is constructive, with the signal line and MACD line converging near zero after a prolonged recovery from deeply negative readings, and histogram bars are printing positive — a nascent bullish crossover is developing. On-chain, Block Digest’s OBV Trend indicator reads +1, suggesting mild accumulation pressure is present beneath the surface, though not yet aggressive enough to signal a high-conviction move.
BTC Dominance & Market Sentiment
BTC dominance sits at 55.37% — a level that historically tends to suppress altcoin outperformance — and has been gradually grinding higher over recent weeks on the daily chart, which limits ETH’s ability to stage a standalone breakout. USDT dominance at 8.00% remains elevated, indicating that a meaningful portion of capital is still parked on the sidelines rather than rotating aggressively into risk assets. President Trump’s comments regarding a potential Strait of Hormuz deal injected some macro optimism into markets on August 5, and the upcoming July jobs report on Friday represents a binary risk event that could either accelerate the current recovery or stall it at resistance.
Risk Scenarios
- Bullish case: A sustained hold above $1,900 with a clean break through $1,935 on meaningful volume would confirm the short-term recovery has legs, targeting the $1,970–$1,980 resistance cluster and potentially $2,000 psychological resistance. A positive Friday jobs report reducing rate uncertainty would serve as a significant macro catalyst for this scenario.
- Bearish case: Failure to hold the $1,880 confluence zone — particularly the 4H EMA50 — on any retest would suggest the current bounce is a bull trap, opening the door for a retest of $1,852 and, if broken, a return toward the $1,825 swing low.
Outlook
ETH/USDT enters August 6 in a tentatively constructive short-term posture, having reclaimed key intraday EMAs and with multi-timeframe momentum slowly aligning to the upside — but the higher-timeframe macro structure remains bearish, and the daily EMA200 at $2,147 is still a distant ceiling. The BD Pulse Score of 48/100 and muted funding rate of +0.0034% indicate this is not a crowded long, which is actually a mild positive: there is no excessive leverage to unwind on a move higher. The most critical near-term trigger is the Friday jobs report, which could determine whether risk appetite expands enough to sustain a push toward $1,970+. Bulls need to defend $1,880 and break $1,935 to shift the narrative; any close back below $1,852 would materially weaken the recovery thesis.
—
Disclaimer: This analysis is for informational purposes only and does not constitute financial advice. Cryptocurrency markets are highly volatile and unpredictable. All trading decisions should be made based on your own research and risk tolerance. Block Digest is not responsible for any financial losses incurred as a result of acting on this content.
Stay Ahead of the Market
Follow BlockDigest for crypto market intelligence, research and real-time updates.


