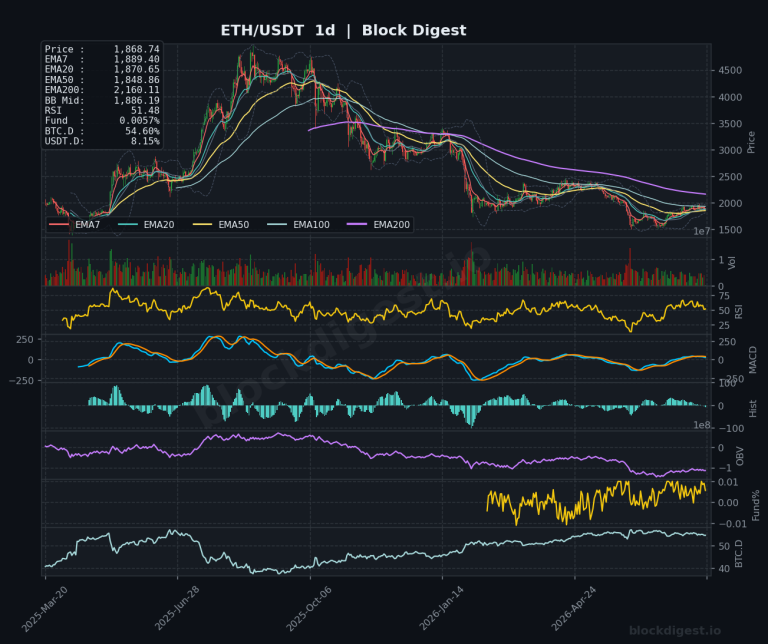
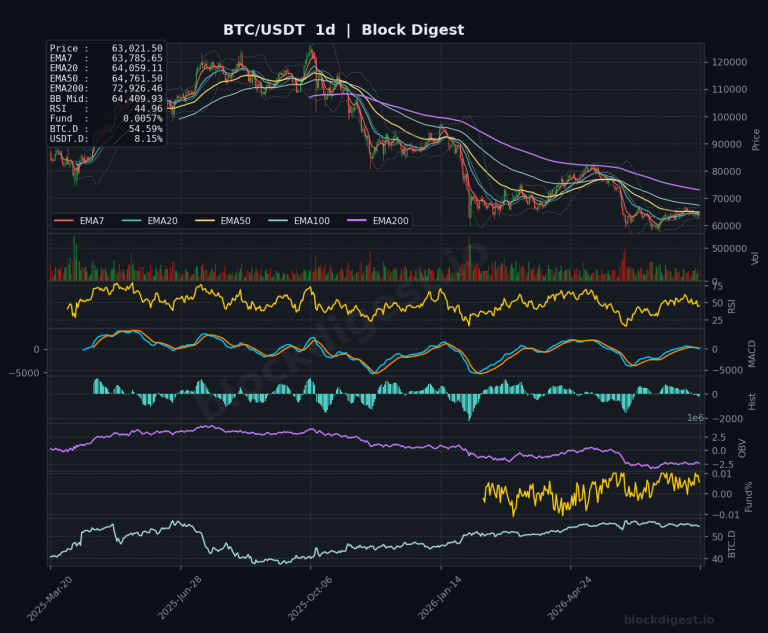
Macro Market Overview
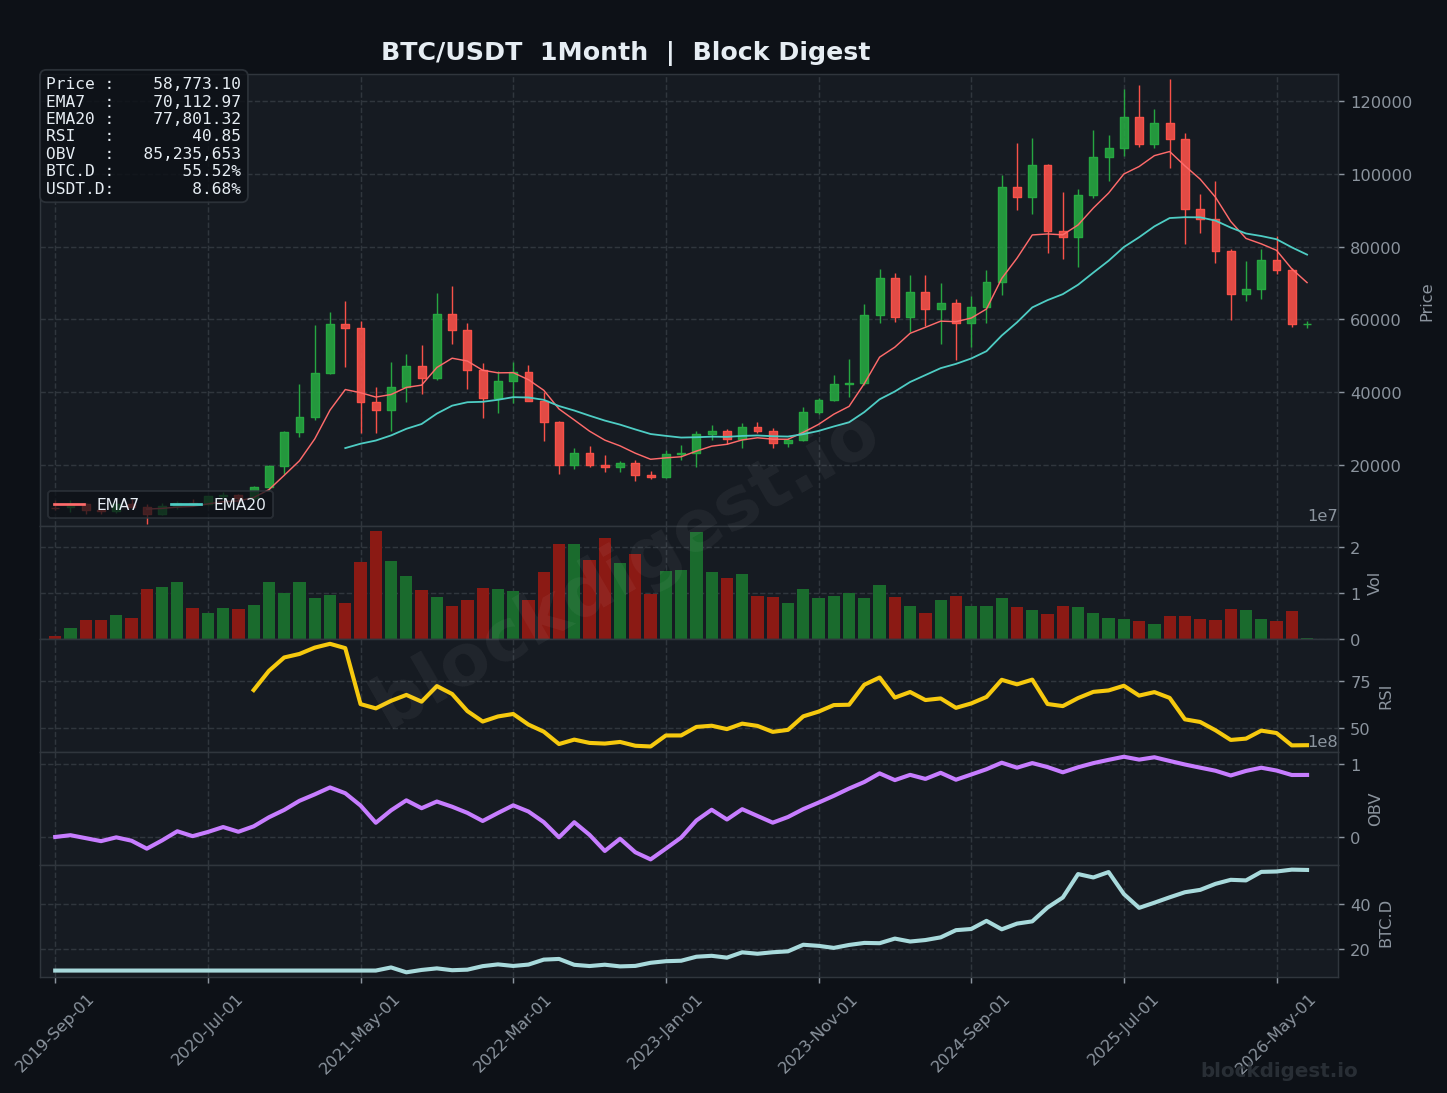
Bitcoin enters July 2026 trading around $58,773, firmly below both the monthly EMA7 ($70,112) and EMA20 ($77,801), a bearish structural configuration that signals a meaningful shift in the macro trend following the cycle peak established near $109,000. The June monthly candle is printing as a notable red close, extending what is now a multi-month corrective sequence that has erased approximately 46% from the all-time high. Contextually, this price action mirrors the post-peak distribution phases observed in both the 2018 and 2021 cycle tops, where price sustained extended periods below key monthly EMAs before finding durable bottoms. The current monthly candle structure — characterized by successive lower highs and lower lows on the monthly chart — confirms that the macro trend has transitioned from markup to early markdown. BTC is now testing price levels that previously served as significant structural support during the late 2024 accumulation and breakout phase, making the current zone critical for cycle continuity.
Long-Term Trend Structure
On the monthly chart, the EMA7 ($70,112) has crossed decisively below the EMA20 ($77,801), triggering the same bearish EMA crossover that historically preceded the deepest phases of bear markets in 2018 and 2022. The monthly RSI has declined to 40.85, approaching but not yet reaching the oversold territory (sub-30) that has historically marked generational cycle lows — in both the 2018 and 2022 bear markets, monthly RSI bottomed between 25–32 before the next bull cycle commenced. The Bollinger Bands on the monthly timeframe appear to be expanding downward, with price gravitating toward the lower band, suggesting continued volatility and downside pressure in the near term. Key historical support zones between $52,000–$58,000 represent the prior all-time high breakout region from late 2024, and a sustained monthly close below this band would materially damage the broader cycle thesis. The overall cycle phase appears to be transitioning from distribution into early markdown, consistent with the pattern visible roughly 12–18 months after prior cycle peaks.
Weekly Timeframe Context
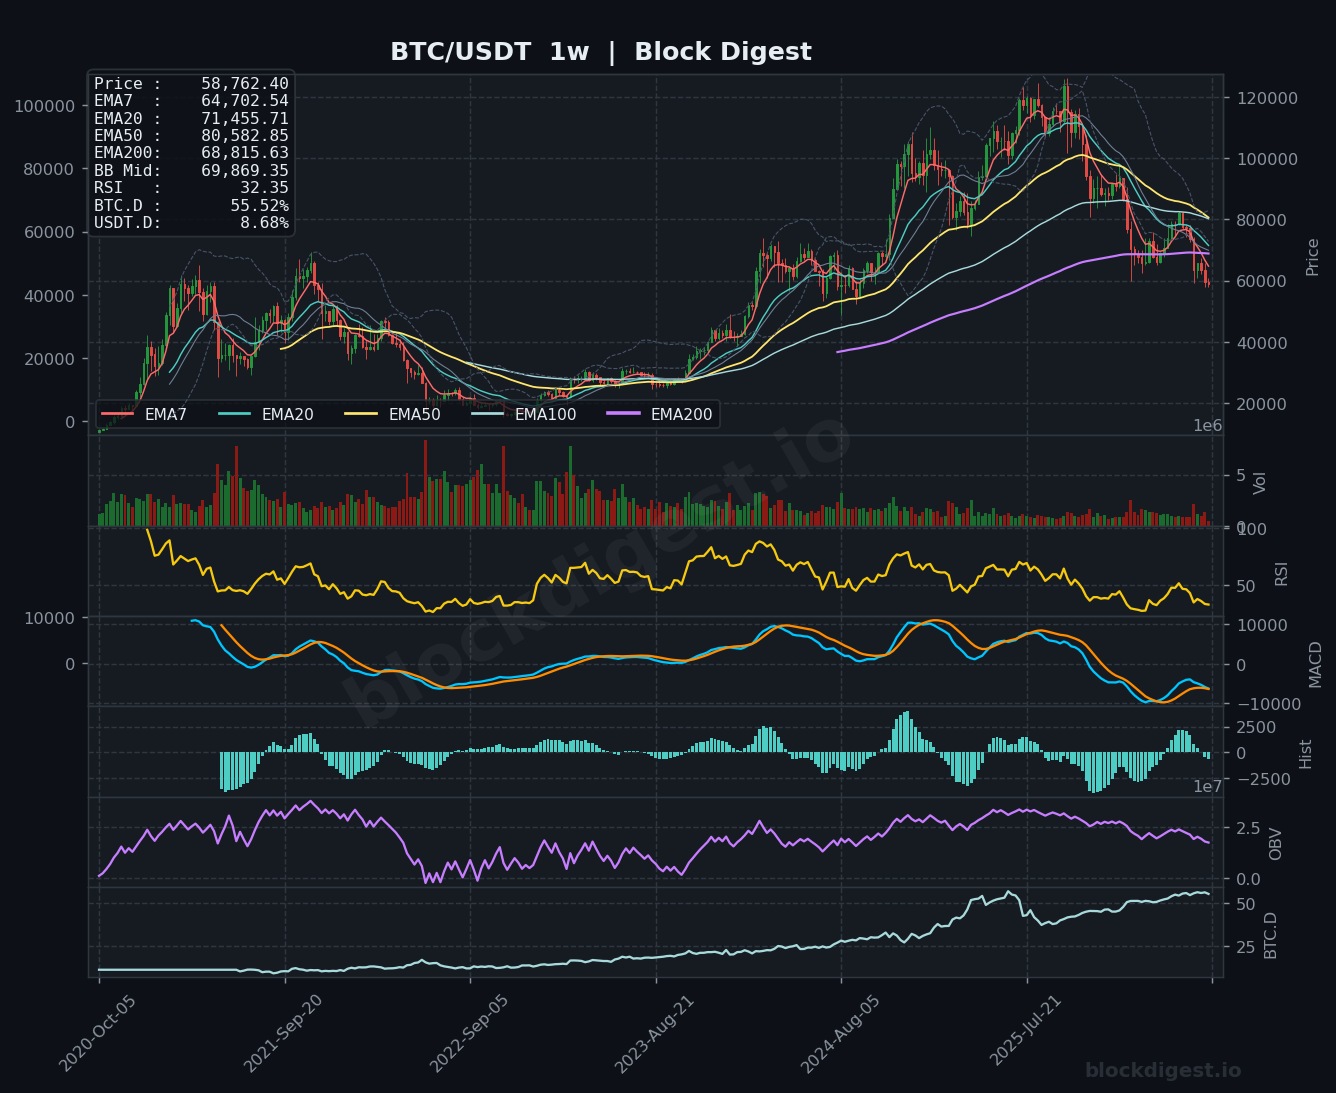
The weekly chart reinforces the bearish macro thesis with significant conviction: price at $58,762 is trading below the weekly EMA7 ($64,702), EMA20 ($71,455), EMA50 ($80,582), and notably even the weekly EMA200 ($68,815), a rare and historically significant breakdown that occurred in the 2022 bear market and signaled an extended corrective period. The Bollinger Band midline on the weekly sits at $69,869, acting as immediate dynamic resistance, while all major EMAs are stacked in a bearish sequence — a full EMA waterfall that leaves little near-term structural support from a moving average perspective. The weekly MACD remains deeply negative, with the histogram showing some marginal contraction but no confirmed bullish divergence or crossover signal yet, suggesting medium-term momentum has not found a decisive inflection point. A weekly reclaim of the $68,000–$70,000 zone would be the minimum requirement to begin rebuilding bullish structure on this timeframe.
Key Macro Levels
- Major Resistance: $68,800–$70,000 (weekly EMA200 and weekly BB midline confluence, now converted to resistance); $77,800 (monthly EMA20, key macro dynamic resistance); $80,500–$81,000 (weekly EMA50, major overhead supply); $94,000–$96,000 (prior breakdown zone and previous cycle consolidation range)
- Major Support: $55,000–$58,000 (prior all-time high breakout zone from late 2024, critical macro support); $48,000–$50,000 (major psychological and historical resistance-turned-support, 2021 cycle high region); $42,000–$44,000 (deep bear market support and 2024 pre-halving accumulation zone); $30,000–$32,000 (generational support and 2021 bear market bottom, last resort macro floor)
Momentum & Accumulation Analysis
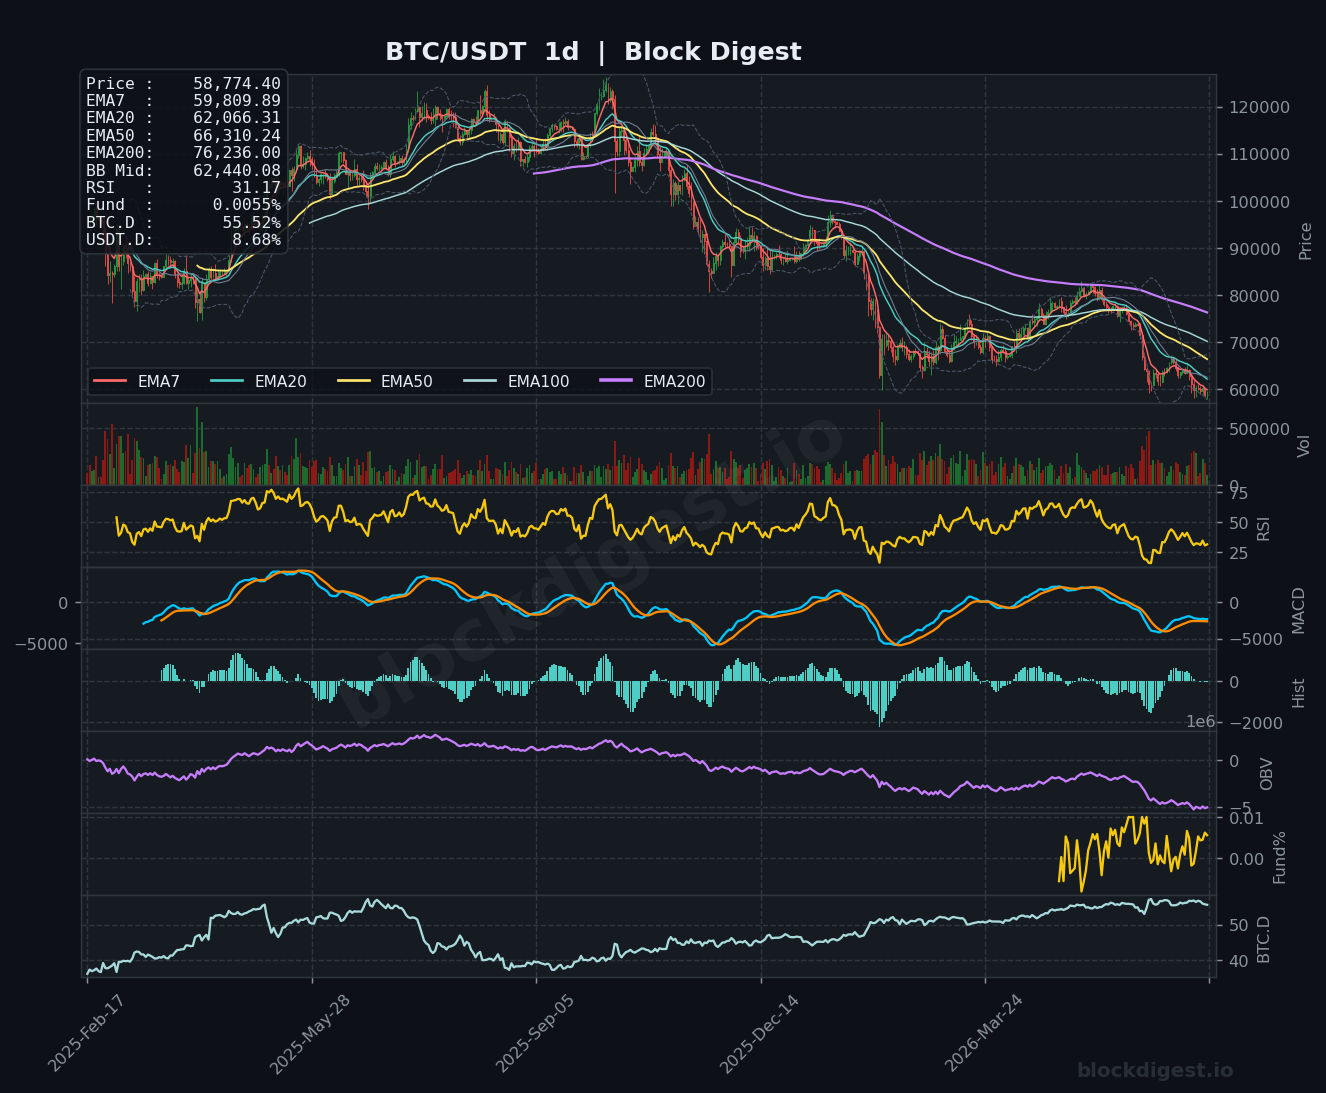
The monthly RSI reading of 40.85 places Bitcoin in a zone of weakening but not yet extreme pessimism — historically, durable cycle bottoms have required a deeper washout into the 25–35 range on the monthly RSI, suggesting the current reading may represent a midpoint in the corrective phase rather than a terminal low. On the daily chart, the RSI has compressed to 31.17, approaching oversold conditions that have triggered short-term bounces throughout the bear market, though these have consistently failed to reclaim structural resistance. The monthly OBV remains elevated relative to prior cycles, reflecting the significant institutional inflows that characterized the 2024–2025 markup phase — however, the OBV has begun rolling over meaningfully in recent months, indicating net distribution at higher prices. The weekly MACD remains in negative territory with both the MACD line and signal line declining below zero, while the histogram is contracting slightly, which may hint at slowing downside momentum but falls well short of a confirmed reversal signal. Compared to the 2022 cycle bottom, current momentum indicators are at comparable but not yet maximally pessimistic levels.
BTC Dominance – Cycle Context
BTC dominance sits at 55.52%, a historically elevated reading that reflects Bitcoin’s continued outperformance relative to the broader altcoin market during this corrective phase — a pattern consistent with prior bear market cycles where capital rotates defensively into BTC. The monthly BTC.D chart shows dominance at multi-year highs, suggesting that an altcoin season rotation has not yet materialized and that risk appetite across the crypto ecosystem remains suppressed. Historically, sustained altcoin season dynamics emerge only after BTC dominance peaks and begins a meaningful multi-month decline — typically in conjunction with BTC establishing a new bull market trend, which the current structure does not yet support. USDT.D at 8.68% remains elevated, signaling that a meaningful portion of crypto market participants are holding stablecoins on the sidelines, which simultaneously reflects caution and represents dry powder that could fuel the next recovery leg when macro conditions improve.
Risk Scenarios
- Bull case: A stabilization and monthly close above the $58,000–$60,000 zone — the former all-time high breakout region — would preserve the macro bull cycle structure and set the stage for a recovery rally back toward the $70,000–$77,000 range. Positive macro catalysts including Fed rate cuts, renewed ETF inflows, or a broader risk-on rotation could accelerate a reclaim of the weekly EMA200 around $68,800, potentially initiating a new leg higher. A confirmed monthly RSI bottom above 35 with OBV stabilization would align with prior mid-cycle corrections rather than full bear markets, with cycle extension targets toward $130,000–$150,000 remaining viable on a 12–18 month horizon.
- Bear case: A monthly close below $55,000 would represent a decisive breakdown below the prior all-time high breakout zone, historically a high-conviction signal that the macro cycle has fully transitioned into a bear market phase. Continued deterioration in macro liquidity conditions — rising real yields, sustained dollar strength, or regulatory headwinds — could accelerate selling pressure toward the $42,000–$48,000 zone, where the next significant structural support cluster resides. In an extreme scenario mirroring the 2022 drawdown magnitude, a retest of the $28,000–$32,000 range cannot be excluded, particularly if USDT.D continues to rise and OBV confirms sustained institutional distribution.
Monthly Outlook
July 2026 opens with Bitcoin in a technically fragile macro position: price is below all major monthly and weekly EMAs, the monthly EMA crossover is bearish, and momentum indicators have yet to reach the extreme oversold readings historically associated with durable cycle lows. The $55,000–$58,000 zone is the most critical support cluster to monitor this month — a convincing hold with a constructive monthly candle close above $60,000 would be the first meaningful sign that sellers are exhausting. Conversely, a decisive breakdown below $55,000 on elevated volume would open the path to a deeper corrective wave targeting the $42,000–$48,000 range, materially shifting the cycle timeline. The macro directional bias for July remains cautiously bearish, with any rallies toward the $65,000–$70,000 zone expected to face substantial resistance unless accompanied by a confirmed shift in macro liquidity and weekly MACD crossover. Patience and careful level management define the optimal approach in this cycle phase — the setup increasingly resembles a late-stage markdown that may be approaching,
Disclaimer: This analysis is for informational purposes only and does not constitute financial advice. Cryptocurrency markets are highly volatile and unpredictable. All trading decisions should be made based on your own research and risk tolerance. Block Digest is not responsible for any financial losses incurred as a result of acting on this content.
Stay Ahead of the Market
Follow BlockDigest for crypto market intelligence, research and real-time updates.