ETH Daily Analysis — May 05, 2026
ETH Daily Analysis – May 05, 2026
Market Overview
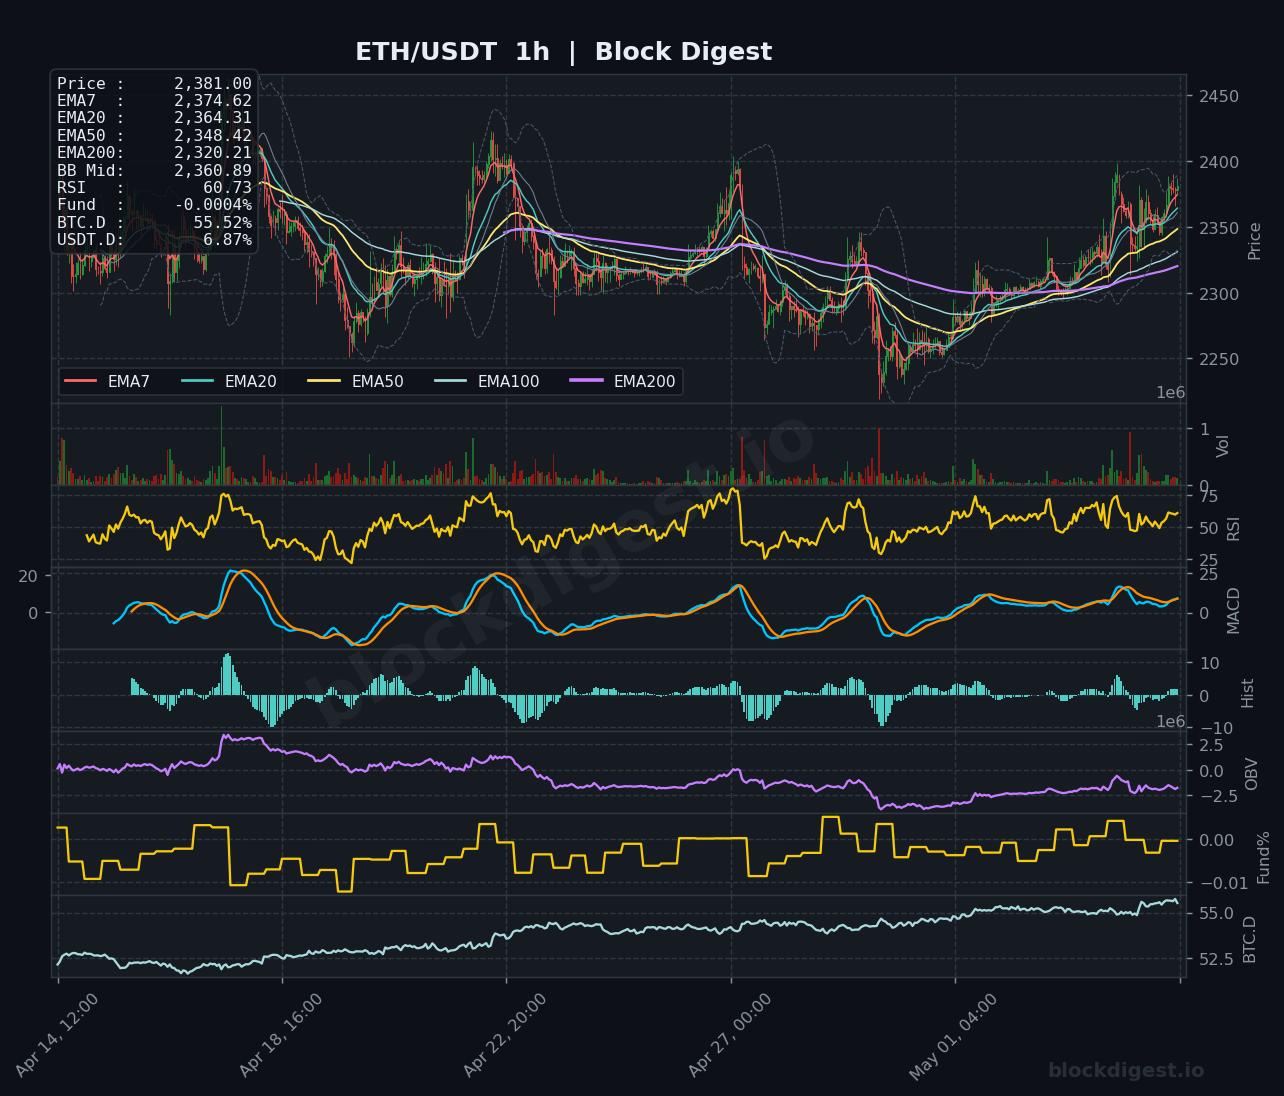
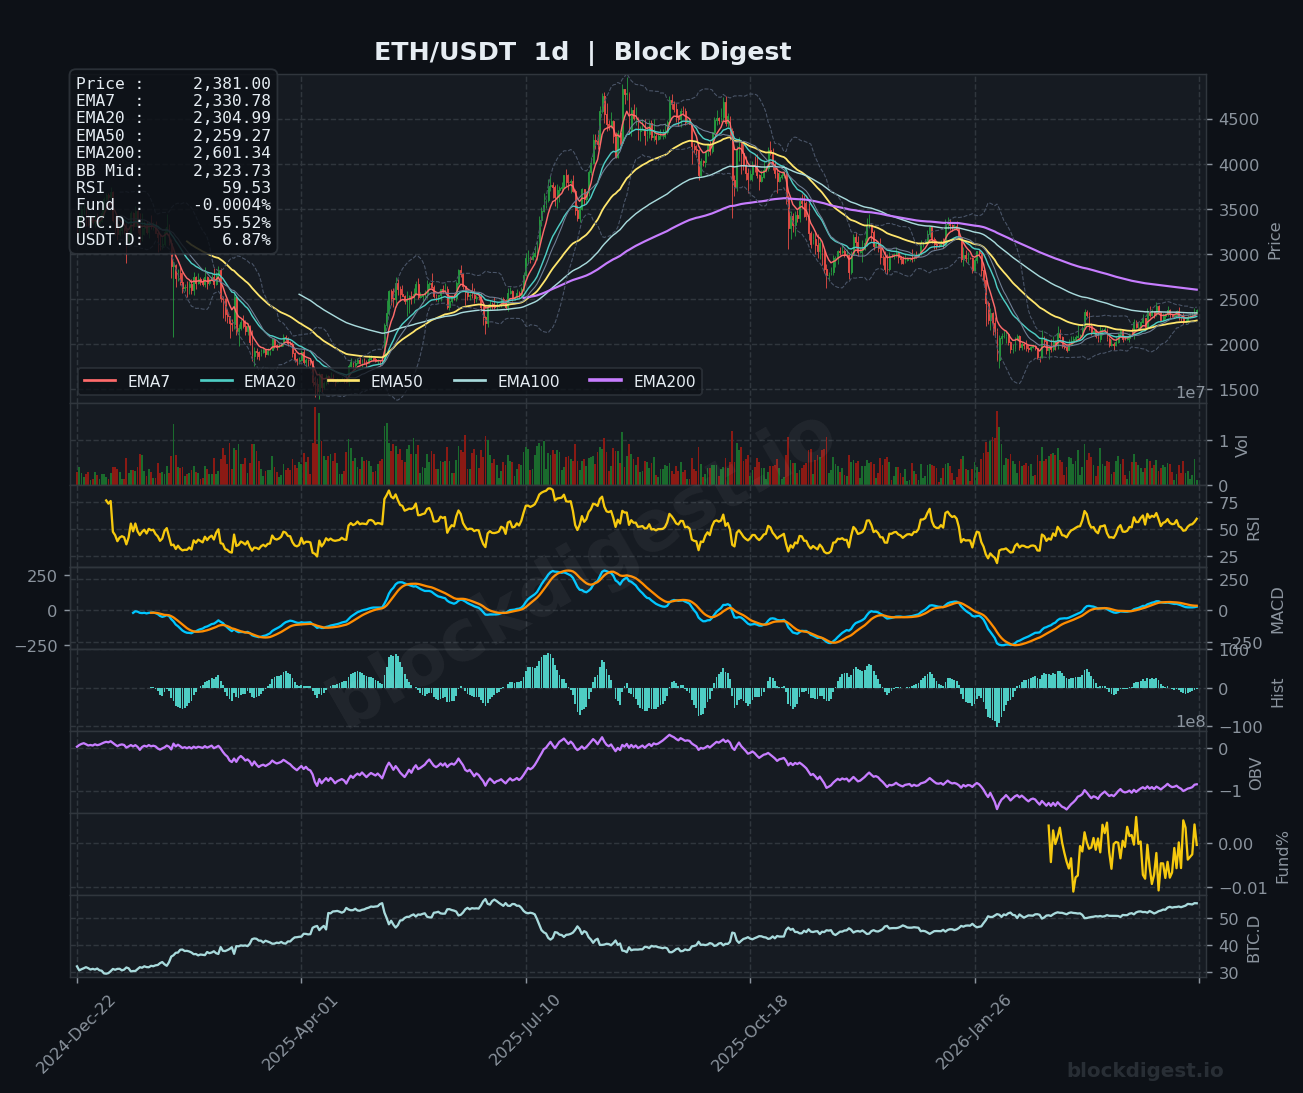
Ethereum is currently trading at $2,381.00, demonstrating constructive price action as it maintains position above the critical EMA50 at $2,348.42 on the 1-hour timeframe. The daily chart reveals price trading above the EMA20 ($2,304.99) but still beneath the EMA50 ($2,259.27), suggesting a near-term recovery within a broader consolidation phase. Price is positioned near the middle Bollinger Band at $2,360.89 on the 1-hour chart, indicating balanced short-term pressure, while the daily timeframe shows recent stabilization after extended weakness. The dominant higher timeframe structure remains in recovery mode as ETH attempts to rebuild momentum following previous downside pressure.
Multi-Timeframe Confluence
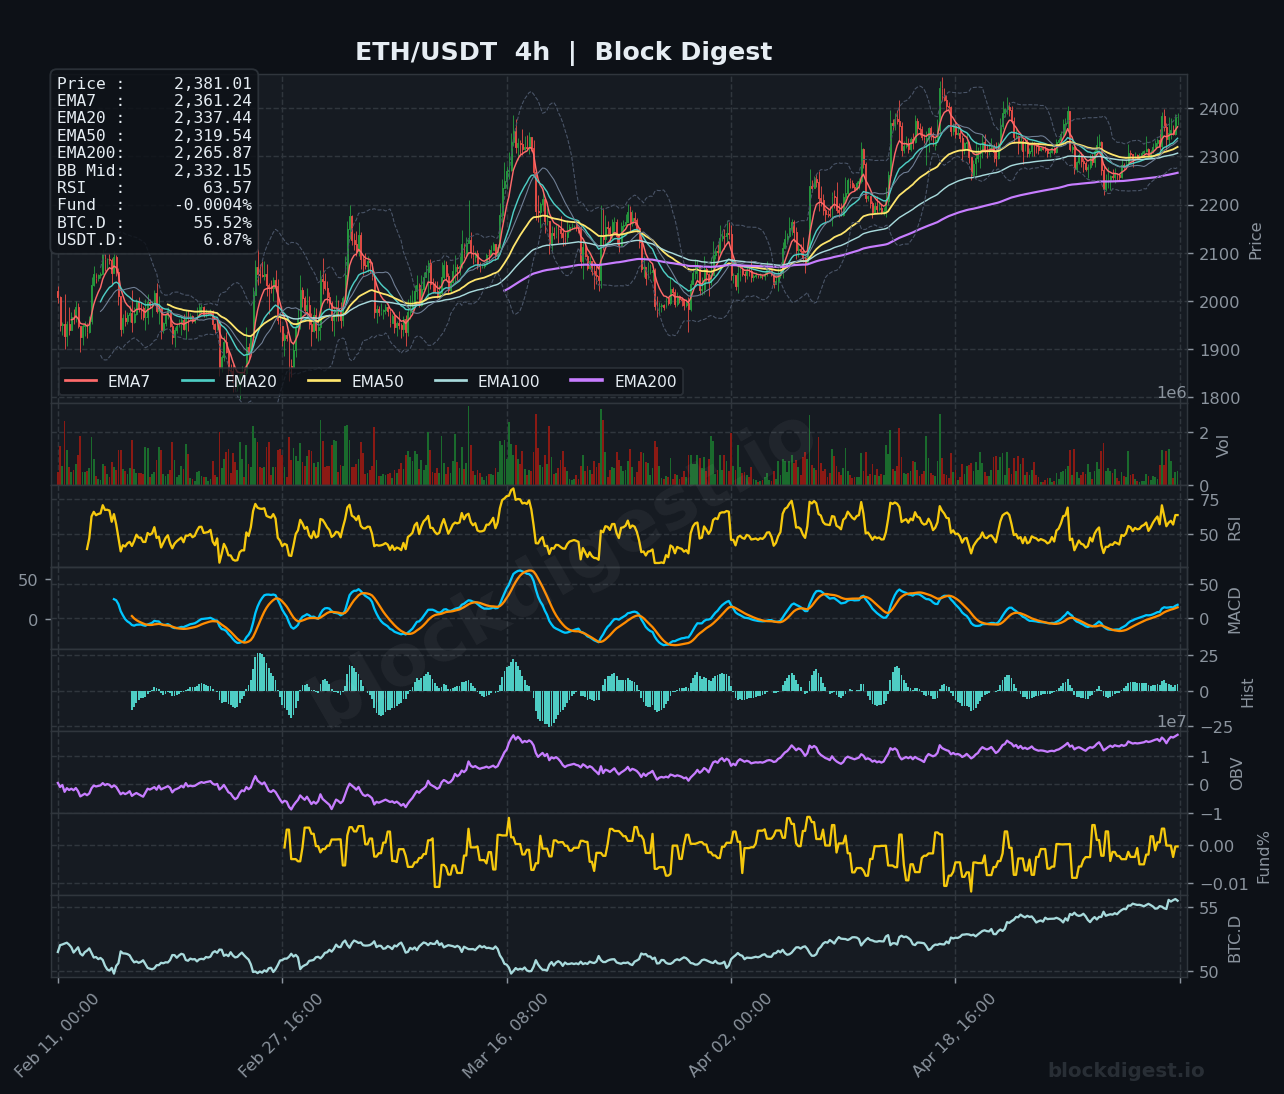
The multi-timeframe analysis reveals improving alignment across shorter durations but persistent resistance from higher timeframe moving averages. The 1-hour chart shows price above all key EMAs except the EMA200 ($2,320.21), indicating short-term bullish momentum, while the 4-hour timeframe displays price trading above EMA7 ($2,361.24) but facing resistance from the cluster between EMA20-50 ($2,337.44-$2,319.54). The daily chart presents a more cautious picture with price sandwiched between EMA20 and EMA50, reflecting indecision at a structural level. The $2,320-$2,350 zone emerges as critical multi-timeframe confluence where 1h EMA200, 4h EMA50, and daily EMA20 converge, serving as the pivotal battleground for directional commitment. Short-term strength is evident but requires confirmation from higher timeframe breakouts to establish sustainable trend continuation.
Key Levels to Watch
Resistance:
- $2,400-$2,420: Psychological barrier and previous swing high zone on the 4-hour timeframe, coinciding with recent rejection areas that would signal breakout confirmation
- $2,450: Upper Bollinger Band resistance on the 1-hour chart and multi-week resistance level requiring significant volume expansion to overcome
- $2,500: Major psychological level and previous distribution zone visible on the daily timeframe representing the next major upside target
Support:
- $2,348-$2,360: 1h EMA50 and Bollinger Band mid-line creating immediate demand zone crucial for maintaining short-term bullish structure
- $2,320-$2,330: Critical multi-timeframe confluence zone combining 1h EMA200, 4h EMA50, and the middle Bollinger Band on 4h chart
- $2,265-$2,280: Daily EMA50 and 4h EMA200 alignment representing the last line of defense before deeper retracement toward $2,150-$2,200 zone
Momentum & On-Chain Signals
The RSI readings paint a picture of recovering but not yet overheated momentum, with the 1-hour at 60.73 suggesting room for further upside, the 4-hour at 63.57 approaching overbought territory, and the daily at 59.53 indicating neutral-to-bullish conditions. The MACD on the 1-hour timeframe shows a bullish crossover with expanding histogram bars, while the 4-hour MACD remains slightly positive but flattening, and the daily MACD demonstrates early signs of bullish divergence with histogram compression. OBV trends across all timeframes show modest accumulation patterns without dramatic volume expansion, suggesting organic buying rather than parabolic speculation. The funding rate remains near neutral at -0.0004%, indicating balanced positioning without excessive leverage on either side, which typically precedes directional moves rather than exhaustion. Notably, no significant bearish divergences exist between price action and momentum indicators, supporting the constructive near-term outlook.
BTC Dominance & Market Sentiment
Bitcoin dominance stands at 55.52%, remaining elevated within recent ranges and suggesting continued capital concentration in BTC rather than broad altcoin outperformance. USDT dominance at 6.87% reflects moderate stablecoin holdings, neither signaling extreme risk-off positioning nor aggressive risk appetite, indicating a neutral-to-cautiously-constructive market environment. This configuration suggests that while ETH can grind higher on its own technical merit, explosive altcoin rallies typically require BTC.D to decline meaningfully, which has not yet materialized. The current dominance readings support a scenario of measured ETH appreciation rather than parabolic altseason dynamics.
Risk Scenarios
Bullish case: A decisive 4-hour close above $2,400 accompanied by expanding volume would confirm breakout structure and target the $2,450-$2,500 resistance zone. Sustained support above the $2,348-$2,360 range with RSI holding above 55 on the 4-hour chart would validate continuation toward $2,500-$2,550 over the coming week, with reclaiming the daily EMA100 confirming structural improvement.
Bearish case: Failure to hold the $2,320-$2,330 multi-timeframe support zone, particularly on a 4-hour close below this level with deteriorating RSI below 45, would signal breakdown risk toward $2,265 and potentially $2,150-$2,200. Loss of the daily EMA20 with accompanying volume would invalidate the recovery thesis and suggest resumed downside pressure within the broader range structure.
Outlook
ETH presents a cautiously constructive setup with near-term bias favoring gradual upside as long as the $2,320-$2,350 support structure holds. The next 24-48 hours will be critical for determining whether bulls can reclaim the $2,400 level and establish it as support, or if rejection leads to retesting of lower supports. Key triggers include a 4-hour close above $2,400 for bullish confirmation or a break below $2,320 for bearish invalidation. The $2,348-$2,360 zone represents the immediate line in the sand—holding above suggests continuation toward $2,450-$2,500, while losing it opens the door to $2,265 retests. With momentum indicators aligned constructively but not extended, and funding rates neutral, the path of least resistance appears modestly higher, though caution remains warranted given the resistance cluster just overhead and elevated BTC dominance limiting altcoin beta.
Disclaimer: This analysis is for informational purposes only and does not constitute financial advice. Cryptocurrency markets are highly volatile and unpredictable. All trading decisions should be made based on your own research and risk tolerance. Block Digest is not responsible for any financial losses incurred as a result of acting on this content.