BTC Dominance Explained: What It Means for Altcoins
Bitcoin dominance is the one chart I check before buying any altcoin.
I learned this the hard way — buying altcoins during periods of rising BTC dominance and watching them bleed in BTC terms even when the broader market looked okay. Once I understood what dominance was actually measuring, I stopped making that mistake.
In this guide, I’ll break down what BTC dominance is, how to read it alongside stablecoin dominance, what the combination signals about altcoin seasons, and how I use it in practice.
What is BTC Dominance?
BTC dominance (BTC.D) measures Bitcoin’s market cap as a percentage of the total cryptocurrency market cap.
BTC Dominance = Bitcoin Market Cap ÷ Total Crypto Market Cap × 100
If Bitcoin’s market cap is $1.3 trillion and the total crypto market is $2.6 trillion, BTC dominance is 50%. This number changes constantly as Bitcoin’s price moves relative to altcoins.
Historically, BTC dominance has ranged from around 35% (during peak altseason periods) to over 70% (during bear markets and BTC-led recoveries). The current level and direction of movement tells you a lot about where capital is flowing in the crypto market.
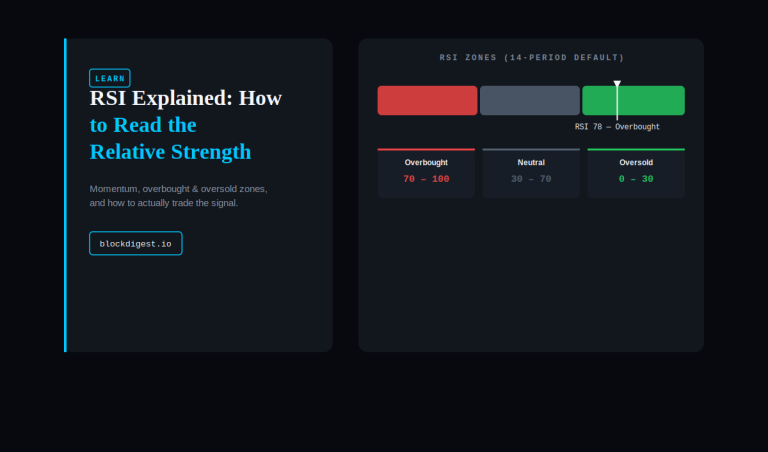
How to Read BTC Dominance
Rising BTC dominance
When BTC.D is rising, Bitcoin is outperforming the broader altcoin market. Capital is flowing into Bitcoin — either because investors are rotating from altcoins into BTC, or because altcoins are falling faster than Bitcoin during a market downturn. In either case, this is generally a bad environment for altcoin positions.
Falling BTC dominance
When BTC.D is falling, altcoins are outperforming Bitcoin. Capital is rotating from BTC into altcoins, or new money is flowing more aggressively into the altcoin market. This is the environment where altcoin positions tend to perform best — particularly if it’s happening alongside rising total market cap.
The direction matters more than the level
A BTC dominance of 55% isn’t inherently bullish or bearish for altcoins — it depends on whether it’s rising or falling. A declining dominance from 55% to 50% is a better altcoin environment than a rising dominance from 45% to 50%. Always focus on the trend, not just the current reading.
Stablecoin Dominance: The Other Half of the Picture
BTC dominance alone doesn’t tell the full story. You also need to watch stablecoin dominance (USDT.D) — the combined market cap of stablecoins as a percentage of total crypto market cap.
- Rising USDT.D — investors are moving into stablecoins (risk-off). Capital is leaving the market, not just rotating between assets.
- Falling USDT.D — stablecoin capital is being deployed into crypto assets (risk-on). This is the fuel for bull runs.
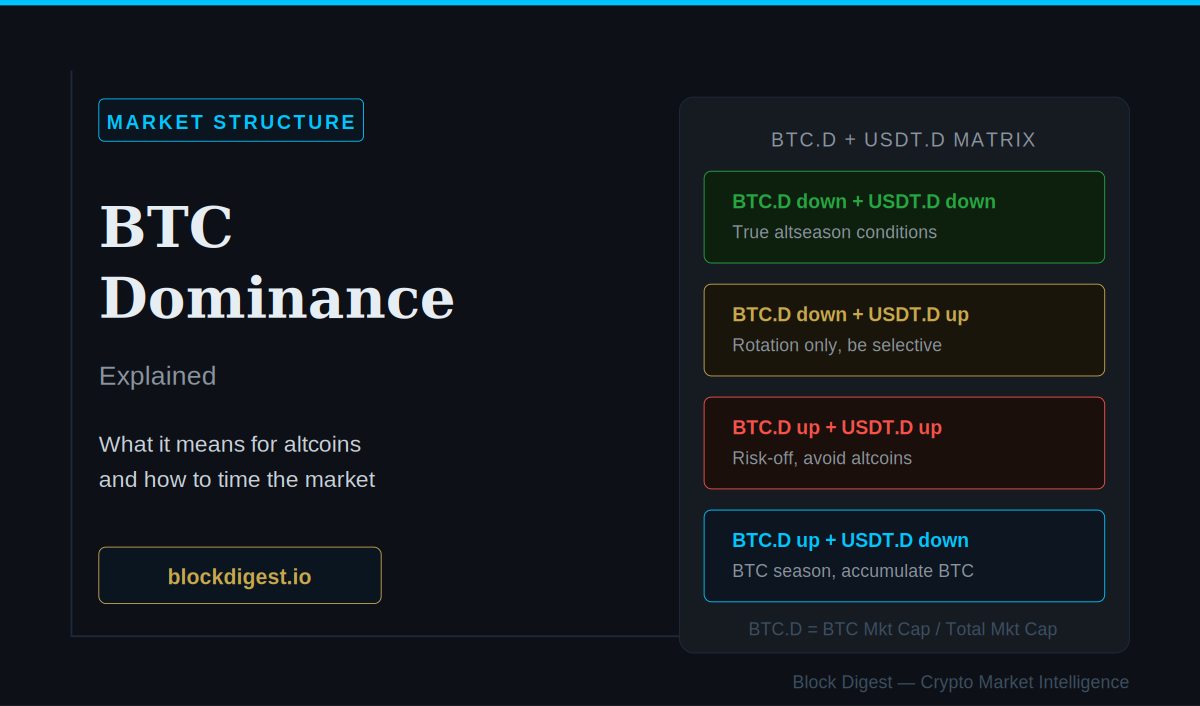
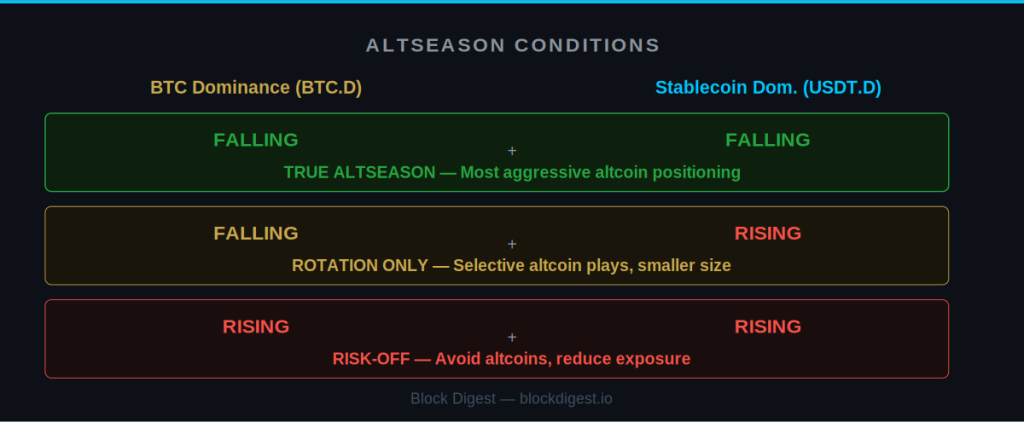
The Altseason Conditions
True altseason — when altcoins broadly outperform Bitcoin — historically requires two conditions to be met simultaneously:
- BTC.D falling — capital rotating from Bitcoin into altcoins
- USDT.D falling — stablecoin capital being deployed into the market
When both are falling together, it means new money is entering the market and it’s flowing toward altcoins. This combination has historically preceded the strongest altcoin rallies.
When BTC.D is falling but USDT.D is rising, it’s a less reliable signal — it may just be rotation within existing capital rather than genuine market expansion. And when both are rising, it’s a clear risk-off environment: capital is leaving altcoins and BTC alike in favor of stablecoins.
Historical Context
2017 Altseason
BTC dominance fell from around 65% to below 35% as the ICO boom drove massive capital flows into altcoins. This was the most dramatic altseason in crypto history — many altcoins gained 10x–100x while Bitcoin “only” tripled from its early 2017 levels.
2018–2020 Bear Market
BTC dominance recovered from its lows and climbed back above 70% as the bear market wiped out most altcoin projects. This period illustrated a key risk: during bear markets, altcoins typically fall much harder than Bitcoin — they can lose 90%+ from peak while BTC “only” drops 80%.
2021 Cycle
The 2021 bull run saw two distinct phases. The first half (early 2021) was BTC-dominated. BTC dominance then fell sharply in Q2–Q3 2021 as Ethereum, Solana, and the broader DeFi/NFT ecosystem exploded. This altcoin phase was exactly the BTC.D falling + USDT.D falling combination described above.
How I Use BTC Dominance
1. Pre-altcoin check
Before allocating to any altcoin, I check BTC.D direction. If it’s in a clear uptrend, I’m very selective — only the highest conviction plays, sized conservatively. If BTC.D is in a downtrend, I’m more willing to rotate into altcoin exposure.
2. Watch the BTC.D + USDT.D combination
I track both charts simultaneously. The combination tells me whether we’re in a genuine risk-on altcoin environment or just intra-market rotation. Both falling = more aggressive altcoin positioning. USDT.D rising despite BTC.D falling = more cautious.
3. Combine with on-chain indicators
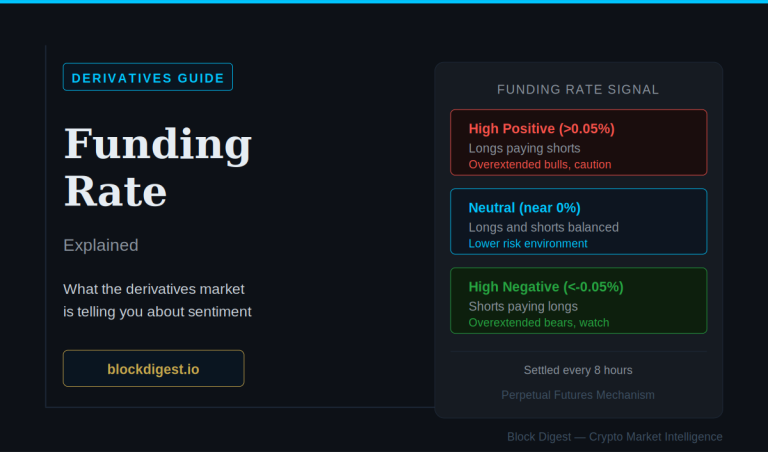
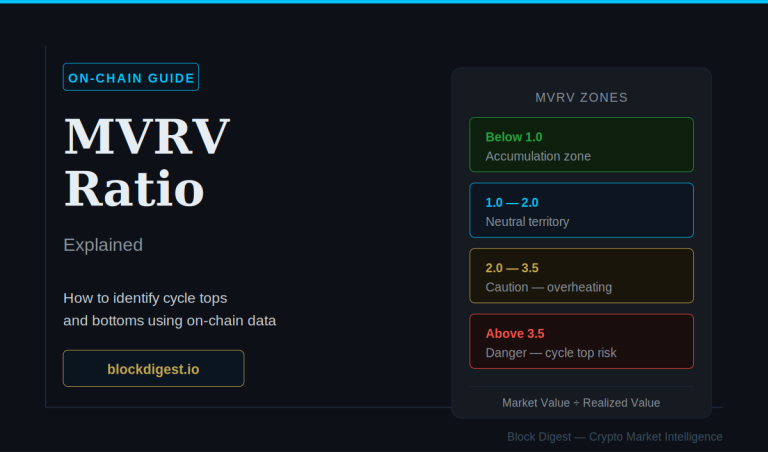
BTC dominance is a market structure indicator. I use it alongside MVRV (cycle positioning), SOPR (holder behavior), and funding rate (derivatives sentiment) to build a fuller picture. When all four are aligned — MVRV in healthy range, SOPR above 1.0 with support, funding neutral, BTC.D falling — that’s when I’m most confident in altcoin positioning.
4. Don’t fight the trend
BTC dominance trends can last months. Trying to call the exact top in BTC.D or the exact start of altseason is a losing game. I focus on confirming the trend has turned rather than anticipating it — a confirmed BTC.D downtrend with both conditions met is worth more than an early guess.
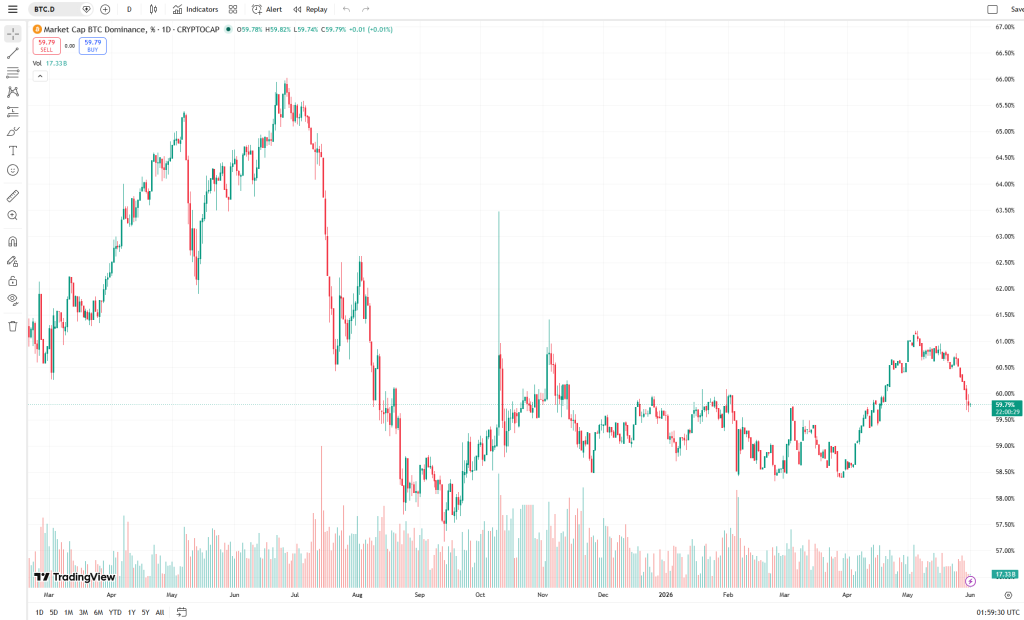
Where to Find BTC Dominance Data
- TradingView (tradingview.com) — Search “BTC.D” for BTC dominance and “USDT.D” for stablecoin dominance. Best charting tool for this.
- CoinMarketCap (coinmarketcap.com) — Shows total market cap and dominance breakdown at the top of the page.
- CryptoQuant (cryptoquant.com) — Additional dominance metrics with on-chain context.
Key Takeaways
- BTC dominance measures Bitcoin’s share of the total crypto market cap
- Rising BTC.D = bad for altcoins; falling BTC.D = good for altcoins
- Direction matters more than the absolute level
- True altseason requires both BTC.D and USDT.D falling simultaneously
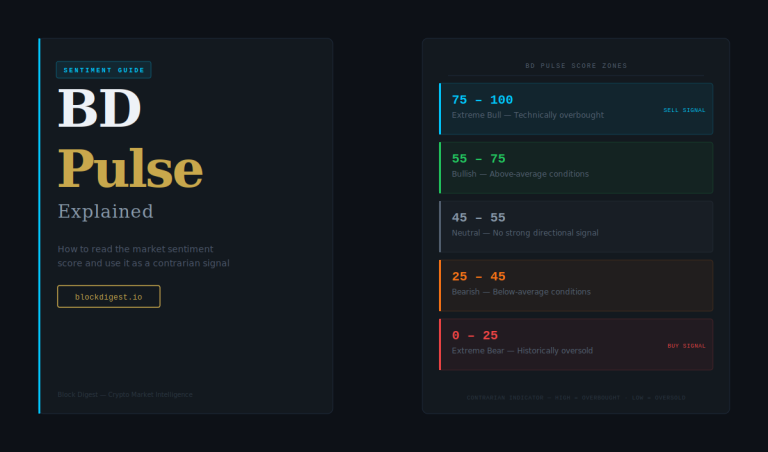
- Best used alongside MVRV, SOPR, and funding rate for a complete market picture
The Complete On-Chain Toolkit
This is the final guide in our on-chain indicators series. Here’s a quick reference to everything we’ve covered:
- MVRV Ratio — Where are we in the macro cycle?
- SOPR — What are current holders doing right now?
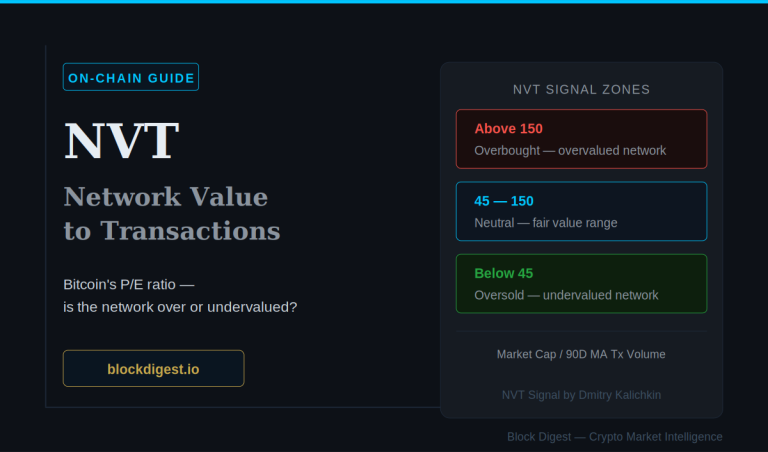
- NVT Ratio — Is the network fundamentally over or undervalued?
- Funding Rate — What is the derivatives market signaling?
- BTC Dominance — Where is capital flowing in the broader market?
Used together, these five indicators give you a comprehensive read on Bitcoin and the broader crypto market from multiple angles — macro cycle positioning, holder behavior, network valuation, derivatives sentiment, and capital flows.
Disclaimer: This content is for informational purposes only and does not constitute financial advice. Cryptocurrency markets are highly volatile and unpredictable. All trading decisions should be made based on your own research and risk tolerance. Block Digest is not responsible for any financial losses incurred as a result of acting on this content.