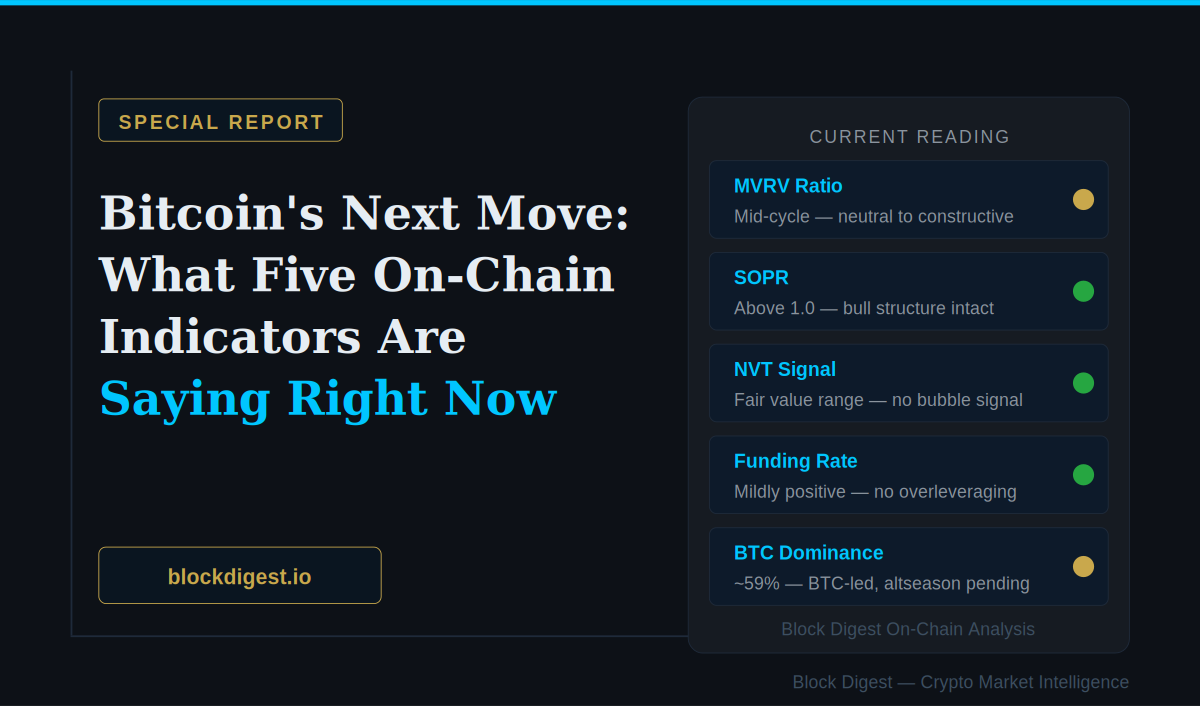
Bitcoin’s Next Move: What Five On-Chain Indicators Are Saying Right Now
Five bitcoin on-chain indicators — read together, in real time. This is what the data is saying right now.
Every time Bitcoin makes a significant move — up or down — the same debate plays out across crypto Twitter: is this the start of something bigger, or a bull trap? A dead cat bounce, or a genuine reversal?
Price action alone can’t answer that question. But on-chain data can give you a much cleaner read on where things actually stand — not what traders are feeling in the moment, but what the underlying data says about market positioning, holder behavior, and network fundamentals.
In this report, I’m running through five of the most reliable on-chain indicators simultaneously — MVRV Ratio, SOPR, NVT Ratio, Funding Rate, and BTC Dominance — and reading them together to get a composite picture of where Bitcoin sits right now.
Why Five Indicators Instead of One
Each indicator has a blind spot. MVRV tells you about the macro cycle but doesn’t tell you about short-term holder behavior. SOPR tells you what’s happening right now but not whether the network is fundamentally over or undervalued. Funding rate tells you about derivatives sentiment but not about spot market positioning.
The real signal comes from convergence. When multiple independent indicators point in the same direction, the reading becomes much more reliable. When they diverge, it’s a signal to wait for more clarity before making significant moves.
Here’s where each one stands.
1. MVRV Ratio — Cycle Positioning
The MVRV ratio compares Bitcoin’s current market value to its realized value — the aggregate cost basis of all holders. It’s the best single indicator for answering: where are we in the macro cycle?
- Below 1.0 — Bitcoin trading below average cost basis. Historical accumulation zone.
- 1.0–2.0 — Neutral. Healthy market, not overextended.
- 2.0–3.5 — Caution zone. Holders sitting on significant unrealized profit.
- Above 3.5 — Historical cycle top territory.
As of writing, MVRV sits in the neutral-to-cautious range — above 1.0 but well below the danger thresholds seen at previous cycle tops. This suggests the market is in a mid-cycle position: not a screaming buy like the 2022 lows, but not a screaming sell like the 2021 peaks either. The macro backdrop is constructive.
→ For a full breakdown of MVRV, see our guide: What is MVRV Ratio and How to Use It
2. SOPR — What Holders Are Doing Right Now
While MVRV gives you the macro picture, SOPR (Spent Output Profit Ratio) tells you what’s happening in real time — specifically, whether coins being moved on-chain are being sold at a profit or a loss.
The critical level is 1.0. In bull markets, dips toward 1.0 tend to find support — holders refuse to sell at breakeven, creating buying pressure. In bear markets, recoveries to 1.0 tend to fail — underwater holders use the relief to exit.
Currently, aSOPR is holding above 1.0 with occasional dips that recover quickly. This is consistent with a bull market structure — the 1.0 level is acting as support rather than resistance. Sellers are generally in profit, but not at the extreme spike levels that historically precede sharp corrections.
→ For a full breakdown of SOPR, see our guide: SOPR Explained: How to Read Spent Output Profit Ratio
3. NVT Ratio — Network Fundamentals
The NVT ratio — Network Value to Transactions — is Bitcoin’s equivalent of a P/E ratio. It asks: is the market cap justified by the actual economic activity flowing through the network?
NVT Signal thresholds to watch:
- Above 150 — Historically overbought
- 45–150 — Fair value range
- Below 45 — Historically oversold
Current NVT Signal is within the fair value range — neither screaming overvaluation nor deeply discounted. One important caveat: NVT only measures Layer 1 on-chain activity. As Lightning Network adoption grows, a meaningful portion of Bitcoin’s economic activity doesn’t show up in this metric. This means current NVT readings may slightly overstate valuation relative to true network utility.
That said, the absence of an extreme NVT reading is itself useful information — it confirms this isn’t a 2017-style speculative bubble where price ran far ahead of any genuine network usage.
→ For a full breakdown of NVT, see our guide: NVT Ratio: Bitcoin’s P/E Ratio Explained
4. Funding Rate — Derivatives Sentiment
Funding rate measures whether the perpetual futures market is leaning bullish or bearish — and more importantly, whether it’s leaning too far in either direction.
Extreme positive funding (above 0.05–0.1% per 8 hours) signals an overcrowded long trade — the market is overextended and vulnerable to a long squeeze. Extreme negative funding signals the opposite: too many shorts, ripe for a squeeze recovery.
Current funding rate is mildly positive — longs are paying shorts, but not at the extreme levels seen at the 2021 peaks or during the most euphoric phases of recent rallies. This is a healthy signal: there’s bullish positioning in the derivatives market, but not the kind of extreme overleveraging that tends to precede sharp corrections.
Worth watching: if funding starts climbing toward the 0.05%+ range on a sustained basis, that would be a signal to tighten risk management and avoid adding to long positions.
→ For a full breakdown of Funding Rate, see our guide: Funding Rate Guide: What It Tells You About Market Sentiment
5. BTC Dominance — Capital Flow
BTC dominance tells you where capital is flowing within the crypto ecosystem — toward Bitcoin specifically, or into the broader altcoin market.
The combination to watch is BTC.D alongside stablecoin dominance (USDT.D):
- BTC.D falling + USDT.D falling — True altseason conditions
- BTC.D rising + USDT.D falling — BTC-led bull run, altcoins lagging
- Both rising — Risk-off, capital leaving crypto
Currently, BTC dominance is elevated at approximately 59–60% — near multi-year highs. This reflects a market that has been predominantly Bitcoin-led in the current cycle. Stablecoin dominance has been declining from its peaks, which is a positive signal for overall crypto market health.
The implication: we’re likely still in a BTC-dominated phase. Meaningful altcoin outperformance historically follows a confirmed turn lower in BTC.D — that confirmation hasn’t happened yet at the time of writing.
→ For a full breakdown of BTC Dominance, see our guide: BTC Dominance Explained: What It Means for Altcoins
Reading the Five Together
Here’s the composite picture as of this writing:
- MVRV — Mid-cycle, neutral-to-constructive. Not a danger zone.
- SOPR — Bull market structure intact. 1.0 acting as support.
- NVT — Fair value range. No bubble-level overvaluation signal.
- Funding Rate — Mildly positive, no extreme overleveraging.
- BTC Dominance — Elevated, BTC-led market. Altseason not yet confirmed.
The convergence across these five indicators points to a mid-cycle bull market environment — not a euphoric top, not a capitulation bottom. The macro structure is constructive, on-chain behavior is healthy, derivatives aren’t dangerously overleveraged, and the network isn’t priced like a speculative bubble.
What this doesn’t tell you is the short-term price direction. On-chain data is a macro tool, not a timing tool. Bitcoin could correct 20% tomorrow and all five of these indicators would still be consistent with a continuation of the current cycle. What they do is tell you whether to treat such a correction as a buying opportunity or a warning sign — right now, the weight of evidence points toward the former.
What to Watch Next
The indicators that would change this picture most significantly:
- MVRV approaching 3.0+ — Start reducing exposure, tighten risk management
- SOPR spiking above 1.2 on sustained basis — Profit-taking pressure building
- Funding rate above 0.05% sustained — Derivatives overheating, long squeeze risk rising
- BTC.D confirmed downtrend + USDT.D falling — Altseason conditions met, rotate accordingly
None of these signals are flashing red right now. But they’re the ones worth tracking as the cycle develops.
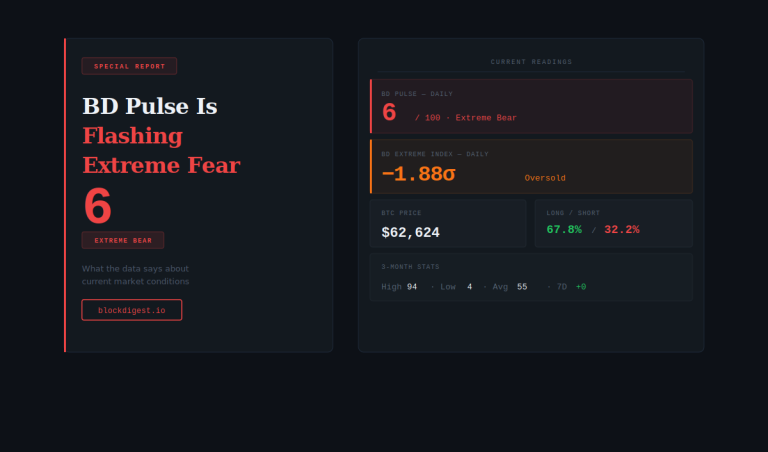
For a live composite read across multiple indicators simultaneously, check BD Pulse — updated daily. On-chain data sources used in this report include Glassnode and CryptoQuant.
Disclaimer: This content is for informational purposes only and does not constitute financial advice. Cryptocurrency markets are highly volatile and unpredictable. All trading decisions should be made based on your own research and risk tolerance. Block Digest is not responsible for any financial losses incurred as a result of acting on this content.