What Is the RSI?
The Relative Strength Index (RSI) is a momentum oscillator developed by J. Welles Wilder Jr. and introduced in his 1978 book New Concepts in Technical Trading Systems. It measures the speed and magnitude of recent price changes to evaluate whether an asset is potentially overextended to the upside or the downside. The result is plotted as a single line that moves between 0 and 100, making it one of the most readable indicators available to traders.
In crypto markets, the RSI has become a default tool on virtually every charting platform. Its simplicity is part of its appeal, but that same simplicity causes many traders to misuse it — treating every touch of the 70 or 30 level as an automatic buy or sell signal. Understanding the mechanics behind the number is essential before applying it to a live trade.
How the RSI Is Calculated
RSI is derived from the average gain versus the average loss over a specified lookback period. The default and most widely used period is 14 candles, whether those candles are hourly, daily, or weekly.
The core formula works in two steps. First, a Relative Strength (RS) value is calculated by dividing the average gain of up-closes by the average loss of down-closes over the lookback window. Then that RS value is converted into the 0–100 scale:
RSI = 100 − (100 / (1 + RS))
In plain terms: when an asset closes higher most of the time over those 14 periods, RS is large, and the RSI reading climbs toward 100. When losses dominate, RS shrinks toward zero and the RSI drops toward 0. You do not need to calculate this manually — every major platform does it automatically — but knowing what drives the number helps you interpret its behavior correctly.
Reading the Key Zones
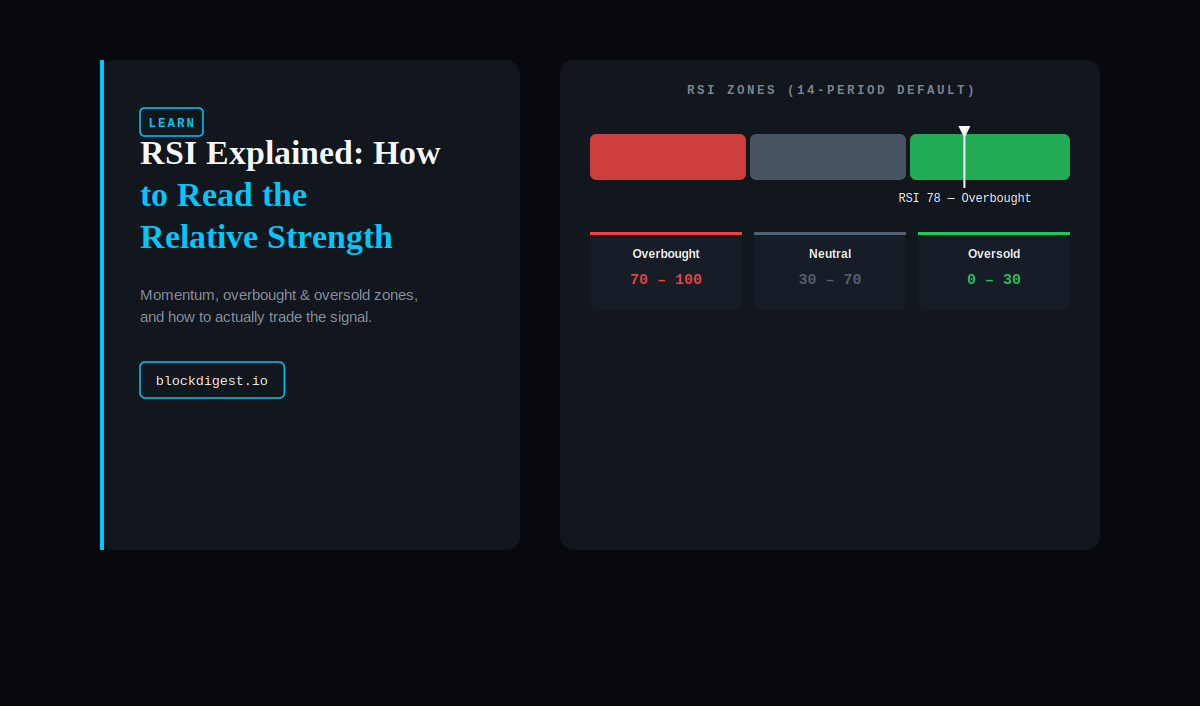
Wilder’s original framework defined two threshold zones that traders still use today:
- Overbought (RSI above 70): The asset has gained aggressively relative to its recent history. This does not mean a reversal is guaranteed — in a strong bull trend, RSI can stay above 70 for extended periods. It does mean the risk/reward of chasing new longs may be deteriorating.
- Oversold (RSI below 30): The asset has lost value rapidly relative to recent history. Again, this is not an automatic buy signal. In a strong downtrend, RSI can remain below 30 for days or even weeks without a meaningful bounce.
- Neutral zone (30–70): This is where the RSI spends most of its time. A reading near 50 suggests roughly balanced momentum — neither buyers nor sellers have a clear short-term edge.
Some traders adjust the thresholds to 80/20 in highly volatile crypto markets to reduce false signals, while others tighten them to 60/40 during trending conditions. The standard 70/30 split remains the most common reference point.
RSI Divergence: The Signal Most Traders Overlook
Price action and RSI do not always move in the same direction, and those moments of disagreement — called divergences — are often more actionable than a simple overbought or oversold reading.
Bullish divergence occurs when price prints a lower low while RSI prints a higher low. This suggests that even though the price has continued to fall, selling momentum is weakening. Many traders interpret this as an early warning that a reversal or at least a relief rally may be building.
Bearish divergence is the inverse: price makes a higher high, but RSI makes a lower high. Buying momentum is fading even as price grinds upward, which can foreshadow a pullback or trend reversal.
Divergence signals carry more weight when they form at structurally important levels — near prior support or resistance, at round numbers, or after an extended trend. A divergence in the middle of a range with no other confluence is far less reliable.
RSI in Trending vs. Ranging Markets
One of the most common RSI mistakes is applying it the same way regardless of market structure. The indicator behaves very differently depending on whether the market is trending or ranging.
In a ranging market, RSI oscillates predictably between overbought and oversold zones, and mean-reversion trades triggered by those extremes tend to work reasonably well. Buying near 30 and selling near 70 can generate consistent results when price is bouncing between defined support and resistance levels.
In a strong trend, however, that same approach consistently loses money. During a Bitcoin bull run, for example, RSI can stay above 70 for weeks while price doubles. Traders who short every overbought reading get stopped out repeatedly. In trending environments, many experienced traders flip the logic: they treat a pullback to the 40–50 zone as a potential re-entry point rather than waiting for a full reset to 30.
Identifying whether the market is trending or ranging before applying RSI is not optional — it is the difference between using the tool correctly and using it as a coin flip.
Choosing the Right Timeframe
RSI readings on different timeframes tell different stories, and they do not always agree. A 1-hour RSI might be deeply oversold while the daily RSI is still neutral or even overbought. This creates apparent contradictions that confuse newer traders.
The standard approach is to use a higher timeframe for context and a lower timeframe for entry. If the daily RSI suggests the broader momentum is still bullish (reading in the 50–65 range with no bearish divergence), then a short-term dip that pushes the 4-hour RSI toward 35 could represent a buying opportunity aligned with the dominant trend rather than a warning sign.
The 14-period default is appropriate for most swing trading use cases. Scalpers often shorten it to 7 or 9 periods for more sensitivity. Position traders sometimes extend it to 21 periods to smooth out noise. The period adjustment changes how reactive the indicator is — shorter periods react faster but generate more false signals; longer periods are smoother but lag more on entries.
Common RSI Mistakes to Avoid
- Treating overbought/oversold as automatic signals: Context matters. An RSI of 72 in a strong uptrend is very different from an RSI of 72 after a parabolic spike with high volume exhaustion.
- Ignoring the trend direction: Using RSI as a counter-trend tool in a one-sided market is one of the fastest ways to deplete a trading account.
- Using RSI in isolation: RSI works best when combined with price structure, volume analysis, or complementary indicators such as moving averages or the MACD. A signal confirmed by multiple tools carries more weight than RSI alone.
- Over-optimizing the period: Backtesting dozens of RSI period settings until one looks perfect on historical data often produces a parameter that has no predictive value going forward.
Key Takeaways
The RSI is a momentum oscillator that measures the ratio of recent gains to recent losses on a 0–100 scale. Readings above 70 signal overbought conditions; readings below 30 signal oversold conditions — but neither guarantees a reversal. Divergence between price and RSI can be a leading indicator of trend weakness. The indicator performs differently in trending versus ranging markets, and combining it with timeframe analysis and price structure improves its reliability significantly. Like any indicator, RSI is a lens for interpreting momentum, not a rule-based trading system on its own.
Disclaimer: This content is for informational purposes only and does not constitute financial advice. Cryptocurrency markets are highly volatile and unpredictable. All trading decisions should be made based on your own research and risk tolerance. Block Digest is not responsible for any financial losses incurred as a result of acting on this content.
Stay Ahead of the Market
Follow BlockDigest for crypto market intelligence, research and real-time updates.