What is MVRV Ratio and How to Use It
MVRV ratio explained — and why it was the first on-chain indicator that completely changed how I think about market cycles.
One of the first on-chain indicators I started tracking was the MVRV ratio — and it completely changed how I think about market cycles.
Before I found it, I was doing what most people do: watching price charts, reading Reddit threads, and guessing. The MVRV ratio didn’t make me a perfect trader overnight, but it gave me something I didn’t have before — a way to measure whether Bitcoin was genuinely cheap or dangerously expensive relative to what people actually paid for it.
In this guide, I’ll break down exactly what MVRV is, how to read it, and how I personally use it alongside other indicators.
What is Market Value?
Market Value (MV) is what most people mean when they say “market cap.” It’s simple:
Market Value = Current Price × Circulating Supply
If Bitcoin is trading at $65,000 and there are 19.7 million BTC in circulation, the market value is roughly $1.28 trillion. This number changes every second as price moves.
What is Realized Value?
This is where it gets interesting.
Realized Value (RV) doesn’t use the current price. Instead, it values each coin at the price it last moved on-chain — essentially, the price the current holder paid for it.
Realized Value = Sum of (each coin × price when it last moved)
Think of it as the aggregate cost basis of all Bitcoin holders. If a coin hasn’t moved since it was bought at $20,000, it contributes $20,000 to the Realized Value — not today’s price. This makes Realized Value a much more stable, “grounded” measure of Bitcoin’s worth. It represents the actual capital invested in the network.
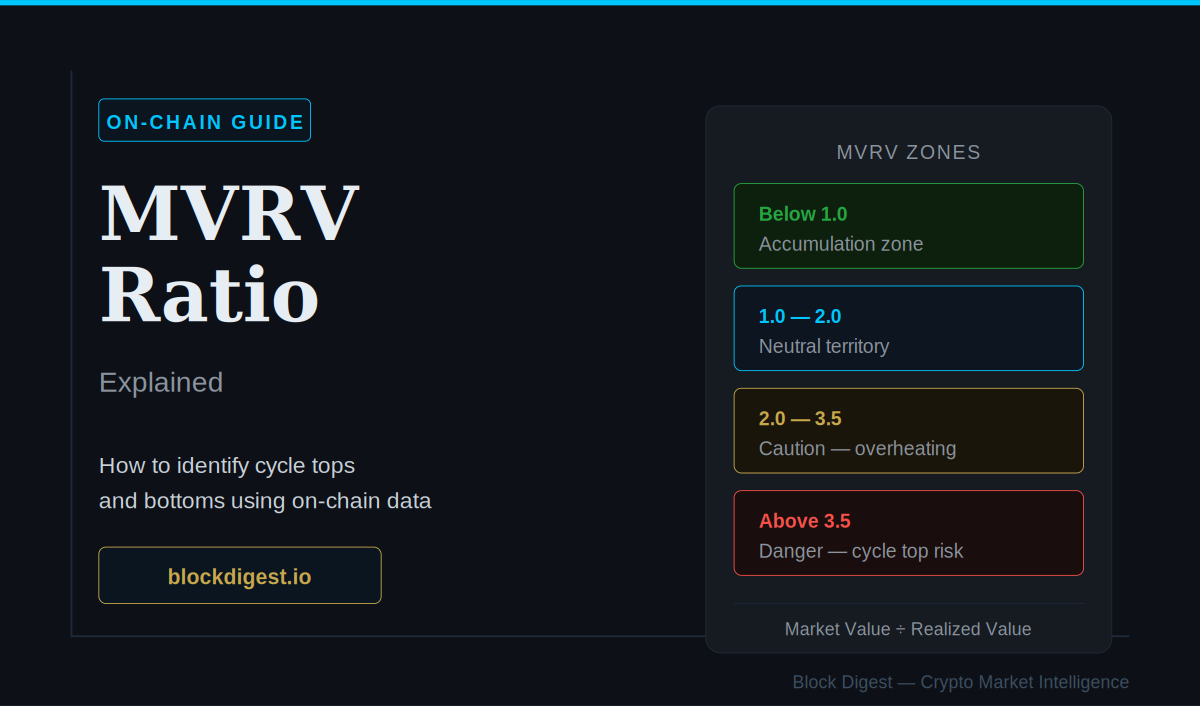
MVRV = Market Value ÷ Realized Value
Now we can put it together:
MVRV Ratio = Market Value ÷ Realized Value
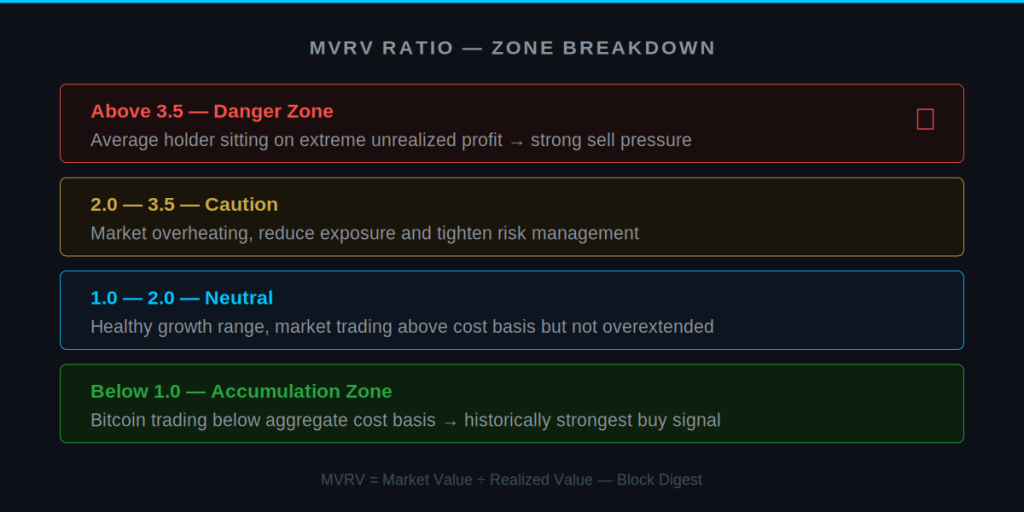
- MVRV = 1.0 — The market is trading exactly at the average cost basis. Neutral territory.
- MVRV < 1.0 — Bitcoin is trading below the average purchase price of all holders. Historically a strong accumulation zone.
- MVRV = 2.0–3.0 — Holders are sitting on meaningful unrealized profit. Market is heating up.
- MVRV > 3.5 — Extreme overvaluation territory. Historically aligned with cycle tops.
When MVRV is very high, the average holder is sitting on large unrealized gains and has a strong incentive to sell. When it’s below 1, the average holder is underwater — which tends to shake out weak hands and mark capitulation bottoms.
Historical Examples
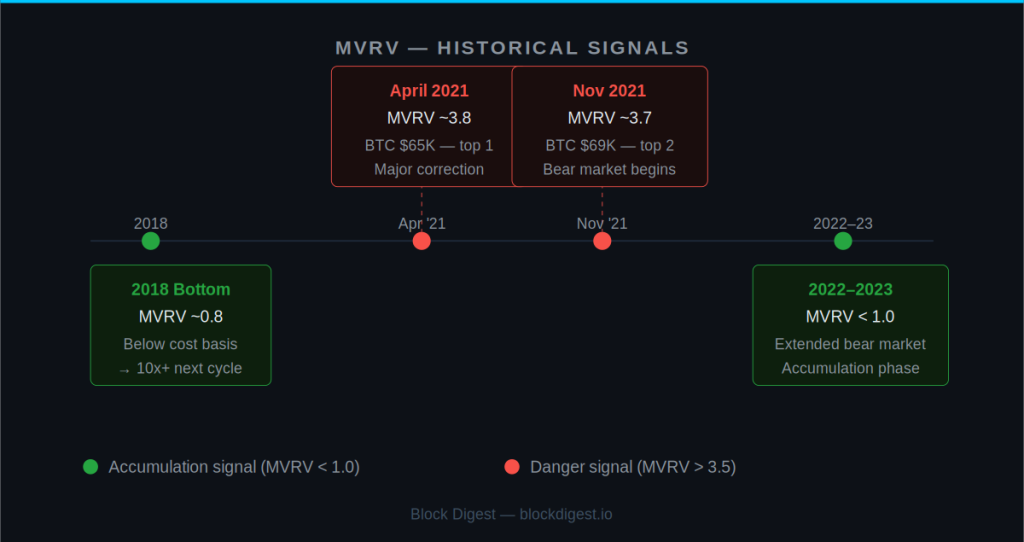
2018 Bottom
After the 2017 bull run collapsed, MVRV fell below 1.0 in late 2018 — briefly touching 0.8. It was one of the clearest signals that Bitcoin was trading below the aggregate cost basis. Those who accumulated in that zone saw 10x+ returns in the following cycle.
2021 Cycle Top
In April 2021, MVRV hit approximately 3.8 before Bitcoin’s first major correction from $65K. It briefly recovered and reached similar levels again in November 2021 near $69K before the prolonged bear market began. Both peaks were visible in MVRV before price rolled over.
2022–2023 Bear Market
MVRV spent much of 2022 below 1.0, consistent with prior bear market capitulation phases. The extended time below 1.0 historically correlates with long-term accumulation opportunities.
How I Use MVRV
A few things I’ve learned from tracking this indicator:
1. Never use it alone
MVRV is a macro-level indicator. It tells you where you are in the cycle, not when to buy this week. I always cross-reference it with SOPR (which shows what current holders are doing in real time) and BTC Dominance.
2. Pay attention to time spent below 1.0
A single dip below 1.0 can be noise. But extended periods — weeks or months — below 1.0 have historically preceded major multi-year bull runs. Patience matters here.
3. Use it for conviction, not precision
When MVRV is at 3.5+, I don’t look for new entries. When it’s near or below 1.0, I’m more aggressive about accumulating. It helps me override the emotional pull of chasing green candles at cycle tops.
4. Check the Z-Score variant
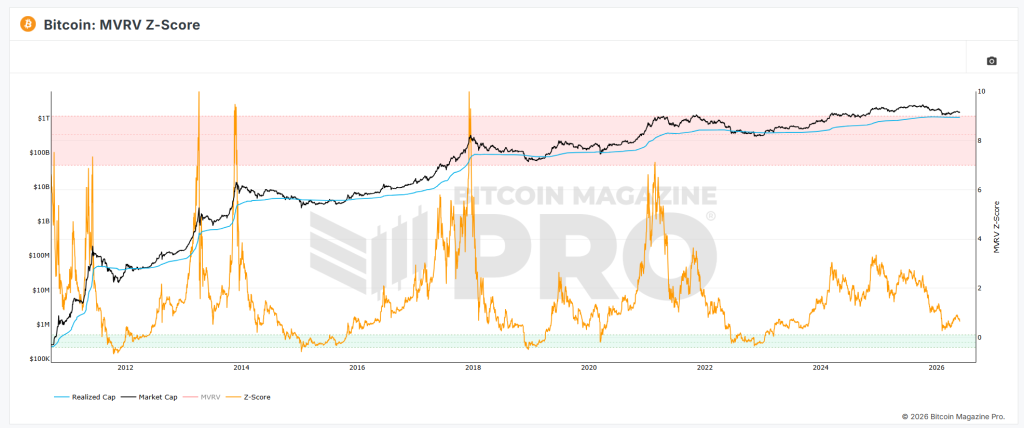
The MVRV Z-Score normalizes the ratio against historical standard deviations, which makes it easier to compare across different cycles. It’s available on Glassnode and Bitcoin Magazine Pro.
Where to Find MVRV Data
These are the tools I use:
- Bitcoin Magazine Pro (bitcoinmagazinepro.com) — Free MVRV charts with full historical data. Great starting point.
- Glassnode (glassnode.com) — The most comprehensive on-chain platform. Basic MVRV data is free; advanced metrics require a paid plan.
- CryptoQuant (cryptoquant.com) — Strong alternative with solid MVRV and exchange flow data.
All three show slightly different values due to methodology differences (how they handle lost coins, wrapped tokens, etc.), but the overall signal is consistent.
Key Takeaways
- MVRV compares Bitcoin’s current market value to its realized (cost-basis) value
- Below 1.0 = historically strong accumulation zone; above 3.5 = historically dangerous territory
- It’s a cycle-positioning tool, not a day-trading signal
- Best used in combination with other on-chain indicators
What to Read Next
MVRV tells you where the market stands in the cycle. But to understand what current holders are actually doing — whether they’re taking profit or holding through pain — you need SOPR.
→ SOPR Explained: How to Read Spent Output Profit Ratio
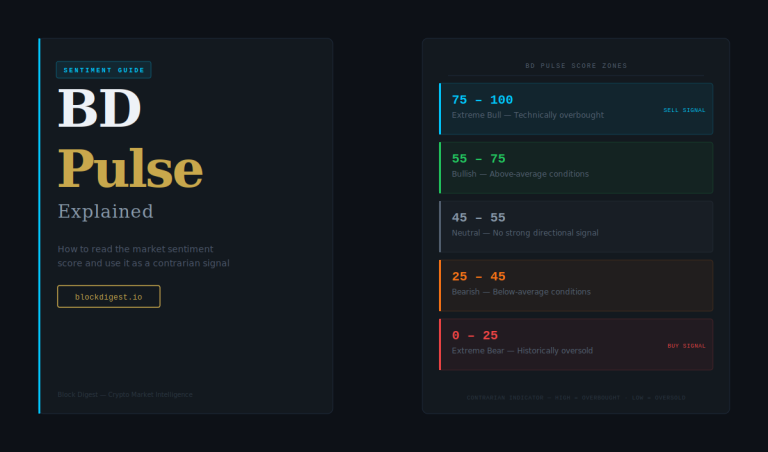
MVRV is also part of the broader indicator framework that powers BD Pulse — Block Digest’s composite market sentiment score. Check the live BD Pulse reading to see where current market conditions stand right now.
Disclaimer: This content is for informational purposes only and does not constitute financial advice. Cryptocurrency markets are highly volatile and unpredictable. All trading decisions should be made based on your own research and risk tolerance. Block Digest is not responsible for any financial losses incurred as a result of acting on this content.