NVT Ratio: Bitcoin’s P/E Ratio Explained
NVT ratio explained — Bitcoin’s equivalent of a P/E ratio, and one of the cleanest ways to assess whether the network is fundamentally over or undervalued.
If you’ve ever used a P/E ratio to value a stock, the NVT ratio will feel immediately familiar.
I came across NVT after spending too much time staring at price charts and wondering whether Bitcoin was “expensive” or “cheap” in any meaningful sense. Price alone doesn’t answer that question — you need some reference point for what the network is actually worth relative to how it’s being used. That’s exactly what NVT provides.
In this guide, I’ll break down what NVT is, how to read it, why the NVT Signal variant is more practical, and where it falls short.
What is NVT Ratio?
NVT stands for Network Value to Transactions. It was introduced by analyst Willy Woo and is calculated as:
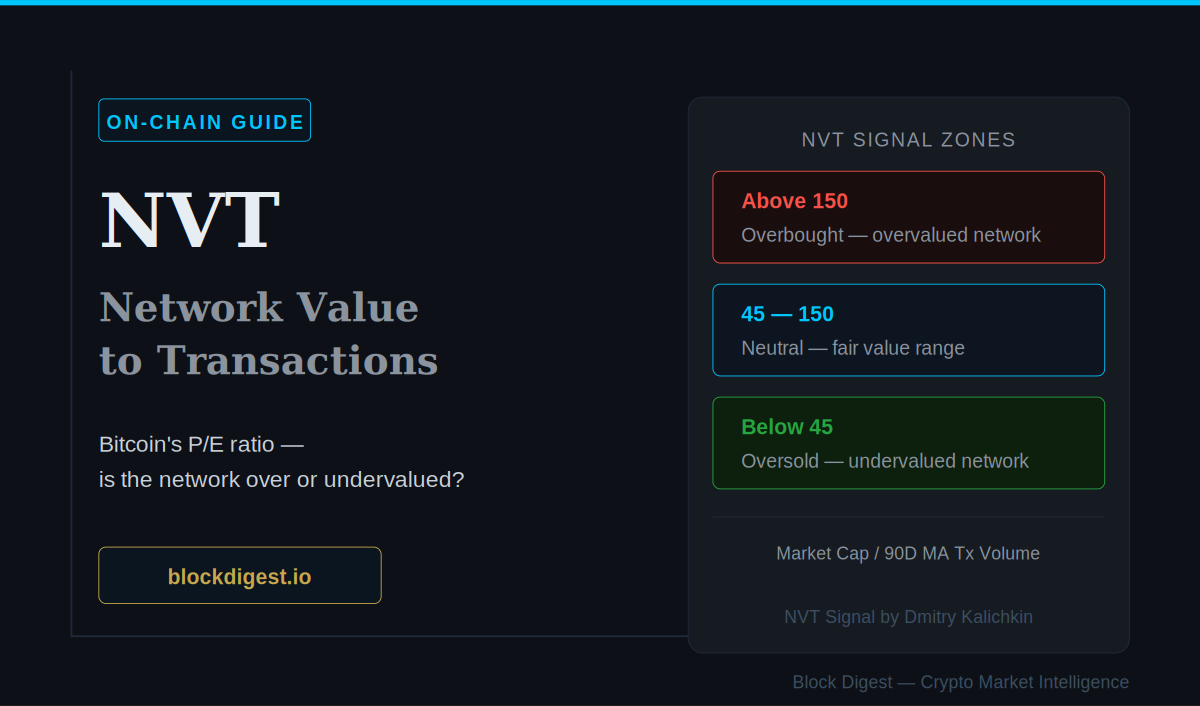
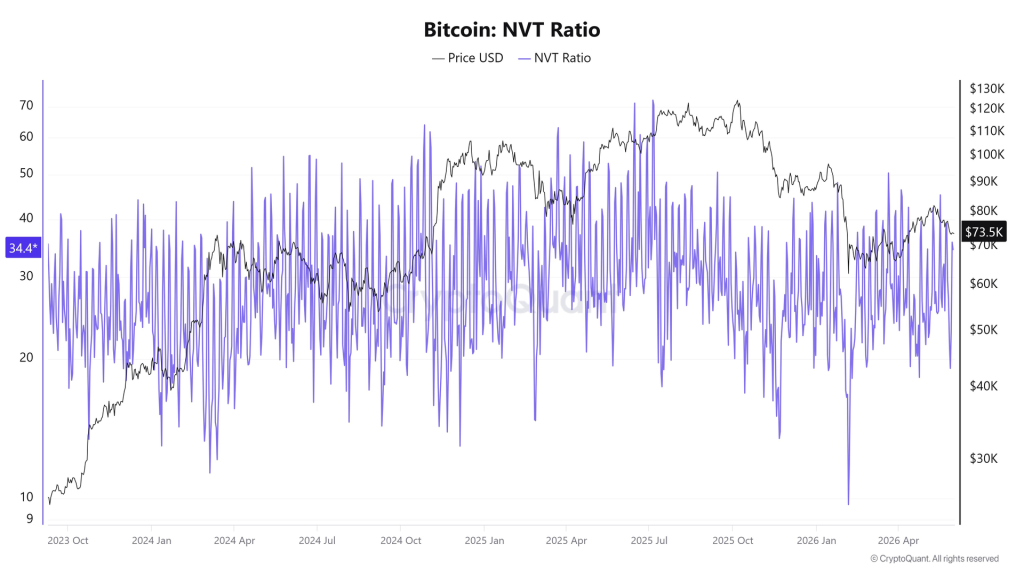
NVT Ratio = Network Value (Market Cap) ÷ Daily On-Chain Transaction Volume (USD)
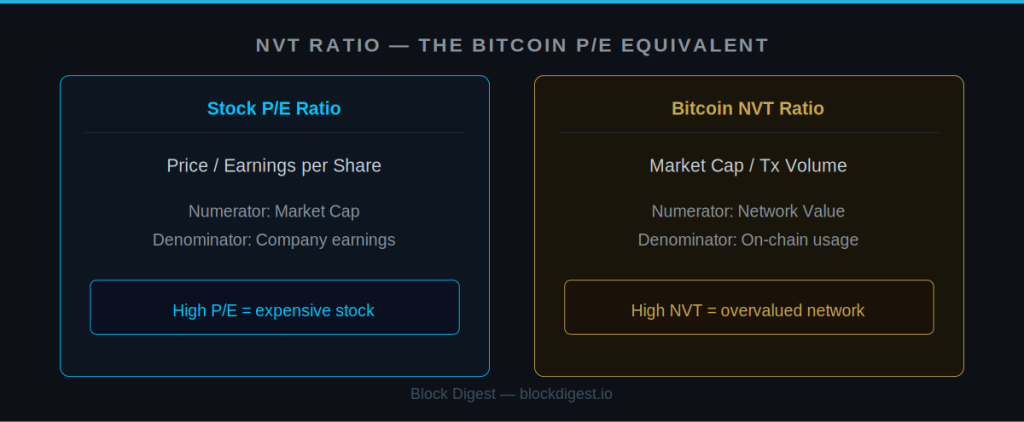
The logic is straightforward: Bitcoin’s market cap is the “price” you’re paying for the network. The daily transaction volume passing through it is a proxy for how much utility the network is actually providing. Divide one by the other and you get a sense of whether you’re paying a lot or a little for that utility.
Think of it like a P/E ratio for a business:
- High NVT — you’re paying a high price relative to actual network usage. Historically associated with overvaluation.
- Low NVT — network usage is high relative to price, or price is low relative to usage. Historically associated with undervaluation.
NVT Signal: The More Practical Version
Raw NVT is noisy because daily transaction volume fluctuates a lot. NVT Signal (NVT-S), developed by Dmitry Kalichkin, addresses this by using a 90-day moving average of transaction volume in the denominator instead of the raw daily figure.
NVT Signal = Network Value ÷ 90-Day MA of Transaction Volume
This smoothing makes NVT-S more reliable as a signal. The general thresholds most analysts use:
- NVT-S above 150 — historically overbought, elevated risk of correction
- NVT-S between 45–150 — neutral zone, fair value range
- NVT-S below 45 — historically oversold, potential accumulation zone
These thresholds aren’t fixed rules — they’ve shifted somewhat across cycles as Bitcoin has matured — but they provide a useful reference frame.
Historical Examples
2017–2018 Bubble
During the 2017 bull run, NVT Signal climbed well above 150 as Bitcoin’s market cap grew far faster than actual on-chain transaction volume. This divergence — price going up, utility not keeping pace — was a warning sign. NVT-S was signaling overvaluation months before the crash.
2018–2019 Bear Market Bottom
As Bitcoin bottomed out around $3,000–$4,000 in late 2018 and early 2019, NVT Signal dropped to historically low levels. Network usage remained meaningful while price had collapsed — a classic undervaluation signal according to NVT logic.
2021 Cycle
The 2021 bull run was interesting for NVT. While price reached all-time highs, on-chain transaction volume also grew substantially — meaning NVT didn’t spike as dramatically as in 2017. This reflected a maturing network with more genuine usage, though NVT-S still reached elevated levels near both cycle tops.
The Key Limitation: Layer 2 and DeFi
NVT has a significant blind spot that becomes more important over time: it only measures on-chain Layer 1 transactions.
As more Bitcoin activity moves to the Lightning Network, wrapped BTC on other chains, and institutional custody solutions, a growing portion of Bitcoin’s economic activity doesn’t show up in the on-chain transaction data NVT uses. This means NVT can read as “high” (suggesting overvaluation) even when total network utility — including off-chain activity — is genuinely growing.
This doesn’t make NVT useless, but it does mean you should treat it as one data point among several rather than a definitive valuation signal — especially in the current environment where Lightning Network adoption is increasing.
How I Use NVT
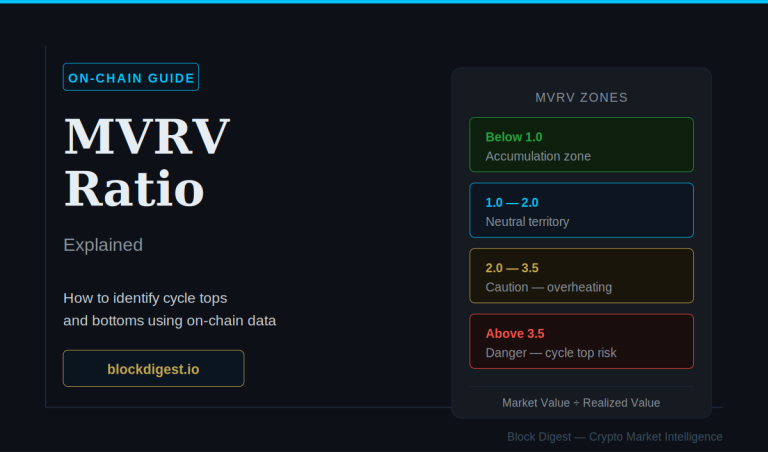
1. Cross-check with MVRV
MVRV tells me about holder cost basis. NVT tells me about network utility relative to price. When both are signaling overvaluation simultaneously — MVRV above 3.0 and NVT-S above 150 — that’s a stronger case for reducing exposure than either indicator alone.
2. Watch for divergence
The most interesting NVT signal is divergence: when price is rising but on-chain volume is flat or declining, NVT climbs — suggesting the price move isn’t backed by genuine network activity. Historically these divergences have preceded corrections.
3. Use it for macro framing, not short-term timing
Like MVRV, NVT is a cycle-level indicator. It’s not going to tell you whether Bitcoin goes up or down next week. But it’s useful for answering the bigger question: is Bitcoin fundamentally cheap or expensive right now relative to how the network is actually being used?
Where to Find NVT Data
- Glassnode (glassnode.com) — NVT Ratio and NVT Signal available. Some metrics require a paid plan.
- Bitcoin Magazine Pro (bitcoinmagazinepro.com) — Free NVT charts with full historical data.
- CryptoQuant (cryptoquant.com) — Good alternative with NVT data and clean interface.
Key Takeaways
- NVT compares Bitcoin’s market cap to on-chain transaction volume — a P/E ratio for the network
- NVT Signal (90-day MA) is smoother and more practical than raw NVT
- Above 150 = historically overbought; below 45 = historically oversold
- Key limitation: doesn’t capture Layer 2 or off-chain activity
- Best used alongside MVRV and SOPR for a fuller picture
What to Read Next
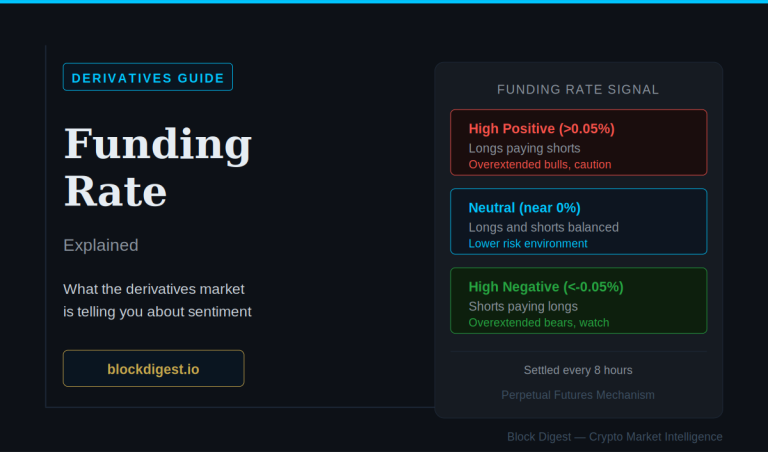
MVRV, SOPR, and NVT all give you a read on Bitcoin’s macro positioning. But none of them tell you what the derivatives market is signaling about near-term sentiment. For that, you need to understand Funding Rate.
→ Funding Rate Guide: What It Tells You About Market Sentiment
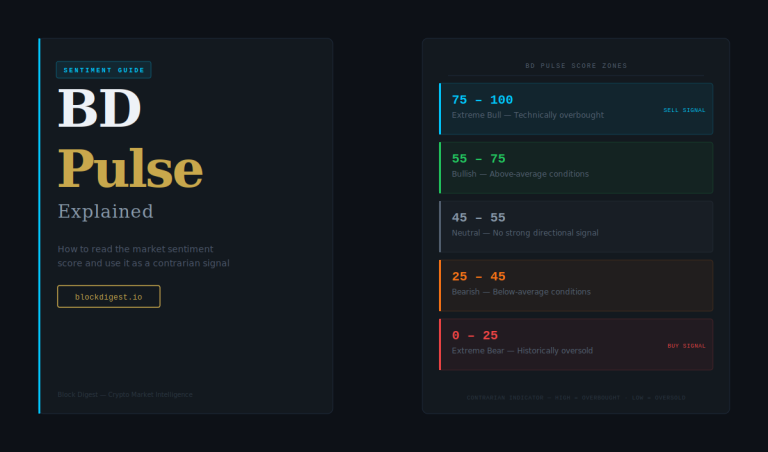
NVT is also part of the broader indicator framework behind BD Pulse — Block Digest’s composite market sentiment score. See the live BD Pulse reading to understand where current market conditions sit across multiple indicators simultaneously.
Disclaimer: This content is for informational purposes only and does not constitute financial advice. Cryptocurrency markets are highly volatile and unpredictable. All trading decisions should be made based on your own research and risk tolerance. Block Digest is not responsible for any financial losses incurred as a result of acting on this content.