SOPR Explained: How to Read Spent Output Profit Ratio
If MVRV tells you where the market is in the cycle, SOPR tells you what holders are doing right now.
I started paying attention to SOPR after noticing that price action alone wasn’t enough to tell me whether a rally was sustainable or a dead cat bounce. SOPR filled that gap — it shows whether the people actually selling are doing so at a profit or a loss, which turns out to be one of the most reliable reads on short-term market psychology.
In this guide, I’ll break down what SOPR is, how to read it, and the key difference between bull and bear market interpretations that most people get wrong.
What is SOPR?
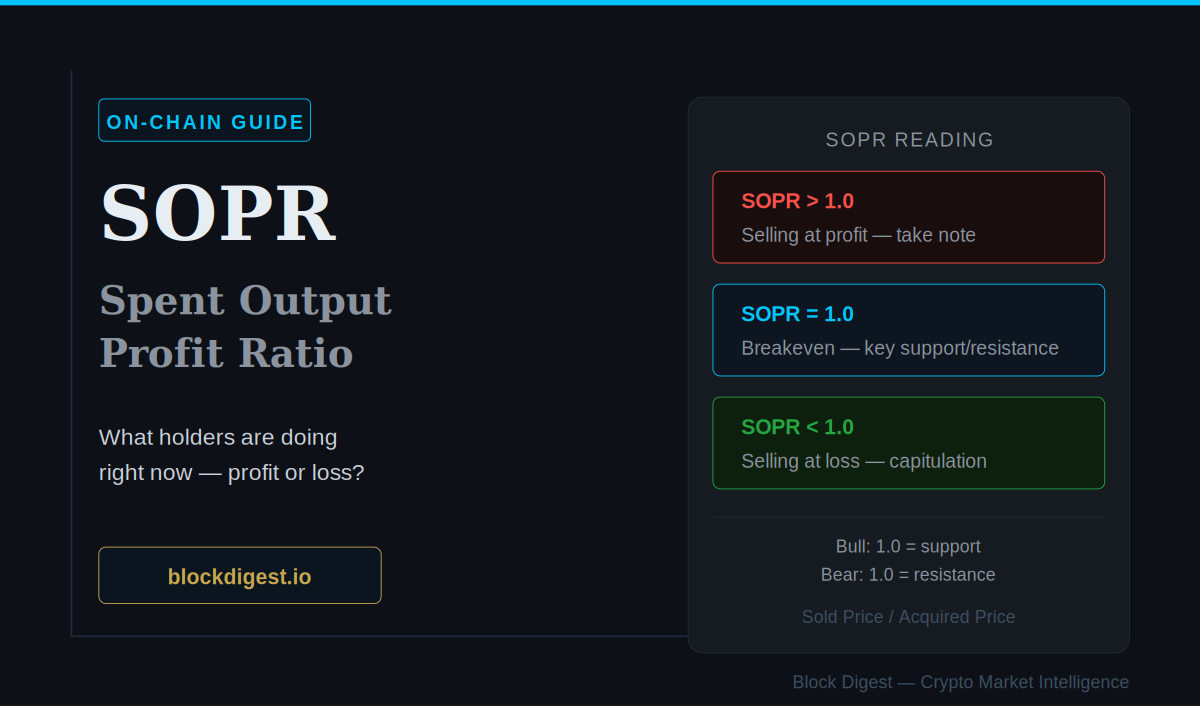
SOPR stands for Spent Output Profit Ratio. It measures whether Bitcoin being moved on-chain is being sold at a profit or a loss.
Here’s the formula:
SOPR = Price when coin was sold ÷ Price when coin was last moved (acquired)
- SOPR > 1 — coins are being moved at a profit. Sellers are in the green.
- SOPR = 1 — coins are moving at breakeven. No profit, no loss.
- SOPR < 1 — coins are being moved at a loss. Sellers are underwater.
Think of it as a real-time read on whether the market is in a “taking profits” mode or a “panic selling” mode.
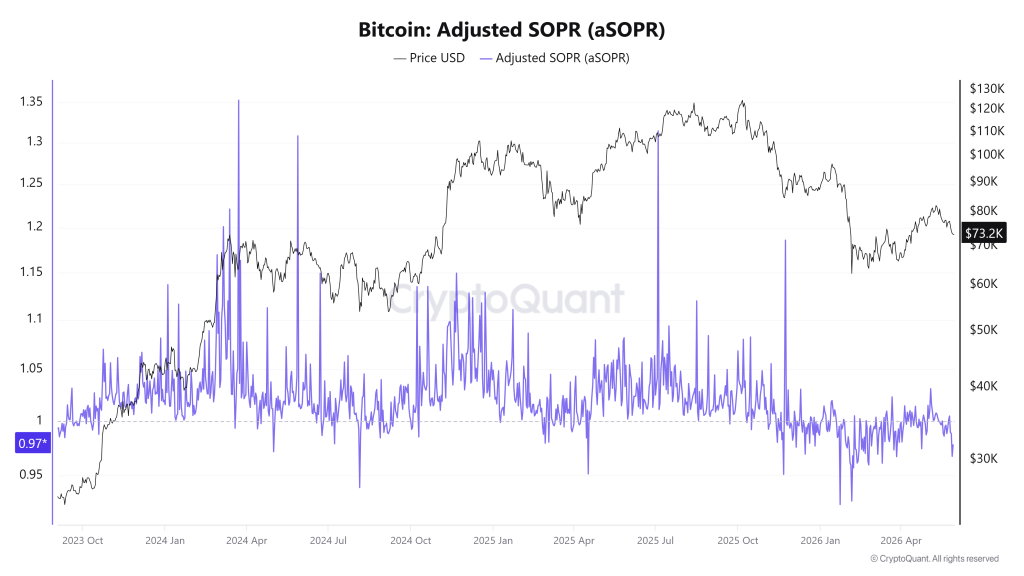
aSOPR: The More Useful Version
Raw SOPR includes coins that move within hours of acquisition — basically short-term transfers and exchange activity that create a lot of noise. Adjusted SOPR (aSOPR) filters out coins moved within 1 hour, which removes that noise and gives a cleaner signal.
For most practical purposes, when analysts refer to SOPR they usually mean aSOPR. It’s the version worth tracking on a daily basis.
Reading SOPR: The Key Level is 1.0
The most important thing to understand about SOPR is that the 1.0 level acts differently depending on whether we’re in a bull or bear market. This is the part most people miss when they first start using it.
In a bull market
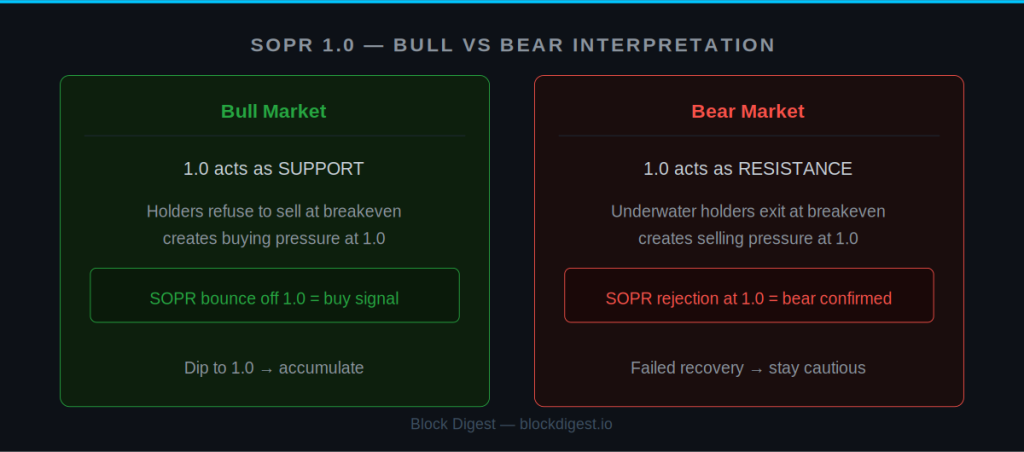
When SOPR dips toward 1.0 and bounces back up, it’s a bullish signal. Here’s the logic: in a bull market, holders who bought at a loss are reluctant to sell below their cost basis. When price dips to their breakeven point, they hold — and that resistance to selling creates support. A SOPR bounce off 1.0 in a bull market is often a good entry opportunity.
In a bear market
The logic inverts. In a bear market, the 1.0 level becomes resistance. Holders who have been sitting at a loss see any return to breakeven as a relief exit — they sell the moment they’re back to zero. This creates selling pressure every time SOPR tries to recover to 1.0. A failed recovery at 1.0 in a bear market confirms the downtrend is intact.
The transition signal
One of the most powerful SOPR signals is when the market transitions from bear to bull: SOPR breaks above 1.0 and holds above it. This suggests sellers are now consistently selling at a profit, which means the psychological dynamic has shifted. It’s not a perfect timing signal, but historically these sustained breaks above 1.0 have coincided with early bull market phases.
SOPR and Market Psychology
What makes SOPR useful is that it’s grounded in human behavior, not just price. Consider what each reading actually means:
- High SOPR (well above 1.0) — a large portion of sellers are cashing out significant profits. This can signal local tops, especially if SOPR spikes sharply.
- SOPR near 1.0 in a bull market — holders are reluctant to sell at breakeven. Often marks good accumulation zones during corrections.
- SOPR below 1.0 sustained — capitulation territory. People are selling at a loss, often out of fear or forced liquidation. Historically precedes recoveries.
- SOPR spike followed by quick drop — short-term traders taking profit quickly. Can signal exhaustion in a rally.
How I Use SOPR
1. Combine it with MVRV for cycle context
MVRV tells me where we are in the macro cycle. SOPR tells me what’s happening right now. When MVRV is in the 1.0–2.0 range (neutral) and SOPR bounces off 1.0, that’s a more confident accumulation signal than either indicator alone.
2. Watch for SOPR compression
When SOPR stays very close to 1.0 for an extended period — neither spiking up nor dropping hard below — it often signals a consolidation phase before a significant move. The market is in equilibrium. These periods are worth watching closely.
3. Don’t use it for precise entries
SOPR is a sentiment and flow indicator, not a price prediction tool. It tells you about the psychology of current sellers, which is useful context — but it won’t tell you exactly when to buy or sell. I treat it as one layer of a larger picture alongside price structure, volume, and other on-chain data.
4. Short-Term Holder SOPR (STH-SOPR)
Glassnode and CryptoQuant also offer SOPR broken down by holder type. STH-SOPR (Short-Term Holder SOPR) tracks coins moved within the last 155 days and is particularly useful for reading near-term sentiment. When STH-SOPR drops well below 1.0, it means recent buyers are panic-selling — which historically marks local bottoms.
Where to Find SOPR Data
- Glassnode (glassnode.com) — The most comprehensive source. aSOPR and STH-SOPR available on the free tier.
- CryptoQuant (cryptoquant.com) — Good alternative, clean interface.
- Bitcoin Magazine Pro (bitcoinmagazinepro.com) — Free SOPR charts with full historical data going back to 2011.
Key Takeaways
- SOPR measures whether coins being moved on-chain are in profit or loss
- The 1.0 level is support in bull markets and resistance in bear markets
- aSOPR filters out short-term noise and is the more practical version to track
- Best used alongside MVRV for macro context and price structure for timing
- STH-SOPR is useful for identifying local bottoms when recent buyers panic-sell
What to Read Next
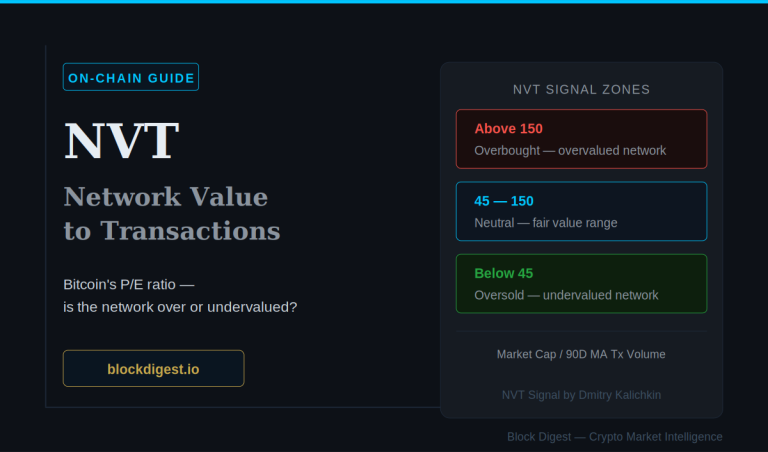
MVRV and SOPR both tell you about the cost basis of holders. But neither tells you whether Bitcoin is fundamentally overvalued or undervalued relative to actual network usage. That’s what the NVT Ratio does.
→ NVT Ratio: Bitcoin’s P/E Ratio Explained
Disclaimer: This content is for informational purposes only and does not constitute financial advice. Cryptocurrency markets are highly volatile and unpredictable. All trading decisions should be made based on your own research and risk tolerance. Block Digest is not responsible for any financial losses incurred as a result of acting on this content.