Bitcoin on-chain data at $77K — what the metrics are actually showing beneath the price action.
Bitcoin has pulled back sharply from its all-time high of $126,000 reached in late 2025, now consolidating around the $77,000 level. Price action alone tells only half the story. Beneath the surface, on-chain data is painting a picture that price charts simply cannot — and right now, that picture is more nuanced than the bearish sentiment suggests.
Here’s what the key metrics are actually showing.
MVRV Z-Score: Not Where Bear Markets End, But Not Where They Begin Either
The MVRV Z-Score measures the gap between Bitcoin’s current market value and its realized value — essentially, how far the market has moved from the average cost basis of all holders. Historically, readings above 6 have marked cycle tops. Readings near zero or below have flagged accumulation phases.
As of mid-May 2026, the MVRV Z-Score sits around 1.0–1.2. That’s a long way from the euphoric highs that have historically preceded major crashes. For context, the 2021 cycle top printed near 7. This cycle’s peak barely touched 3.5 before the correction began.
More importantly, every time Bitcoin’s MVRV has entered the 1.0–1.5 band and subsequently reversed higher, the 12-month forward return has been positive — seven out of seven times since 2013. That doesn’t guarantee a bottom is in, but it does suggest the risk/reward profile is meaningfully different from where it stood at $126,000.
SOPR: Short-Term Holders Are Capitulating
The Spent Output Profit Ratio (SOPR) tracks whether coins being moved on-chain are doing so at a profit or a loss. When SOPR drops below 1.0, it means the average coin being sold is underwater — a signal of capitulation.
Current readings show aSOPR in the 0.97–0.99 range (neutral to mildly bearish), while Short-Term Holder SOPR has fallen to 0.92–0.96. In plain terms, recent buyers are selling at an average 4–8% realized loss. This kind of capitulatory pressure from short-term holders, while uncomfortable to watch, is typically what clears the path for the next move higher.
Long-term holders, meanwhile, are sitting on approximately 78% of circulating supply near all-time high levels. They’re not selling. That structural divergence between weak hands exiting and strong hands holding is historically a late-bear or early-recovery dynamic.
Exchange Reserves: Supply Is Leaving the Market
Bitcoin exchange reserves have collapsed to approximately 2.21 million BTC — a 7 to 9-year low, representing just 5.88% of total supply. For comparison, reserves peaked above 3.3 million BTC in early 2022.
Coins leaving exchanges don’t disappear — they move into cold storage and self-custody. This behavior signals that holders are not positioning to sell. They’re removing supply from the market entirely.
The trend has been consistent. A single session in March 2026 logged 32,000 BTC departing exchanges in one day — the largest single-day outflow on record. This kind of structural supply drain, happening alongside a price correction, is not typical of a market that’s about to collapse further.
Funding Rate: Leverage Is Clean
One of the cleaner signals right now is the funding rate on perpetual futures. After periods of aggressive leveraged long positioning, funding has normalized to near-neutral levels. This means the market isn’t overleveraged in either direction — there isn’t a crowded short position waiting to be squeezed, but there also isn’t the kind of reckless long leverage that tends to precede sharp liquidation cascades.
A neutral funding environment typically means the next big move will be driven by spot demand rather than derivatives positioning. That tends to produce more sustainable price action in either direction.
What the Data Is Saying
Taking these signals together, a clear picture emerges:
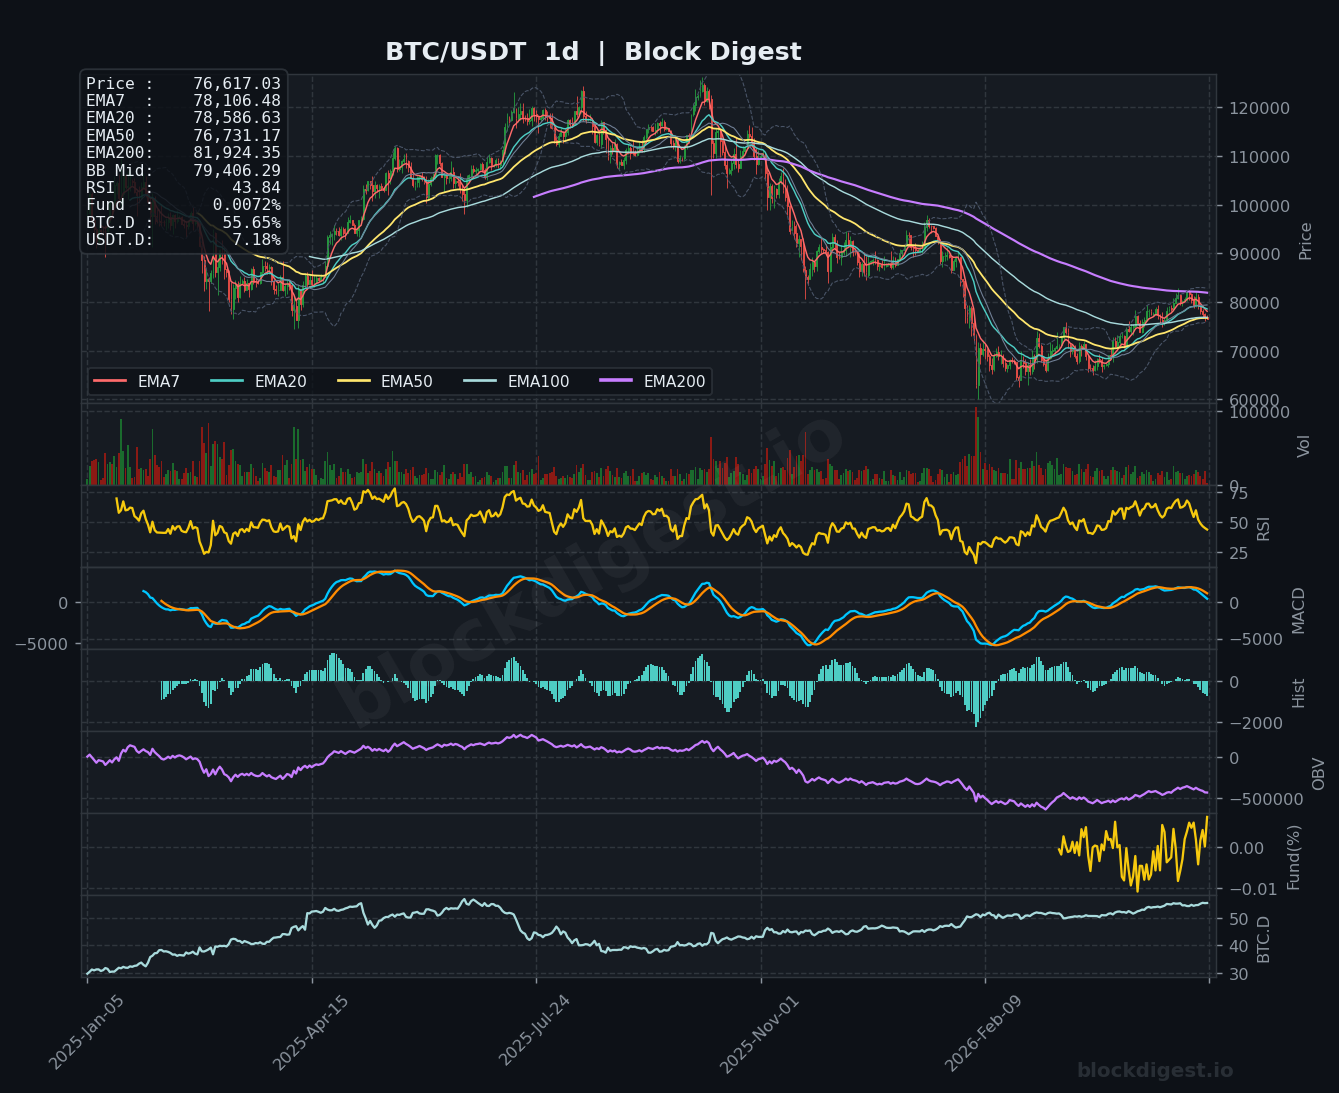
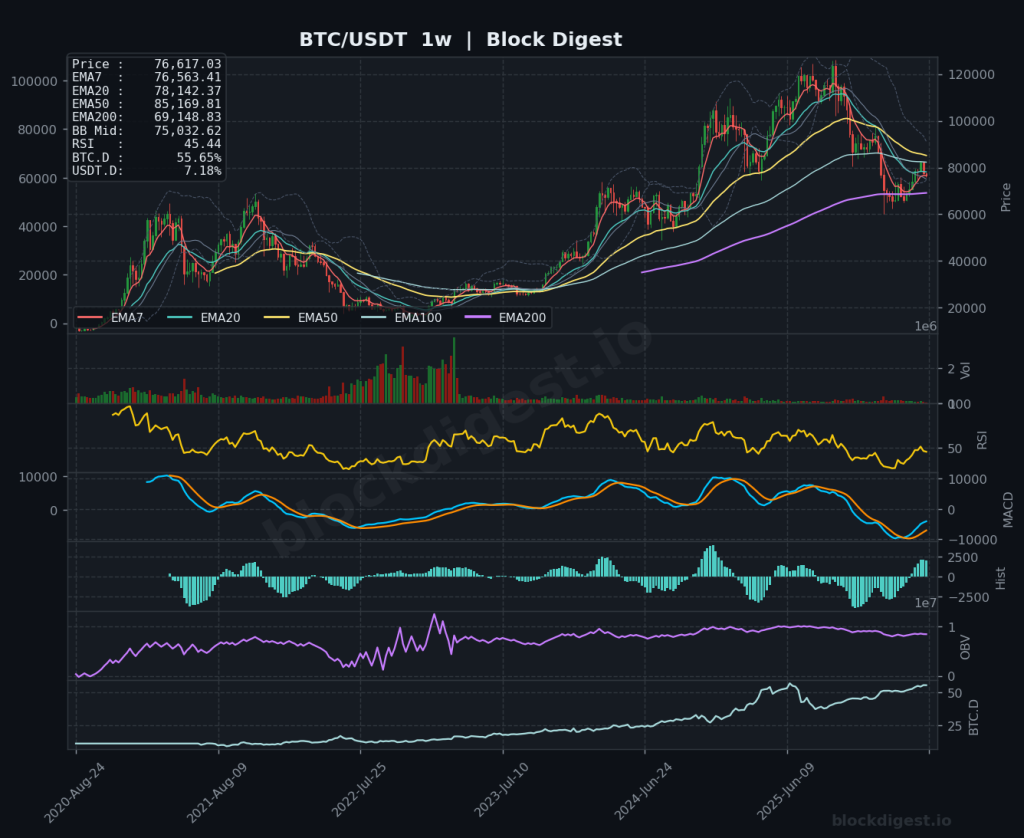
What’s bearish: Price is below all major moving averages. Short-term holders are underwater and selling. Macro headwinds — elevated Treasury yields, geopolitical uncertainty — continue to weigh on risk assets broadly. The CryptoQuant Bull Score remains low at around 20/100, cautioning against expecting an immediate reversal.
What’s bullish on-chain: MVRV is in a historically significant accumulation zone. Long-term holders are not distributing. Exchange supply is at multi-year lows. Funding rates are clean. The $50,000–$55,000 level represents the aggregate realized price — the true cost basis of all BTC holders — and price remains well above it.
The honest read is this: Bitcoin is at an inflection point, not a confirmed bottom or a confirmed collapse. The on-chain indicators are flashing yellow, not red. Whether that inflection resolves higher or lower will likely depend on macro liquidity conditions — specifically, whether global liquidity stabilizes or continues to contract.
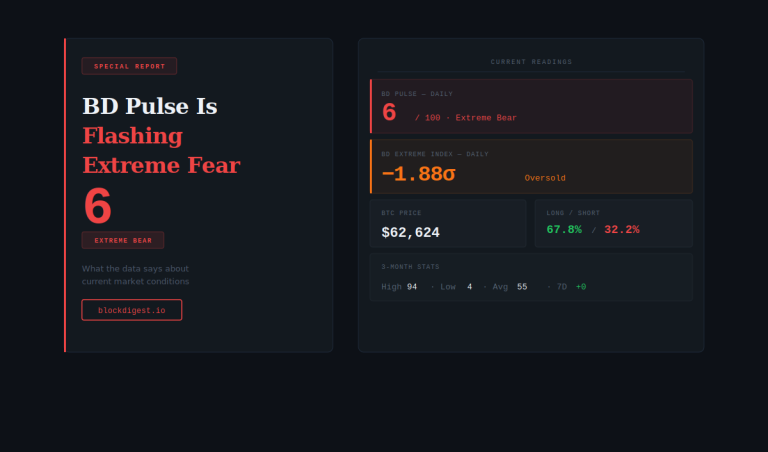
For a live read on current market conditions across multiple indicators, see BD Pulse — and the full indicator guides: MVRV, SOPR, Funding Rate.
Key Levels to Watch
- $75,000–$76,000 — Bollinger Band midpoint and current consolidation floor. A sustained breakdown below here puts $72,000–$73,000 in play.
- $78,500–$80,000 — The first meaningful resistance cluster where weekly EMA20 and daily EMA200 converge. Reclaiming this zone would shift short-term momentum.
- $50,000–$55,000 — The aggregate realized price. As long as Bitcoin trades above this, the majority of long-term holders remain in profit — a structural support that has never been broken in a bull market cycle.
The Bottom Line
Bitcoin at $77K feels uncomfortable, and the price chart looks bearish. But on-chain data tells a more nuanced story — one of short-term capitulation occurring against a backdrop of structural accumulation by long-term holders and rapidly declining exchange supply.
That doesn’t mean the bottom is in. On-chain data identifies zones, not precise entry points. But it does suggest that the risk profile at $77,000 looks materially different from what it did at $126,000.
For traders and investors watching from the sidelines, the on-chain picture is worth paying attention to — even when the price action makes it difficult to do so.
Disclaimer: This content is for informational purposes only and does not constitute financial advice. Cryptocurrency markets are highly volatile and unpredictable. All trading decisions should be made based on your own research and risk tolerance. Block Digest is not responsible for any financial losses incurred as a result of acting on this content.
Stay Ahead of the Market
Follow BlockDigest for crypto market intelligence, research and real-time updates.