Bitcoin Weekly Analysis: Bitcoin Recovery at $64K Amid Soft CPI Data
Weekly Market Overview
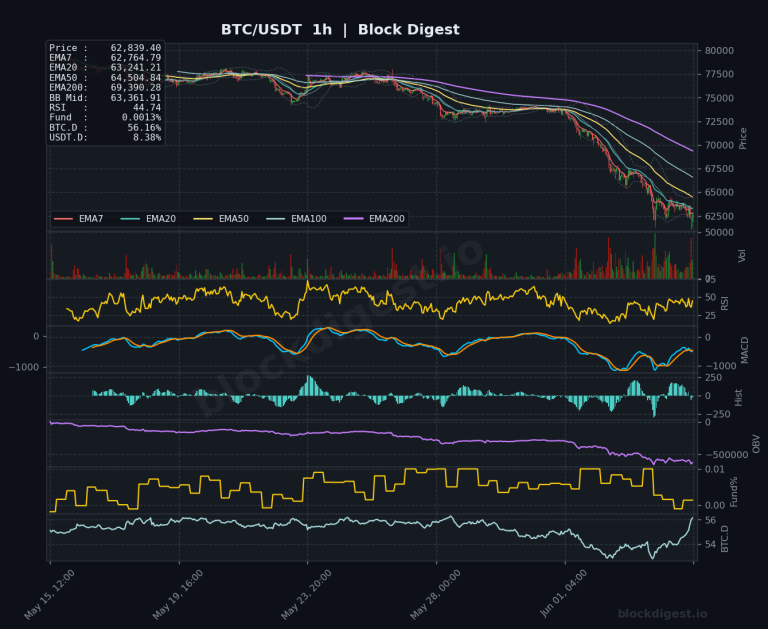
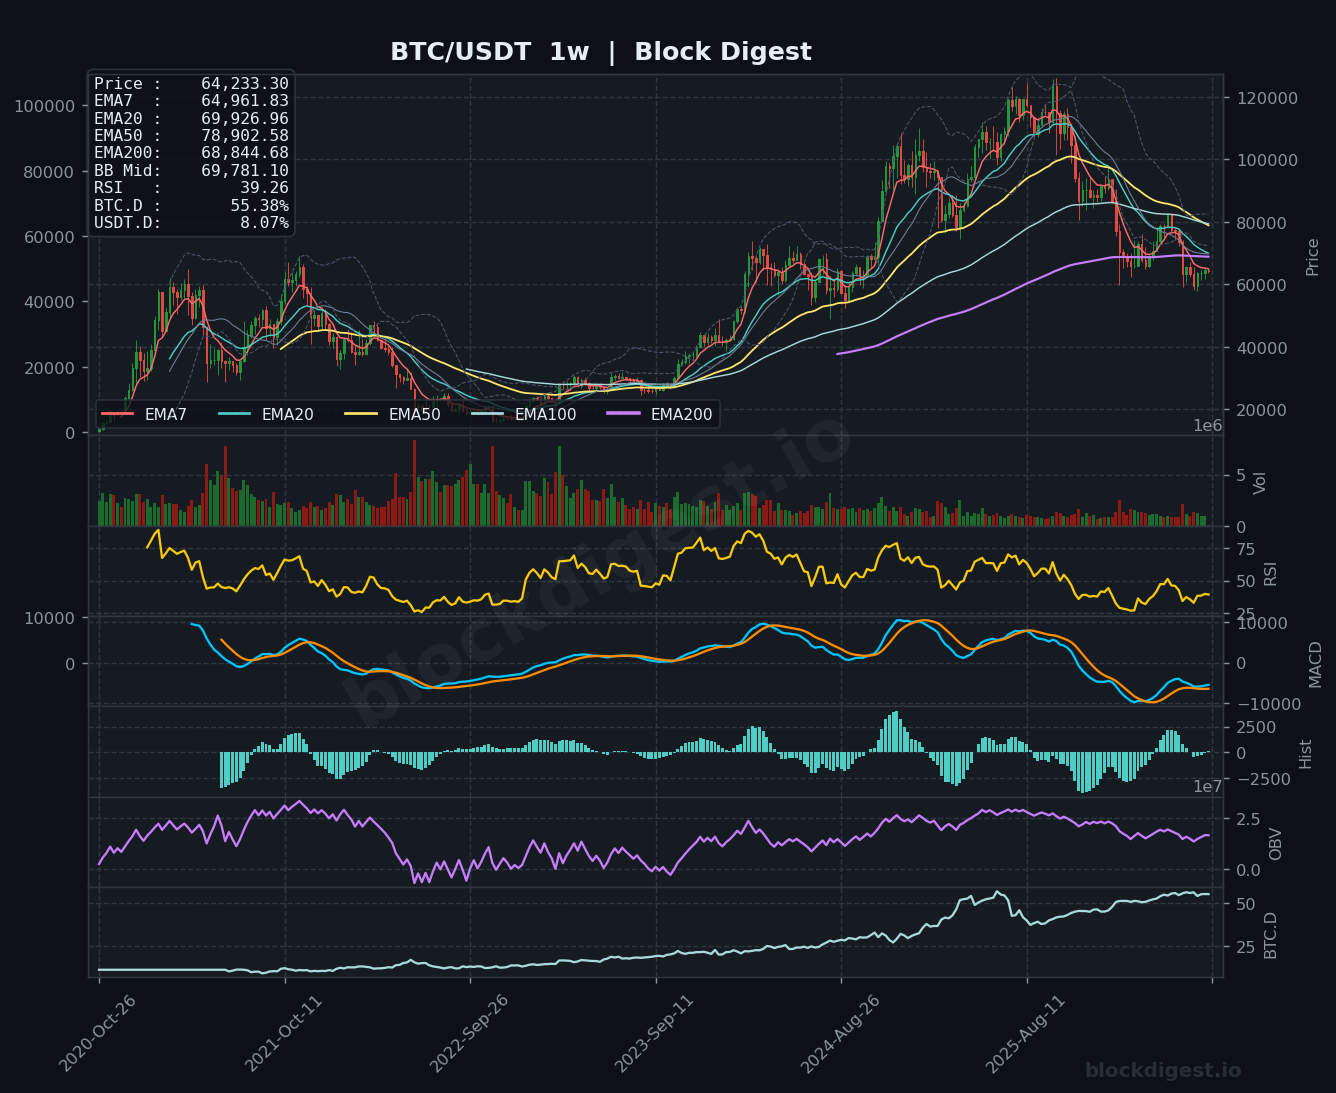
Bitcoin enters the week of July 20, 2026 in a fragile recovery posture, trading around $64,233 after clawing back from lows closer to $60,000 recorded in late June and early July. The weekly candle structure reflects a cautious bounce rather than a decisive reversal, with price attempting to stabilize above the $63,000–$64,000 zone following one of the more prolonged downtrends seen since the late-2025 peak near $108,000. The macro tailwind provided by softer U.S. CPI data mid-month and a short-squeeze-driven rebound has helped arrest the bleeding, but price action remains choppy and unconvincing on the higher timeframes. Overall, the market structure continues to favor the bears until bulls can produce a sustained weekly close materially above key resistance clusters.
Higher Timeframe Structure
On the weekly chart, the EMA stack tells a clearly bearish story: price is trading well below the EMA20 ($69,927), EMA50 ($78,903), and the weekly Bollinger Band midline ($69,781), all of which now represent overhead resistance rather than dynamic support. The EMA200 at $68,845 — historically a line in the sand during major bull cycles — has also rolled over as resistance, underscoring how far sentiment has deteriorated from the 2025 cycle highs. The weekly EMA7, currently at $64,962, sits just above spot price, meaning even the shortest-term weekly moving average is capping upside attempts. Until Bitcoin can reclaim and close above the $68,000–$70,000 cluster on a weekly basis, the macro trend remains structurally compromised.
Multi-Timeframe Confluence
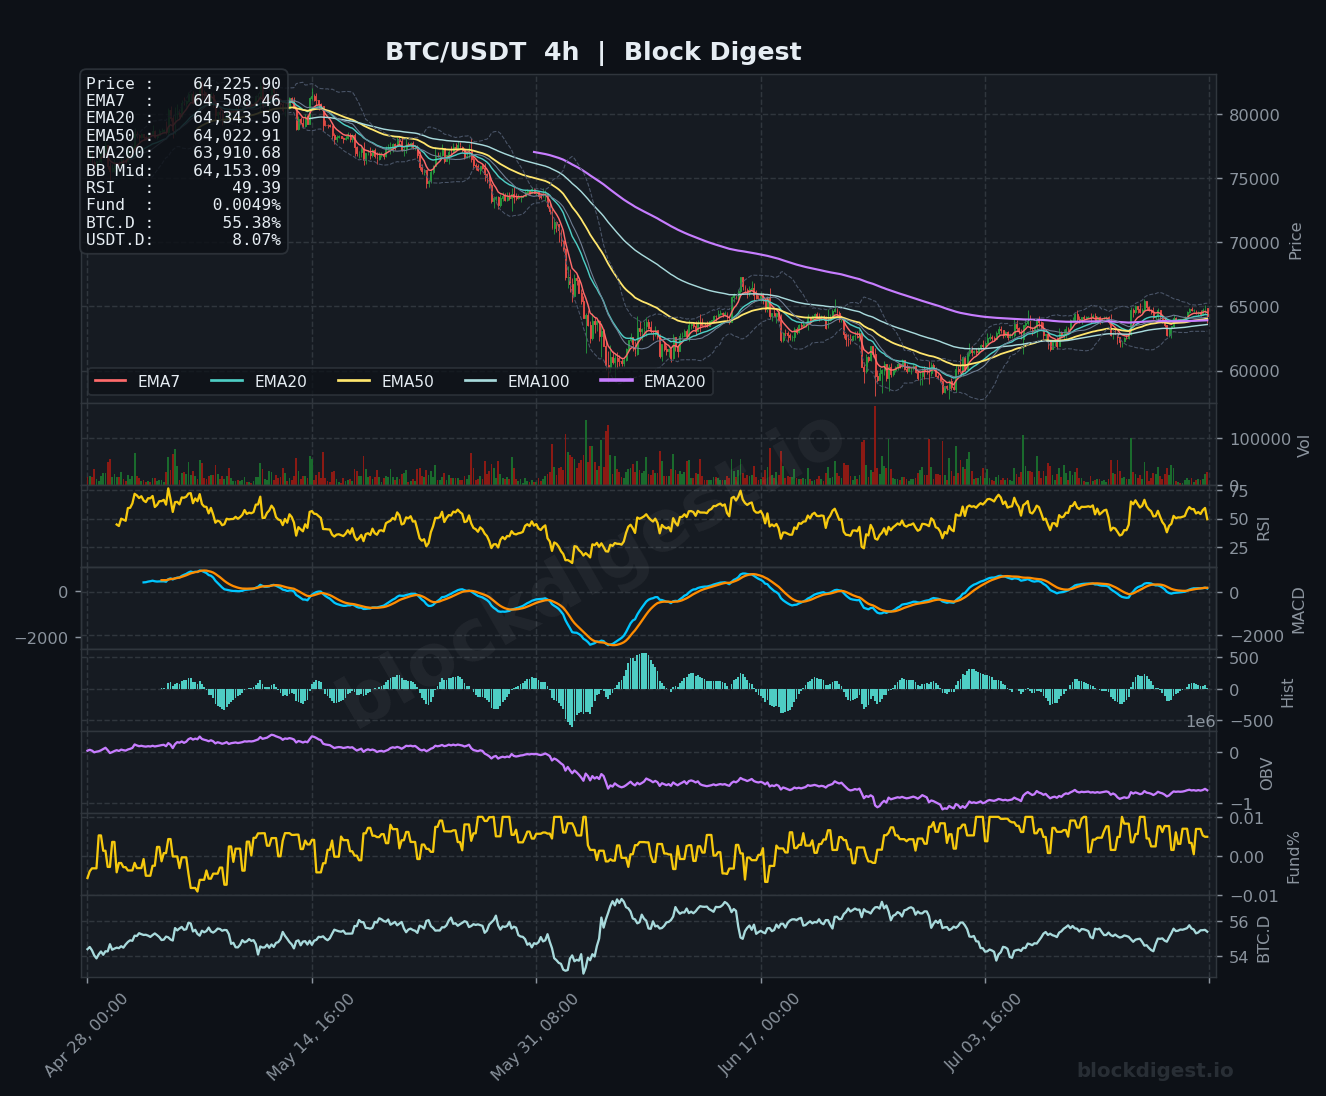
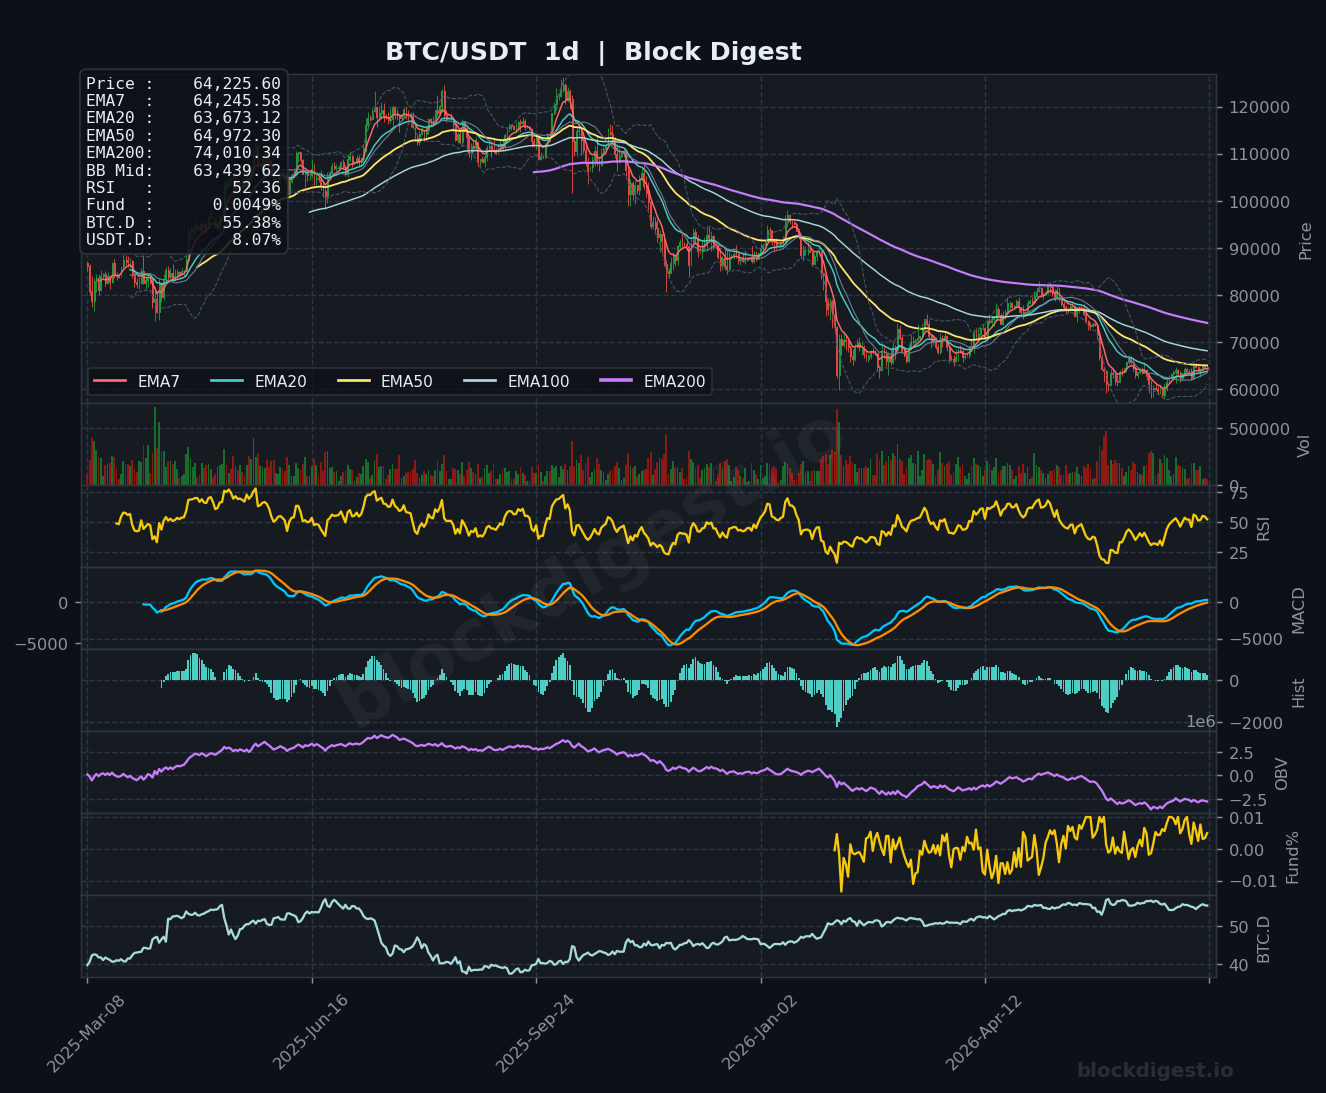
Across all three timeframes, the picture is one of a market attempting a recovery within a larger downtrend, with no clean multi-timeframe alignment in favor of bulls yet. On the daily chart, price has recently crossed back above the EMA7 ($64,246) and EMA20 ($63,673), which is a mildly constructive near-term development, but both the daily EMA50 ($64,972) and the weekly overhead structure continue to exert pressure. The 4-hour chart shows price trading in a tight consolidation band between roughly $63,500 and $65,000, with all EMAs (7, 20, 50, and 200) compressed into a narrow range — a setup that often precedes a directional expansion, though the direction remains undecided. The most critical confluent zone sits between $64,900 and $65,500, where the 4H EMA7, daily EMA50, and the descending weekly EMA7 converge into a formidable resistance cluster.
Key Weekly Levels
- Weekly Resistance: $65,000–$65,500 (convergence of daily EMA50, 4H EMA cluster, and recent swing highs); $68,844 (weekly EMA200, historically pivotal on macro timeframe); $69,781–$69,927 (weekly BB midline and EMA20, the primary recovery target for a genuine trend reversal)
- Weekly Support: $63,439 (daily BB midline, near-term floor on closes); $61,500–$62,000 (recent multi-week lows, buyers defended this zone aggressively in early July); $59,500–$60,000 (psychological round number and last major demand zone before structurally deeper support)
Momentum & Volume Analysis
Weekly RSI at 39.26 is one of the more telling data points this week — the indicator is hovering just above oversold territory without yet producing a confirmed bullish hook, consistent with markets that are stabilizing but not yet accumulating with conviction. This aligns with Block Digest’s proprietary BD Pulse Score of just 27/100, a firmly bearish reading that suggests underlying momentum has not yet turned meaningfully positive despite the surface-level price recovery. The weekly MACD remains in deeply negative territory with the histogram flattening but not crossing, while the OBV trend on both the weekly and 4-hour charts continues to slope lower — indicating that volume on down moves has, on balance, been heavier than on recoveries. The current funding rate of +0.0057% is positive but extremely modest, suggesting that leveraged longs are not aggressively pressing their bets, which reduces immediate liquidation squeeze risk but also tempers expectations for a sharp, funding-driven move higher.
BTC Dominance & Altcoin Implications
Bitcoin dominance sits at 55.38%, a level that has remained sticky in recent weeks and continues to reflect a risk-off rotation within crypto, with capital gravitating toward BTC over altcoins during a period of broader market uncertainty. USDT dominance at 8.07% is elevated and confirms that a meaningful portion of market participants remains in stablecoins on the sidelines — a potential source of dry powder if sentiment improves, but also a signal that conviction in deploying capital is low. Until BTC dominance shows a decisive rollover alongside a recovery in BTC price, altcoin outperformance is unlikely to be sustainable, and any altcoin rallies should be treated with caution.
Risk Scenarios
- Bull case: A clean daily close above $65,500 — clearing the convergence of the daily EMA50 and the descending 4H EMA cluster — would be the first meaningful signal that buyers are in control. Sustained follow-through above $68,000 (weekly EMA200) would shift the macro structure toward a recovery thesis, opening a path toward the $72,000–$75,000 range over the following 4–6 weeks, particularly if macro conditions (softer Fed rhetoric, continued ETF inflows) remain supportive.
- Bear case: Failure to hold $63,000 on a daily close would be an early warning sign, and a weekly close below $61,500 would invalidate the current recovery structure entirely. In that scenario, the $59,500–$60,000 zone becomes the next critical test, with deeper downside toward $55,000–$57,000 possible if macro sentiment deteriorates or ETF outflows resume at scale.
Weekly Outlook
The directional bias for this week leans cautiously neutral with a bearish tilt, as the weight of evidence from higher timeframes continues to favor sellers into rallies. The $64,900–$65,500 resistance zone is the immediate battleground — how Bitcoin responds to this cluster over the next 48–72 hours will likely set the tone for the rest of July. Key catalysts to monitor include any Fed commentary ahead of the July FOMC meeting, ongoing ETF flow data which has been the primary swing factor in recent weeks, and whether the SEC’s newly announced crypto rulemaking agenda generates meaningful market reaction. The BD Pulse Score at 27/100 and a declining OBV trend serve as important reminders that this bounce has not yet earned the label of a trend reversal. Traders should respect the current risk/reward asymmetry: with resistance stacked densely above and structural damage visible across weekly and daily charts, position sizing and stop discipline remain paramount heading into a week that could either confirm recovery or deliver a painful failed breakout.
Disclaimer: This analysis is for informational purposes only and does not constitute financial advice. Cryptocurrency markets are highly volatile and unpredictable. All trading decisions should be made based on your own research and risk tolerance. Block Digest is not responsible for any financial losses incurred as a result of acting on this content.