Weekly Market Overview
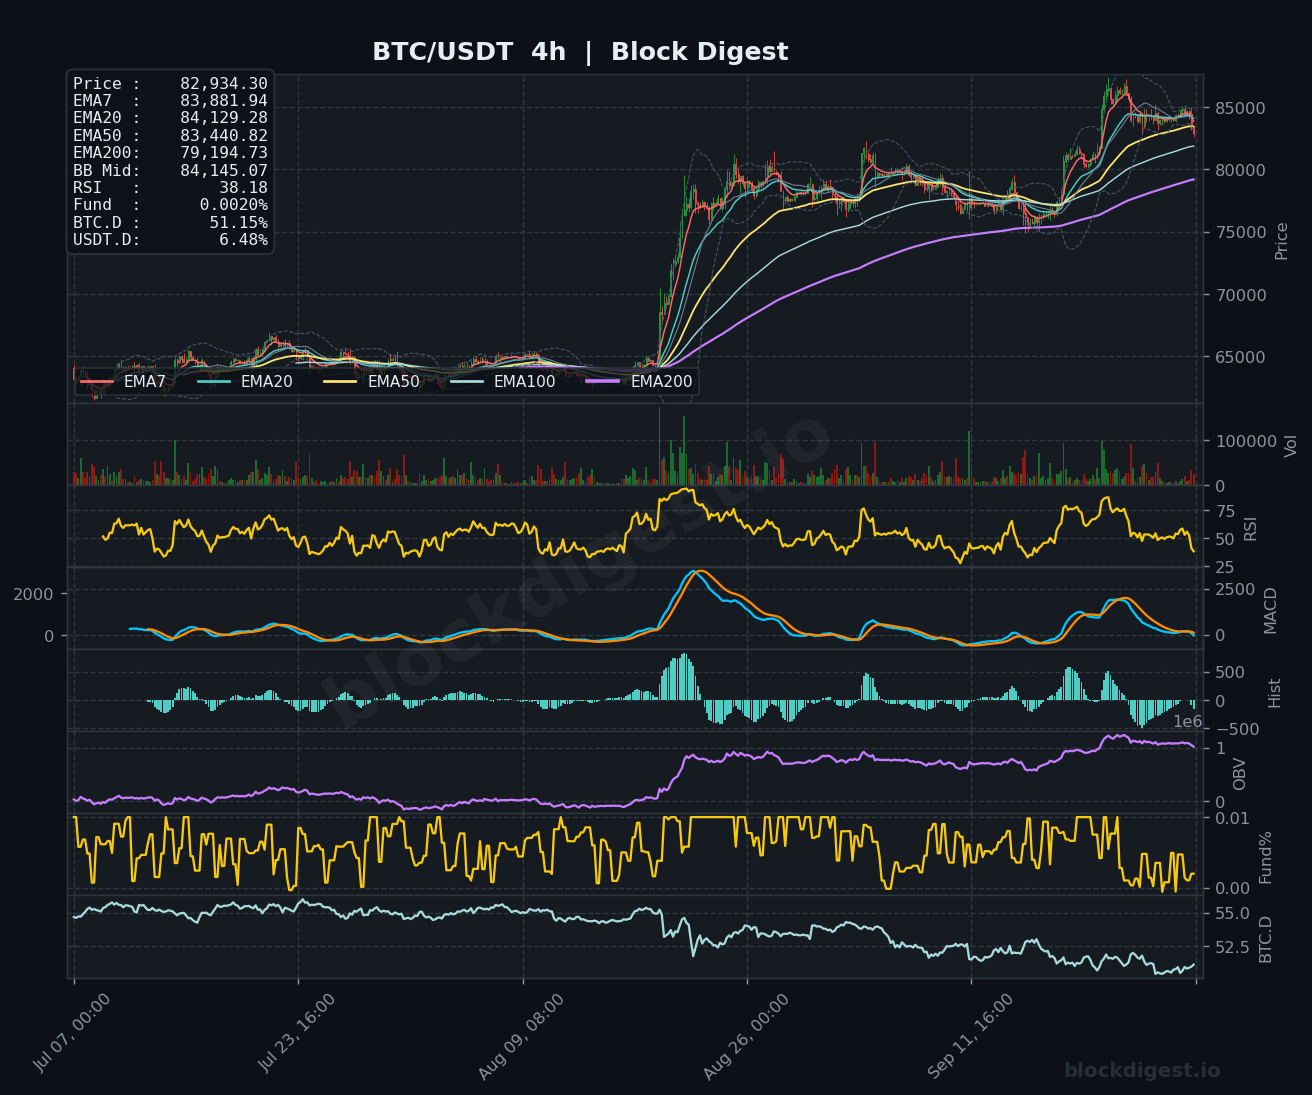
BTC/USDT is currently trading at 82934.3, marking a period of robust bullish expansion that has firmly established the asset above the previous multi-month consolidation range of 60,000–70,000. Price action has successfully accepted the low-to-mid 80,000 zone as a new operational base, distancing itself from earlier resistance. Market sentiment remains distinctly optimistic, with the BD Pulse score registering at 68.8/100, bolstered by strong momentum and directional volume metrics. The BD Extreme Index sits at +1.25σ, confirming the market is in a phase of aggressive growth without hitting the overheated extremes that typically precede a major trend reversal.
Higher Timeframe Structure
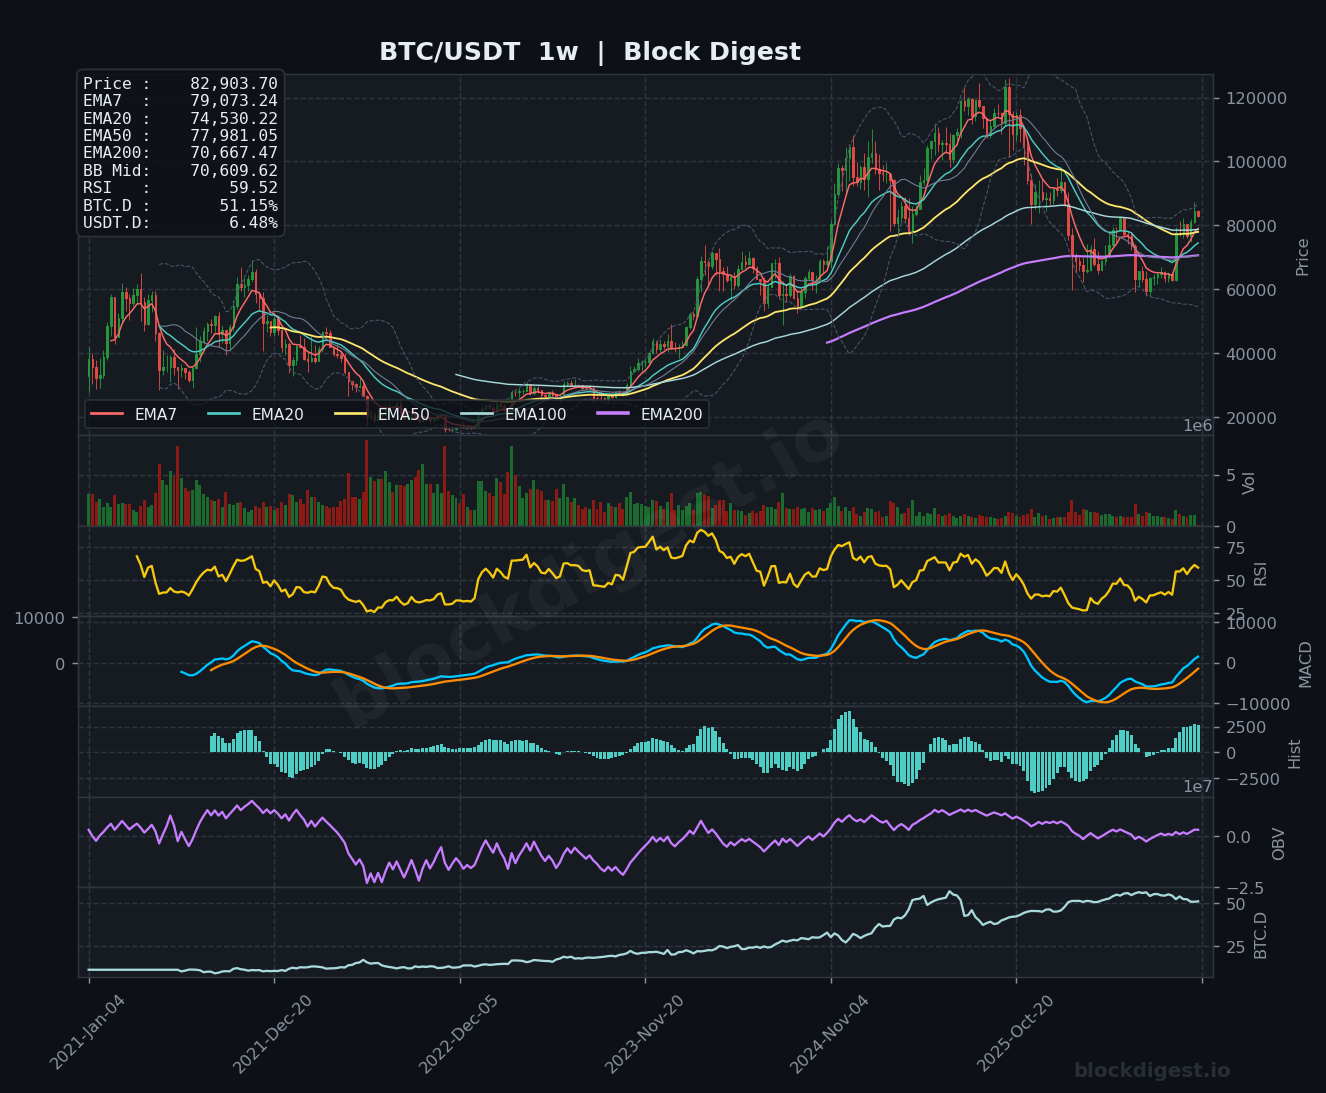
The weekly chart reveals a clear trend re-acceleration, with the EMA 7 (79073.2414) crossing above both the EMA 50 (77981.0454) and the EMA 100 (78757.1575). Price is currently positioned well above all major dynamic moving averages, including the EMA 200 at 70667.4740, and is trading within the upper Bollinger Band expansion zone. This structural alignment confirms a macro volatility expansion, with BTC testing the upper boundaries of its bull market channel while keeping historical high liquidity zones near 88,000–90,000 in its sights.
Multi-Timeframe Confluence
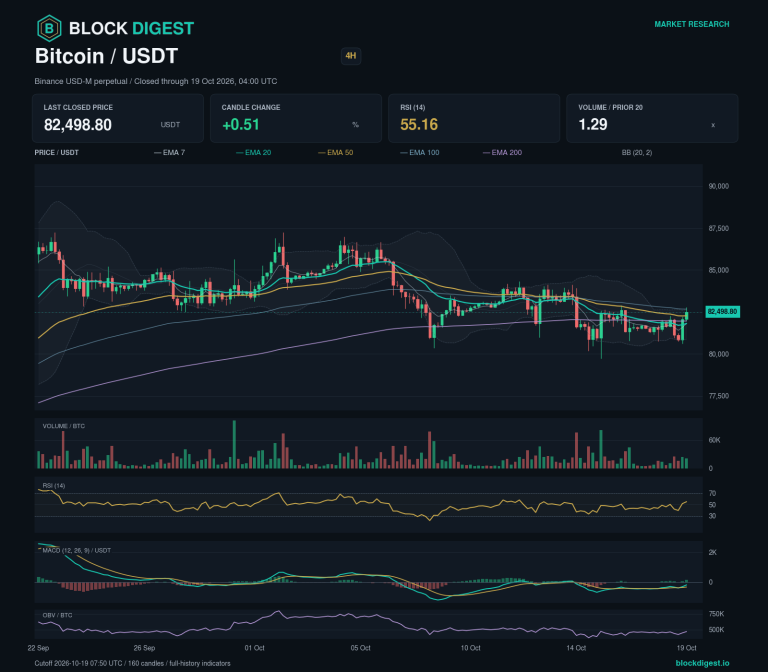
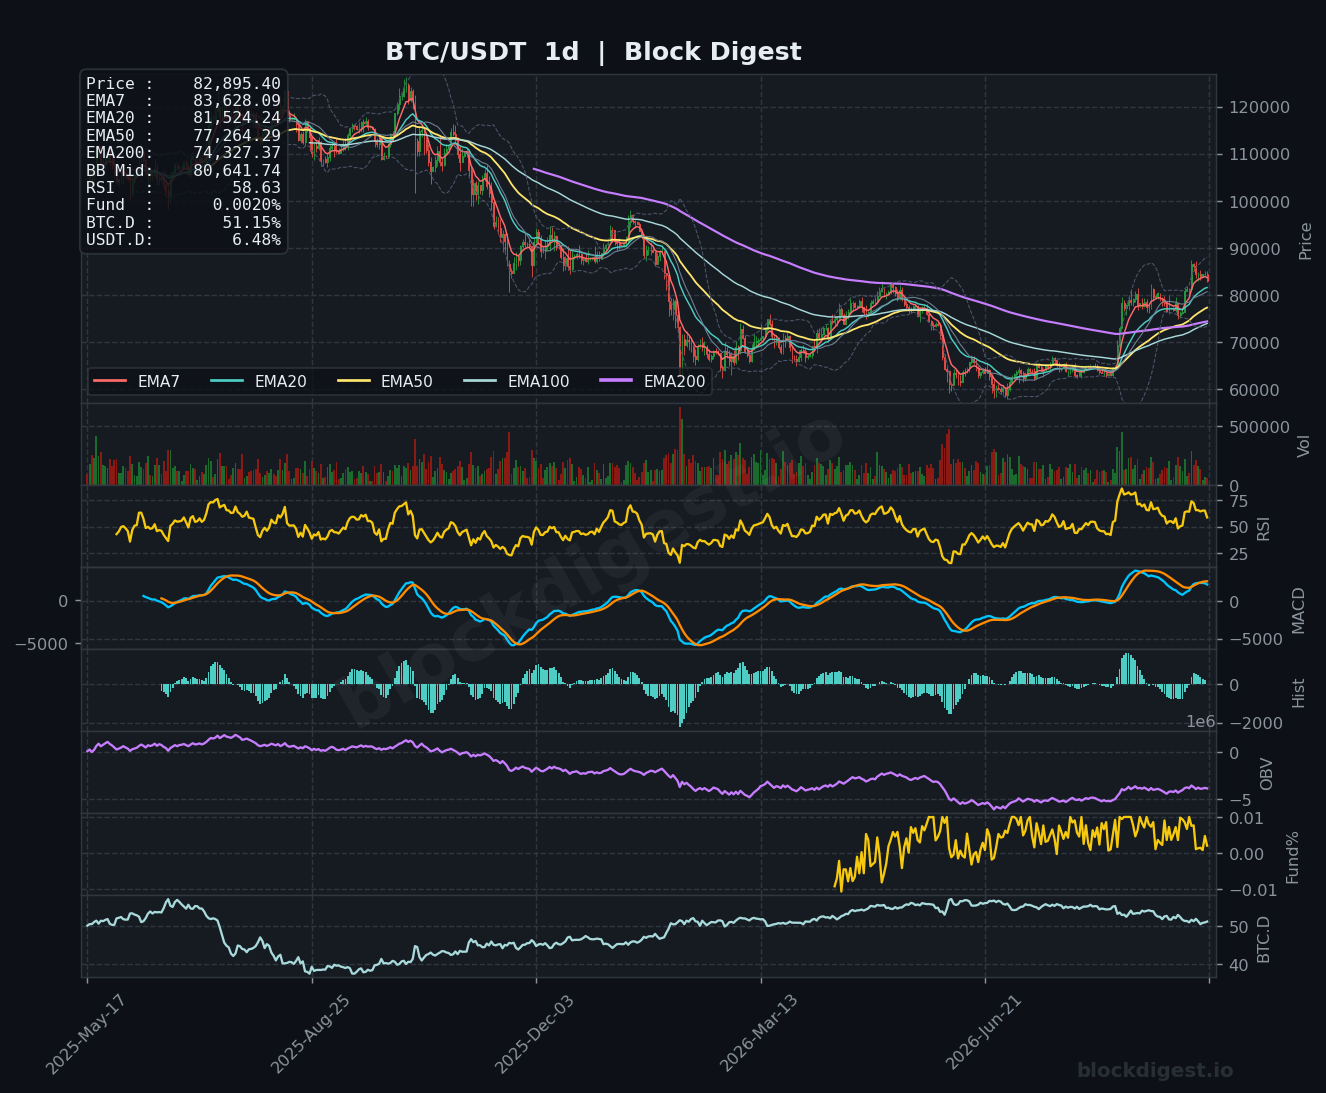
While the weekly timeframe remains fully bullish, the market is navigating a healthy, short-term corrective phase on the 4-hour chart, where price is currently trading below the EMA 7, EMA 20, and EMA 50. This intraweek pullback is a necessary cooling-off period rather than a structural breakdown; daily price action remains supported above the Daily EMA 20 and EMA 50. Traders are watching the confluence zone between 81524.2432 and 81869.8029—where the Daily EMA 20 meets the 4-hour EMA 100—to see if support stabilizes before the broader uptrend resumes.
Key Weekly Levels
- Weekly Resistance: 84145.0650 (Immediate dynamic resistance at the 4-hour Bollinger Middle Band and EMA 20), 86673.9140 (Primary macro expansion boundary at the Weekly Bollinger Upper Band), and 87985.3901 (Daily Bollinger Upper Band overhead channel resistance).
- Weekly Support: 81869.8029 (Primary dynamic pullback support at the 4-hour EMA 100), 79073.2414 (Key structural trendline floor at the Weekly EMA 7), and 77264.2898 (Major baseline support at the Daily EMA 50).
Momentum & Volume Analysis
Momentum indicators reflect a market in transition, with the Weekly RSI at 59.5182 leaving ample headroom for further expansion, while the 4-hour RSI has cooled into lower momentum territory at 38.1809. The Weekly MACD histogram remains strongly positive at +2685.5528, signaling sustained bullish strength despite the flattening momentum on the daily timeframe. On-chain volume metrics show the macro accumulation trend remains intact. The funding rate of 0.002% combined with a 1.28 long/short ratio suggests that current price levels are supported by spot-driven interest rather than excessive, over-leveraged speculation.
Key Indicators Snapshot
| Indicator | Value | Context |
|---|---|---|
| BTC/USDT Spot Price | $82,934.30 | Current market price |
| Weekly 200 EMA | $70,667.47 | Major macro support |
| Weekly 100 EMA | $78,757.16 | Key trendline support |
| Weekly 50 EMA | $77,981.05 | Mid-term trend floor |
| Weekly 20 EMA | $74,530.22 | Short-term trend baseline |
| Weekly 7 EMA | $79,073.24 | Immediate trendline support |
| Weekly RSI(14) | 59.52 | Bullish expansion zone |
| Daily RSI(14) | 58.63 | Moderately bullish trend |
| Weekly MACD Histogram | 2,685.56 | Expanding bullish momentum |
| Funding Rate | 0.002% | Neutral leverage environment |
| Long/Short Ratio | 1.28 | Modest retail bias |
BTC Dominance & Altcoin Implications
BTC dominance has retreated to 51.154% from recent highs, while USDT dominance remains suppressed at 6.476%. This configuration suggests that capital is not retreating to the safety of stablecoins; instead, liquidity is rotating out of BTC and into major altcoins as the market leader consolidates its gains. This rotation is a classic sign of a healthy, maturing bull cycle where profit-taking from the primary asset fuels broader market participation.
Risk Scenarios
- Bull case: The market must defend the 81869.8029 support level and secure a 4-hour candle close above the 84129.2807–84145.0650 resistance zone. A clean breakout above the 4-hour Upper Bollinger Band at 85047.7074 would open the path toward the 86673.9140 and 87985.3901 resistance levels, with an extension target of 90,000.00.
- Bear case: A breakdown below the Daily EMA 20 at 81524.2432 and the 4-hour EMA 100 at 81869.8029 would signal a deeper correction. A failure to hold the Weekly EMA 7 confluence at 79073.2414 would likely trigger a test of the Daily EMA 50 at 77264.2898 and potentially the Weekly EMA 20 at 74530.2179.
Weekly Outlook
The directional bias for the week ahead remains moderately bullish, as the weekly and daily trends maintain positive momentum despite the current 4-hour mean reversion. Watch for the weekly candle close to hold above the 80,000 threshold, as this level remains the psychological and technical pivot for the current structure. Traders should monitor for spot volume expansion during any retests of the 84,000–85,000 range to confirm whether the market has the strength to push toward new highs. The current setup offers a favorable risk-to-reward profile, provided the primary support floors remain intact during this consolidation phase.
Disclaimer: This analysis is for informational purposes only and does not constitute financial advice. Cryptocurrency markets are highly volatile and unpredictable. All trading decisions should be made based on your own research and risk tolerance. Block Digest is not responsible for any financial losses incurred as a result of acting on this content.
Stay Ahead of the Market
Follow BlockDigest for crypto market intelligence, research and real-time updates.