Bitcoin Weekly Analysis: Bitcoin Consolidates at $65K After 18% Decline
Weekly Market Overview
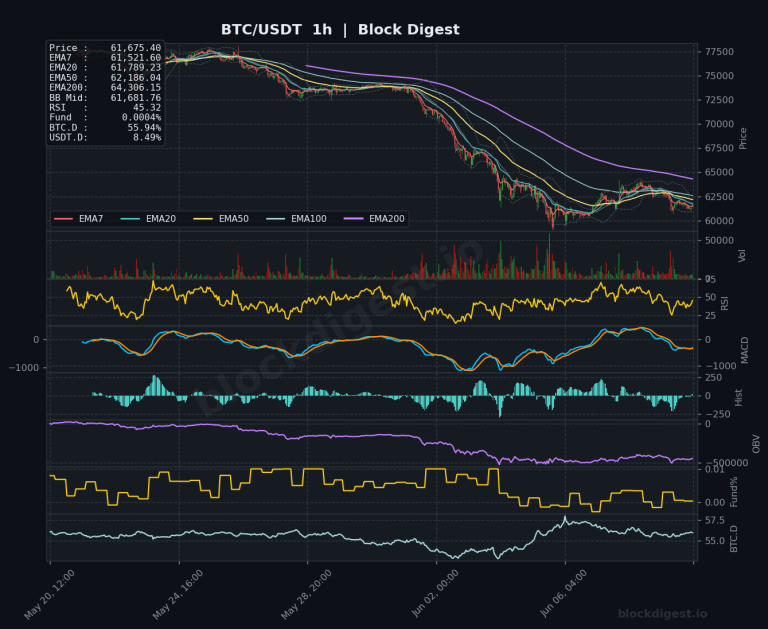
Bitcoin enters the week of July 27, 2026 trading at approximately $65,237, caught in a precarious no-man’s-land after a turbulent month that saw prices shed roughly 18% from their July open before staging a partial recovery. The current weekly candle is attempting to consolidate within the $64,900–$66,200 range, representing a roughly 13% bounce from early-month lows, but the structure remains fragile. Price action over the past several weeks has been characterized by lower highs and failing recovery attempts, with each rally capped before reclaiming meaningful resistance. The broader trend, when viewed on the weekly chart, tells a sobering story: BTC is deep in a corrective phase that began when it failed to sustain above the $100K psychological level earlier this cycle.
Higher Timeframe Structure
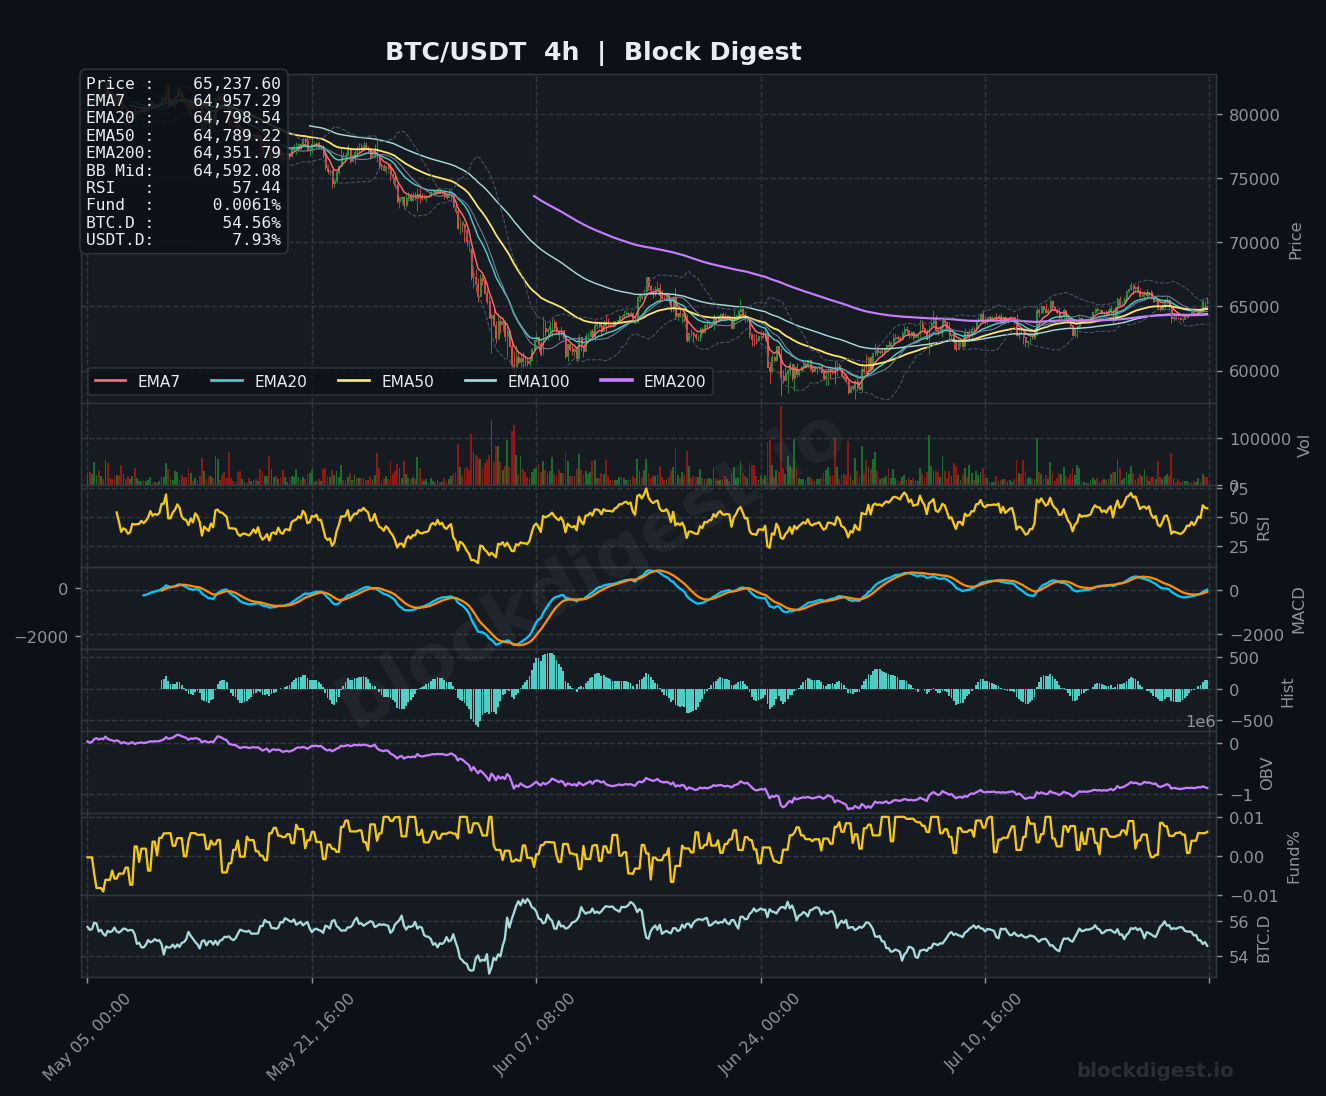
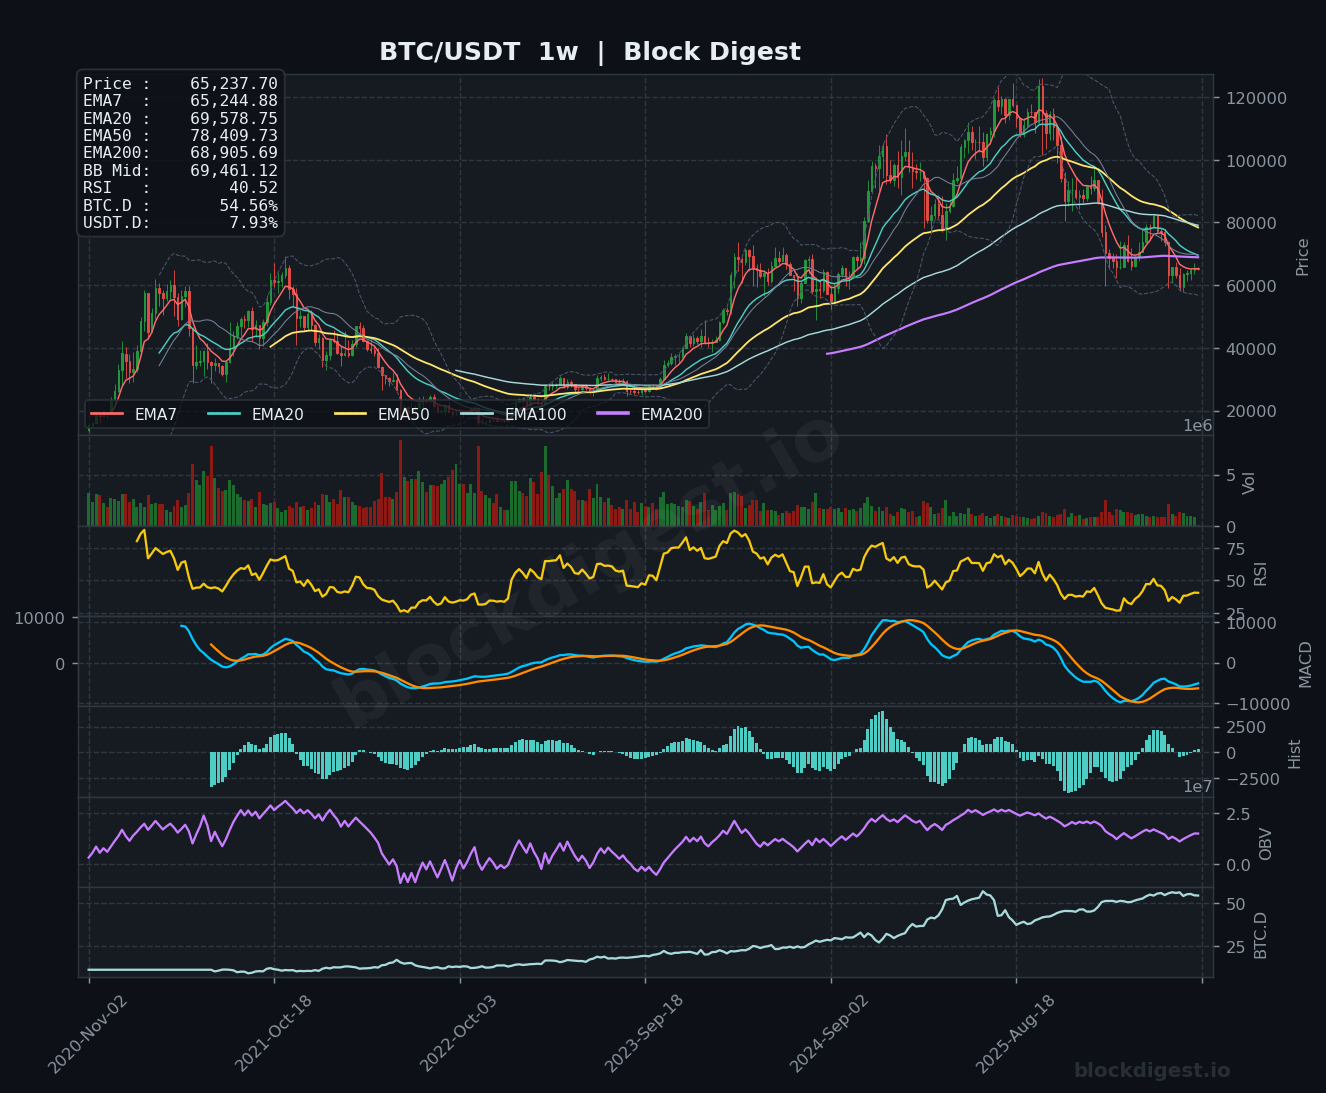
On the weekly chart, the EMA stack tells an unambiguous bearish story — price is trading well below the EMA20 ($69,578), EMA50 ($78,409), and EMA100 ($68,905), with all three sloping downward in a bearish cascade. The weekly EMA200 at $68,905 now acts as a formidable overhead barrier, compressing price against the lower Bollinger Band while the BB midline at $69,461 aligns almost perfectly with the EMA200 cluster — creating a dense resistance ceiling in the $69,000–$70,000 zone. Critically, the weekly EMA7 at $65,244 is essentially flat and coiling with price near current levels, suggesting indecision at a historically pivotal range. The weekly Bollinger Band structure shows price hugging the lower band, a condition historically associated with either continuation lower or a volatility-driven mean-reversion squeeze — the direction of resolution will be key.
Multi-Timeframe Confluence
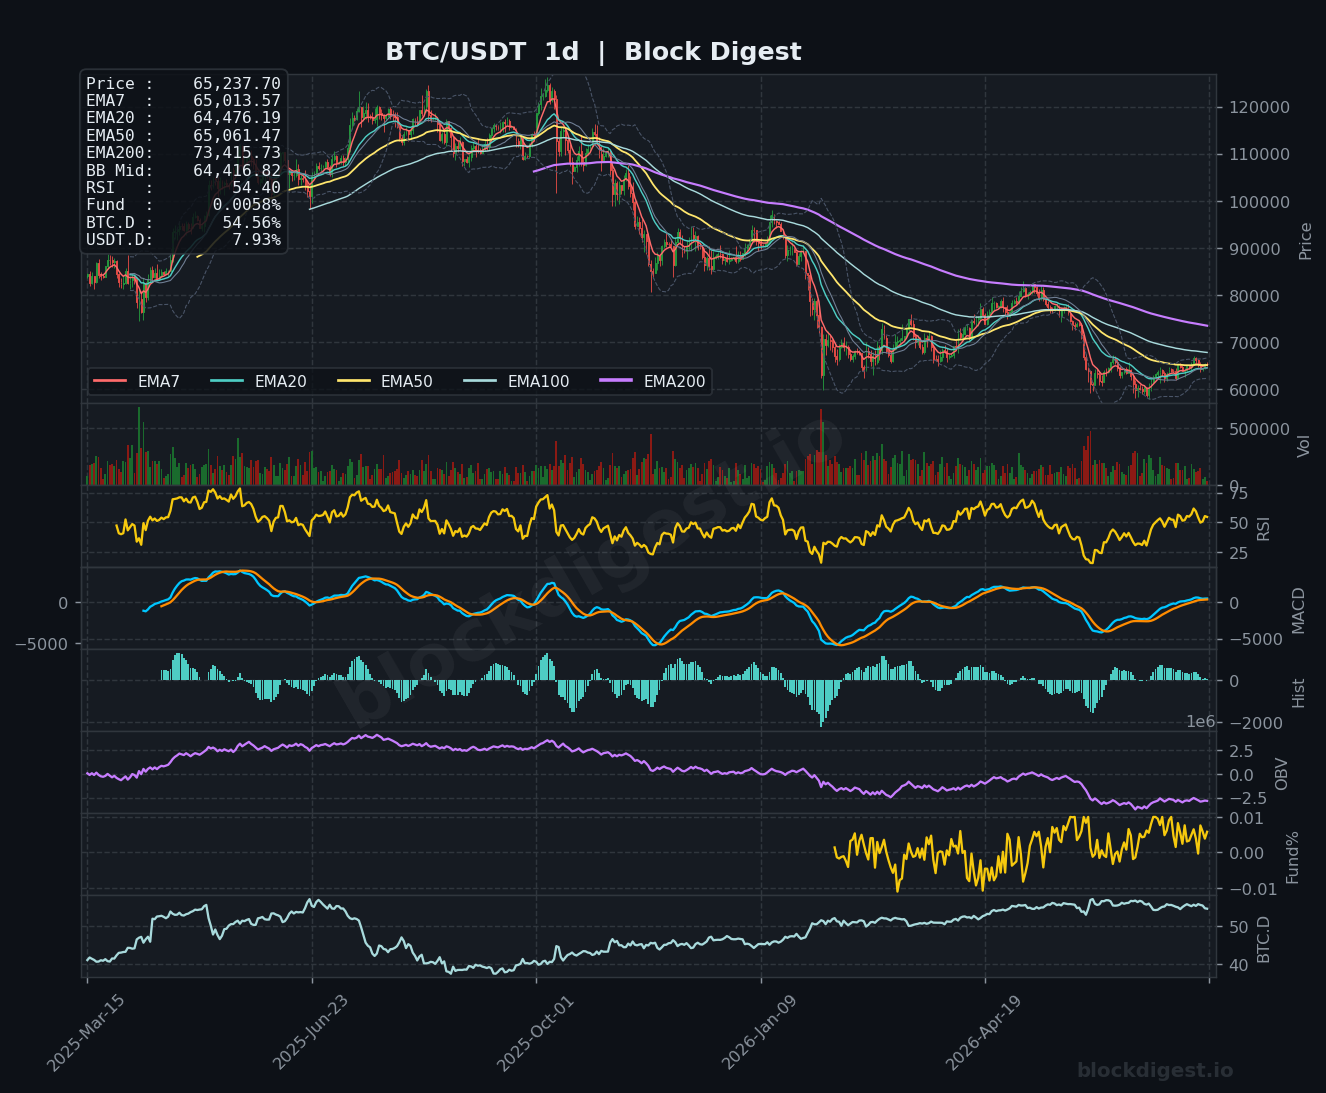
Zooming into the daily chart, the EMA structure is notably more constructive than the weekly: the EMA7 ($65,013), EMA20 ($64,476), and EMA50 ($65,061) have converged tightly around current price, producing a rare flat compression that can precede a decisive directional move. The 4-hour chart reinforces this picture, with all short-term EMAs (7, 20, 50, and 200) stacked extremely tightly between $64,351 and $64,957 — a compression zone that has been grinding sideways for several weeks. The confluence of this multi-timeframe EMA coil directly under the weekly $69K–$70K resistance wall creates a high-stakes setup: a sustained push above $66,500 on the daily would be the first meaningful higher-high in weeks, while failure at current levels risks a flush toward cycle lows. All timeframes agree that $64,000–$64,500 is a critical structural floor.
Key Weekly Levels
- Weekly Resistance: $66,500 — immediate intraweek supply zone where recent rallies have stalled; $69,000–$69,500 — weekly EMA200 and BB midline cluster, the most critical overhead barrier; $73,000–$73,500 — daily EMA200 ($73,415), the macro bearish line-in-the-sand that needs reclaiming for any structural trend reversal.
- Weekly Support: $64,000–$64,400 — confluent 4h EMA200 and multi-week base; $61,500–$62,000 — previous cycle support shelf visible on the daily chart, last significant demand zone before open air; $58,000–$59,000 — macro weekly support and the next meaningful Bollinger Band lower band extension zone on the weekly.
Momentum & Volume Analysis
The weekly RSI at 40.52 sits in bearish territory, below the neutral 50 line, reflecting sustained distribution pressure since the cycle peak — a reading consistent with prior bear phase consolidations rather than impulsive recoveries. Our proprietary BD Pulse Score reinforces this caution, sitting at just 30/100, while the OBV trend registers a negative reading (-1), confirming that volume has been flowing out rather than accumulating on recent price attempts higher. On the daily, RSI at 54.40 is marginally more encouraging, and the 4-hour RSI at 57.44 shows some near-term momentum building — but this intraweek divergence between the 4h and weekly RSI is a classic bear market bounce signal rather than a structural reversal. The funding rate at +0.0048% remains modestly positive, indicating longs retain a slight positioning edge, but this also means the market is not in capitulation territory — any sharp downturn could trigger cascading long liquidations given the Long/Short ratio sits at 1.54 (60.6% long).
BTC Dominance & Altcoin Implications
BTC dominance holds at 54.58%, which, while slightly off recent highs, remains elevated and reflects continued capital concentration in Bitcoin as investors avoid altcoin risk in a challenging macro environment. The USDT dominance at 7.93% signals that a meaningful portion of market participants remain on the sidelines in stablecoins, neither rotating into BTC nor altcoins — a posture consistent with the Fear & Greed Index reading of 26. Until BTC.D begins to roll over with conviction alongside a confirmed BTC breakout above $69K, any altcoin rotation will likely remain superficial and vulnerable to reversal.
Risk Scenarios
- Bull case: A decisive weekly close above $66,500 this week, followed by a test of the $69,000–$69,500 resistance cluster, would constitute the most bullish near-term outcome. Should positive momentum from the SEC’s crypto legislation progress materialize and risk appetite return, a breakout above $70,000 with volume confirmation could trigger a run toward $73,000–$75,000, where the daily EMA200 and next major supply zone reside. This scenario likely requires a broader macro catalyst — easing dollar strength or a dovish signal from the Fed.
- Bear case: Failure to hold the $64,000–$64,400 support cluster on a weekly closing basis would be a high-conviction breakdown signal, opening the door to a retest of the $61,500–$62,000 zone. A deterioration in macro conditions — persistent rate pressure, dollar strength, or geopolitical shock — combined with the already-bearish weekly MACD and negative OBV, could accelerate selling toward the $58,000–$59,000 region, which represents the last major demand zone before a more structurally severe correction would need to be considered.
Weekly Outlook
The bias for the week ahead is cautiously neutral with a slight bearish lean, as the weight of evidence — weekly EMA structure, BD Pulse Score of 30, negative OBV trend, and a Fear & Greed reading of 26 — continues to favor sellers on rallies rather than buyers on dips. The critical level to watch is the $66,500 ceiling: price must clear and hold this level with volume to shift the near-term thesis, whereas any daily close below $64,000 should be treated as a warning sign of renewed distribution. Macro catalysts, particularly any Fed commentary this week and developments around the proposed crypto legislation flagged in the SEC’s July agenda, could serve as binary drivers that override the technical setup. The tight EMA compression across all timeframes suggests volatility expansion is imminent — the market is coiling for a move — and traders should be prepared for a sharp resolution in either direction rather than continued grinding consolidation. Until the weekly chart shows a clear reclamation of the $69,000–$70,000 zone, the path of least resistance structurally remains sideways-to-lower.
Disclaimer: This analysis is for informational purposes only and does not constitute financial advice. Cryptocurrency markets are highly volatile and unpredictable. All trading decisions should be made based on your own research and risk tolerance. Block Digest is not responsible for any financial losses incurred as a result of acting on this content.