Altcoin Daily Analysis — May 03, 2026
Altcoin Daily Roundup – May 03, 2026
Market Context
The altcoin market is exhibiting mixed signals with Bitcoin dominance holding at 55.17% and USDT.D at 7.06%, suggesting moderate risk appetite across the digital asset space. While BTC dominance remains elevated, the stable USDT.D reading indicates that capital isn’t aggressively rotating between Bitcoin and altcoins, creating a consolidative environment where individual coin fundamentals and technical setups are driving price action more than broad market flows.
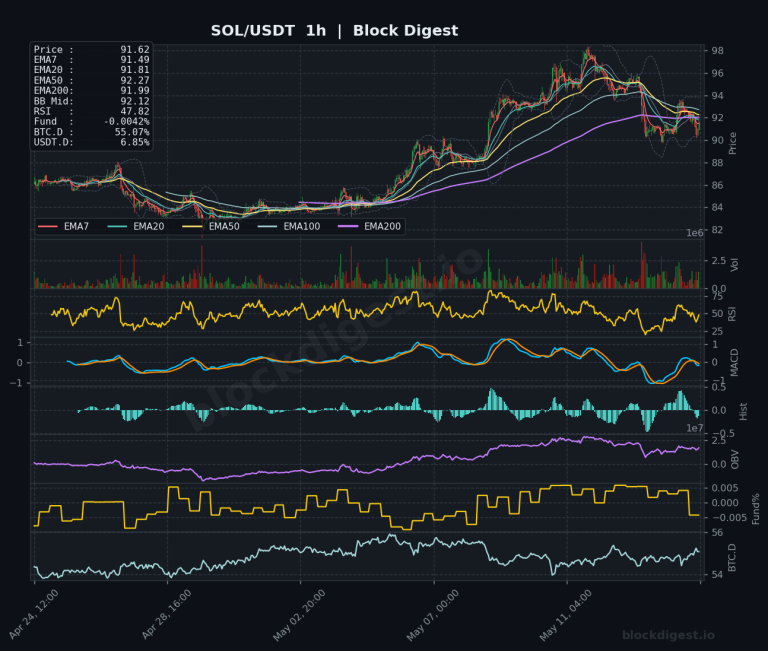
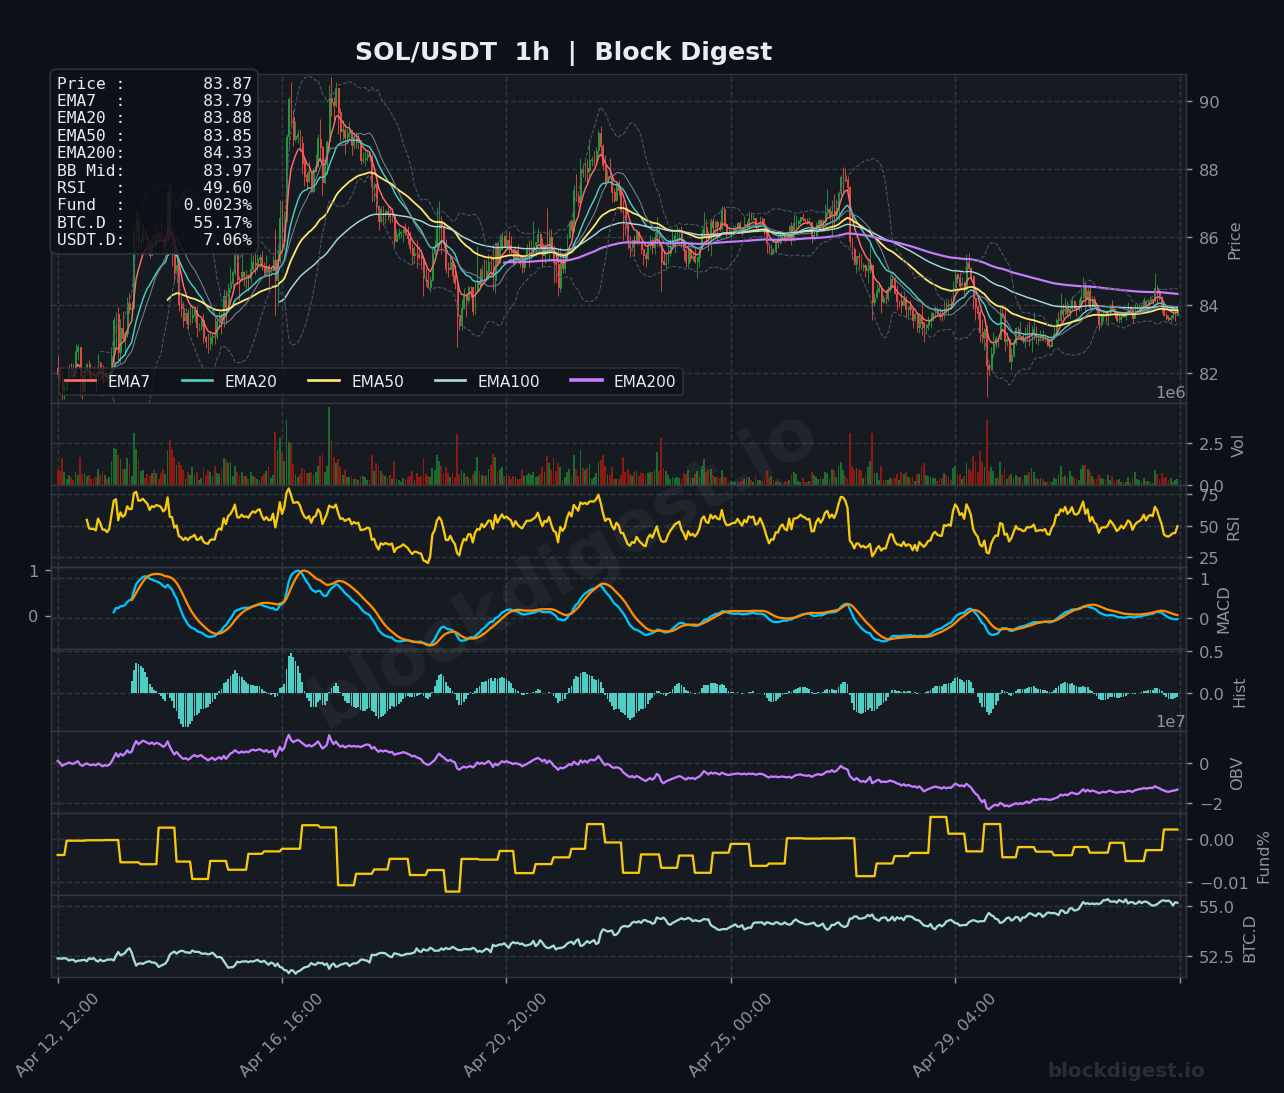
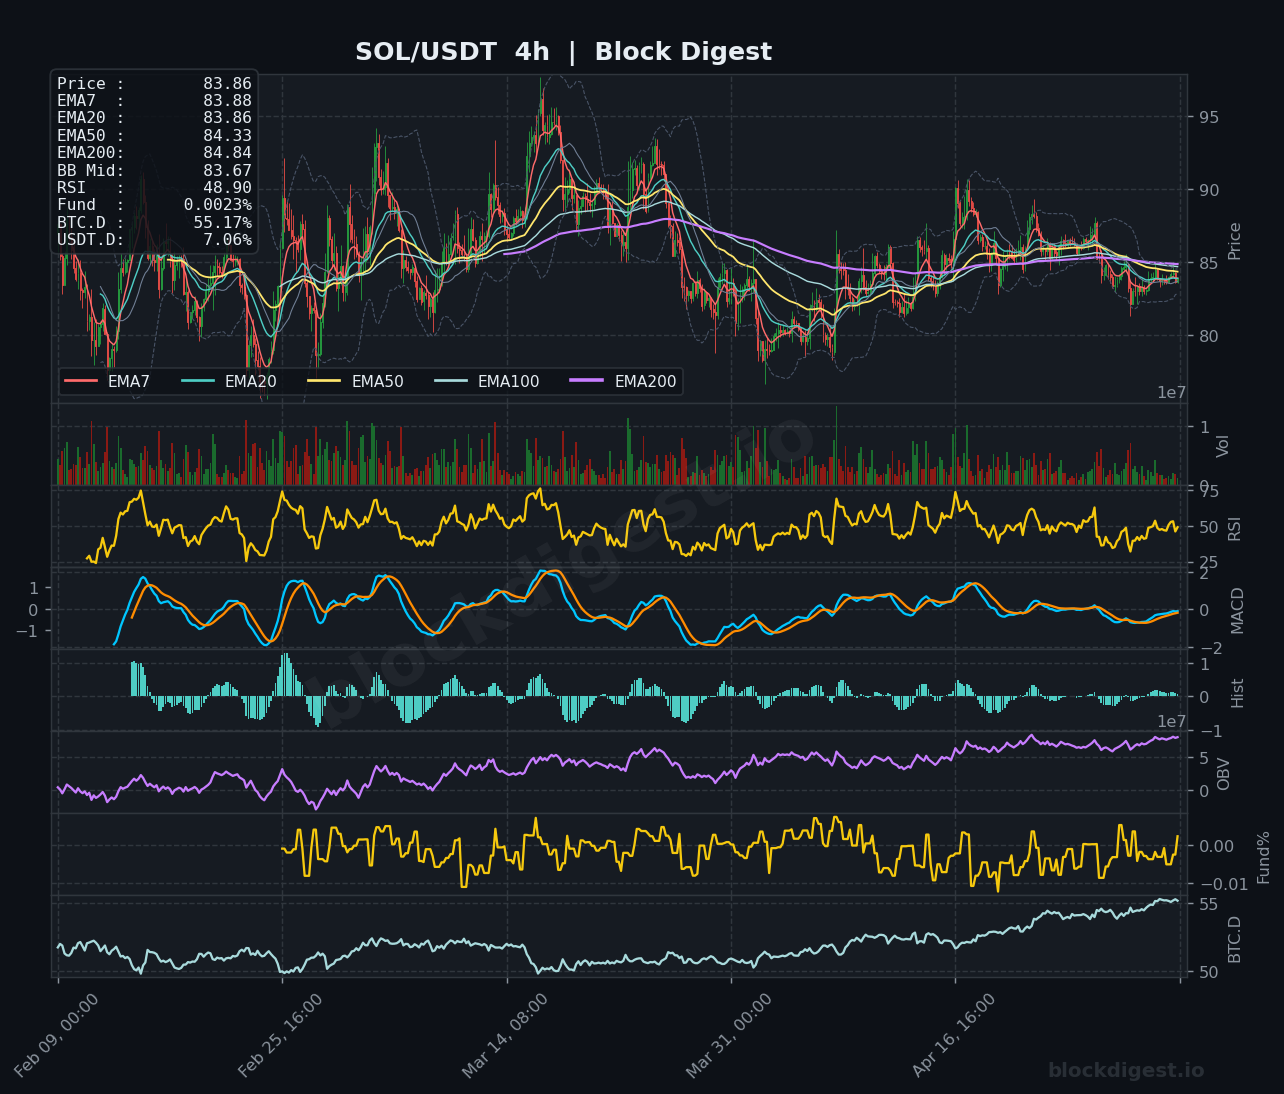
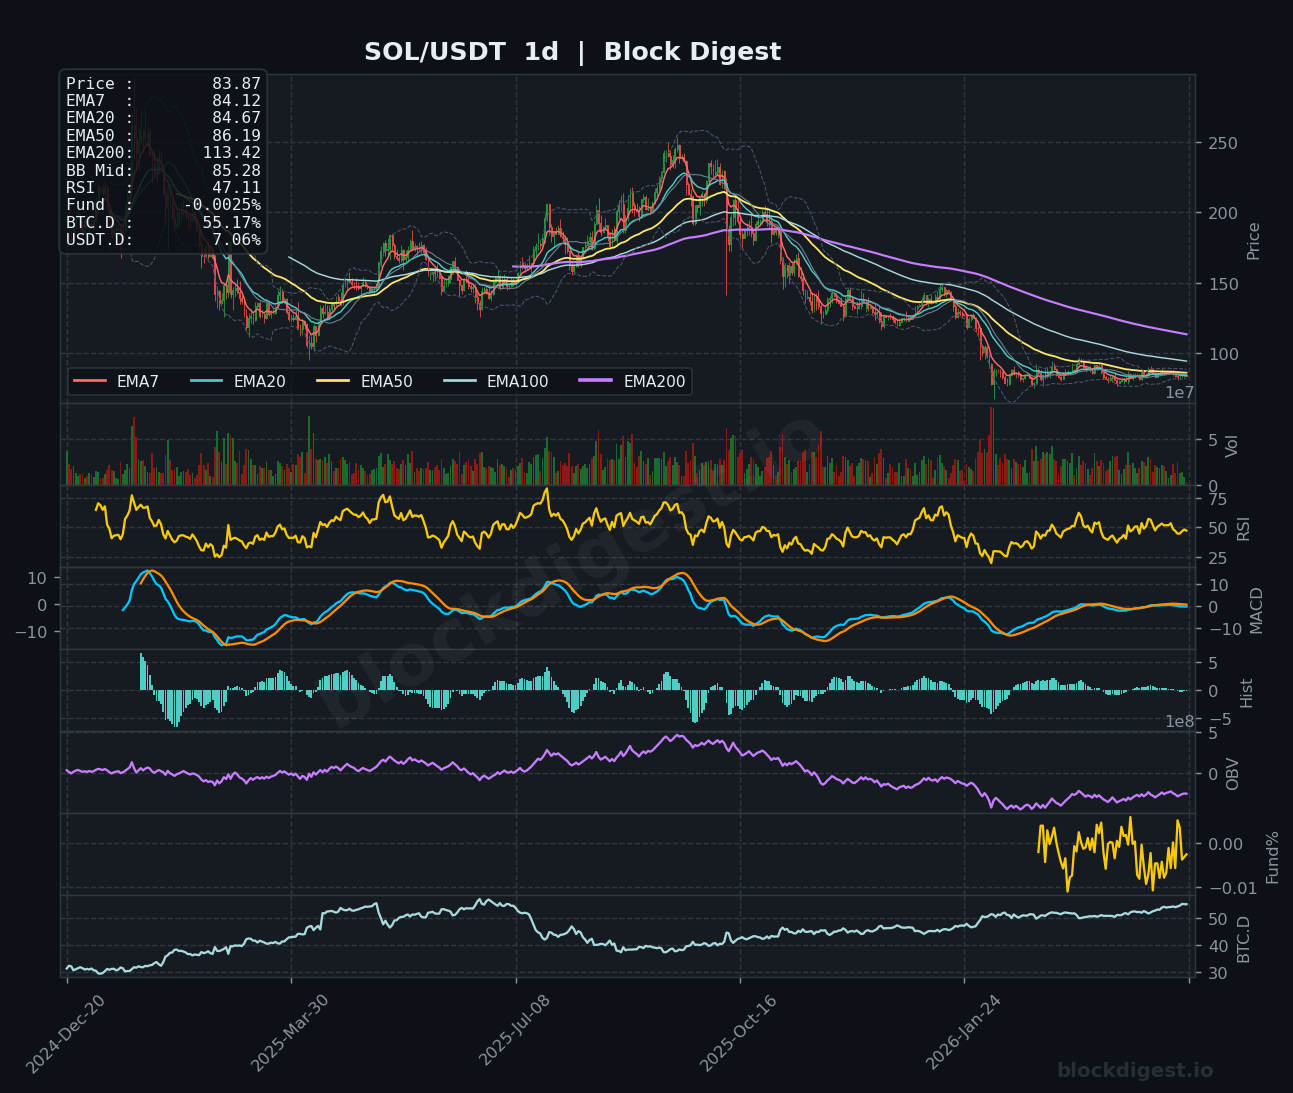
Solana (SOL)
Solana is trading at $83.87, locked in a tight consolidation below key moving averages with price compressed between the EMA50 at $83.85 and EMA200 at $84.33. The RSI at 49.60 reflects neutral momentum, while the MACD remains flat near the zero line, indicating indecision. On the daily timeframe, SOL continues to trade well below its long-term moving averages after a significant downtrend from highs near $250, with price now stabilizing around the $84 level. The short-term bias remains neutral-to-bearish unless SOL can break above $85 with conviction, which would open the door to test the $86-88 resistance zone.
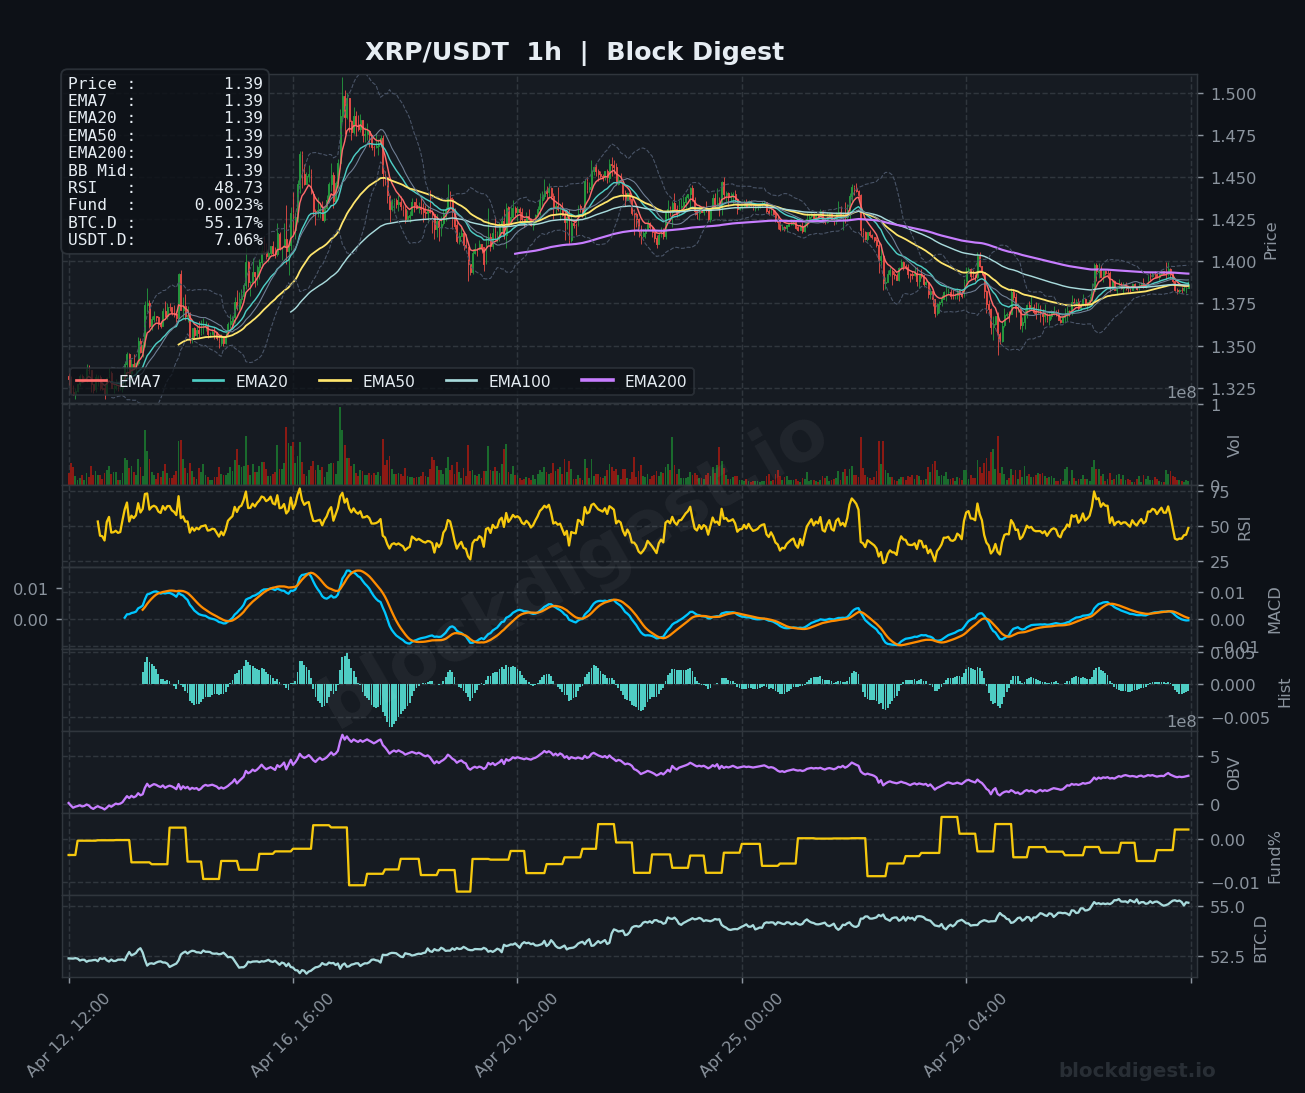
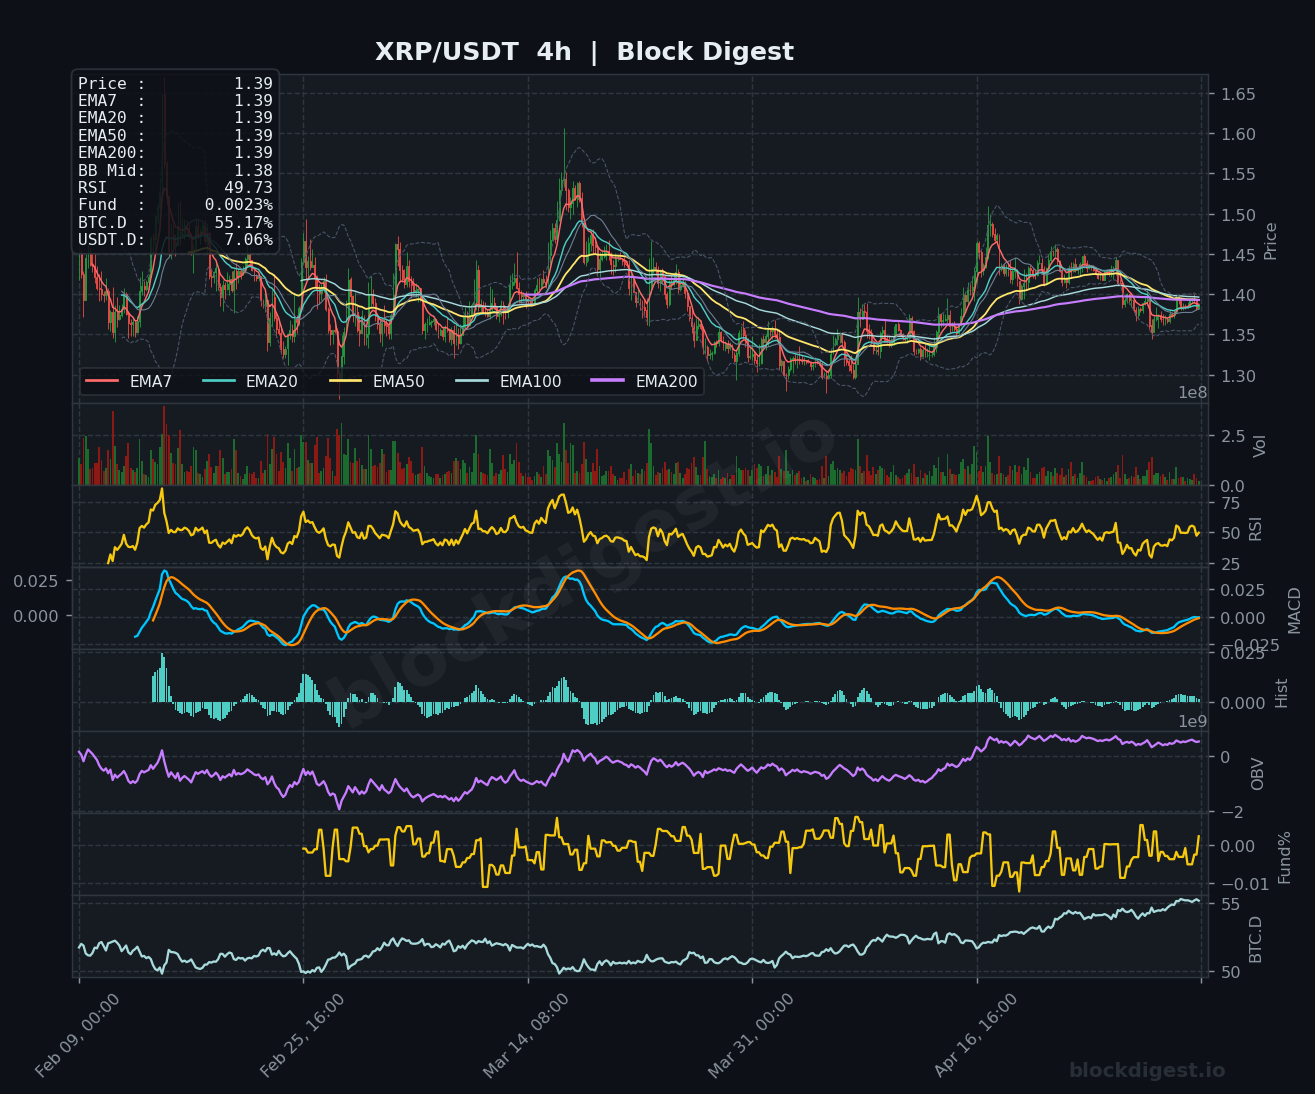
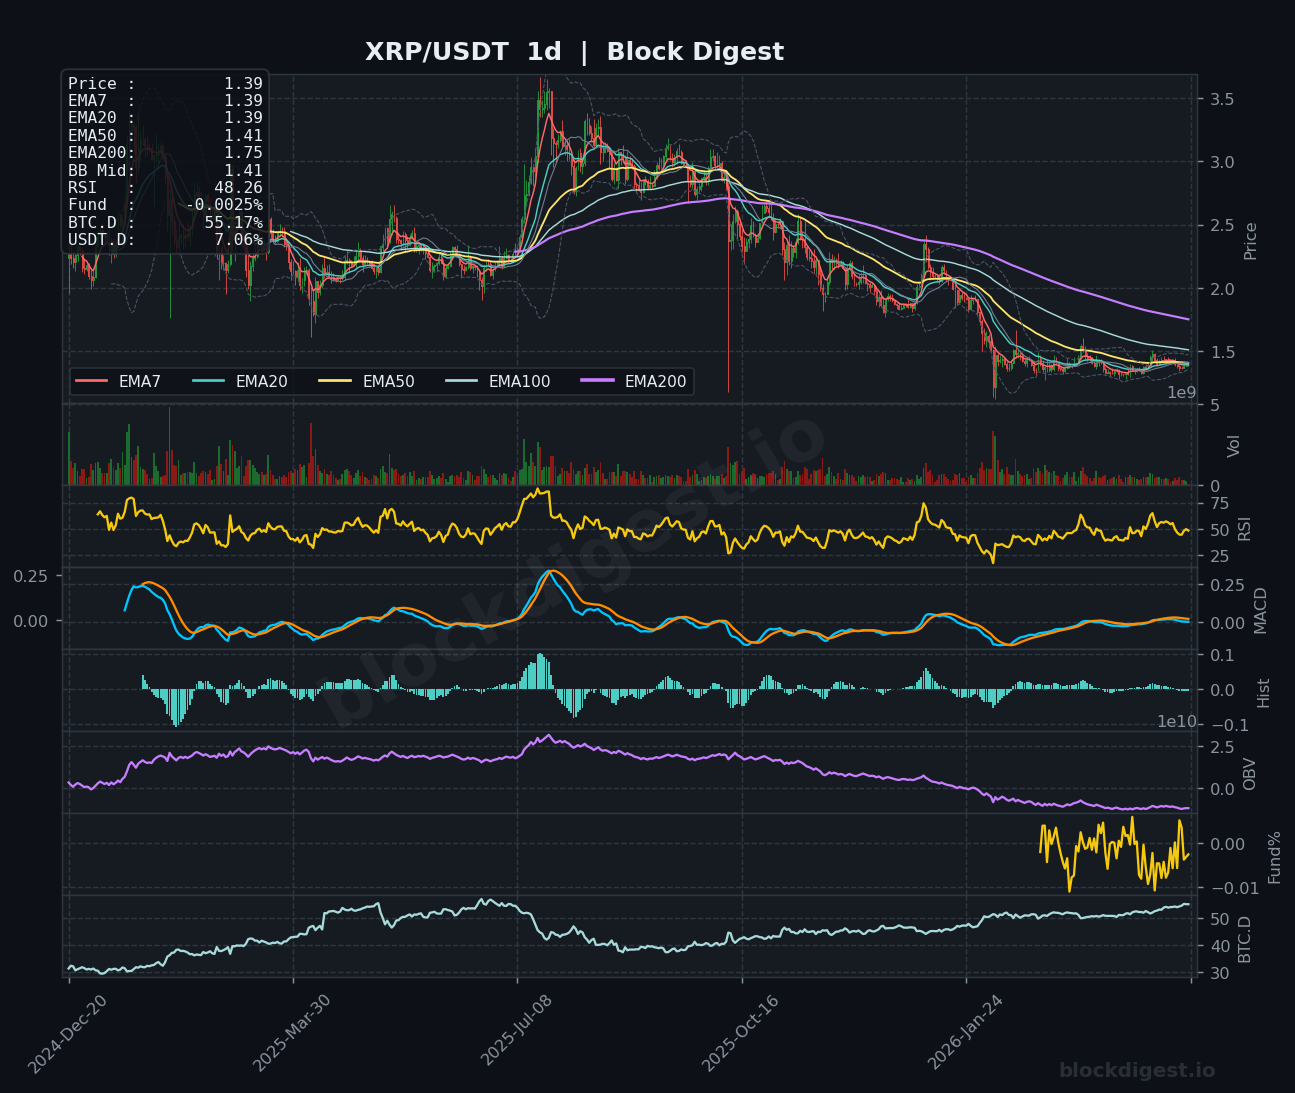
XRP (XRP)
XRP is consolidating at $1.39, trading in a tight range with all major moving averages converging at this level, creating a technical coil. The RSI at 48.73 indicates neutral momentum, while the MACD shows minimal separation, reflecting the current sideways action. On the daily chart, XRP remains trapped below the declining EMA200 at $1.75, struggling to establish any meaningful upward momentum after the prolonged downtrend. The immediate bias is neutral with a slight bearish tilt; a decisive break above $1.42 could trigger short-term bullish momentum toward $1.45-1.50, while failure to hold $1.37 support may lead to renewed selling pressure.
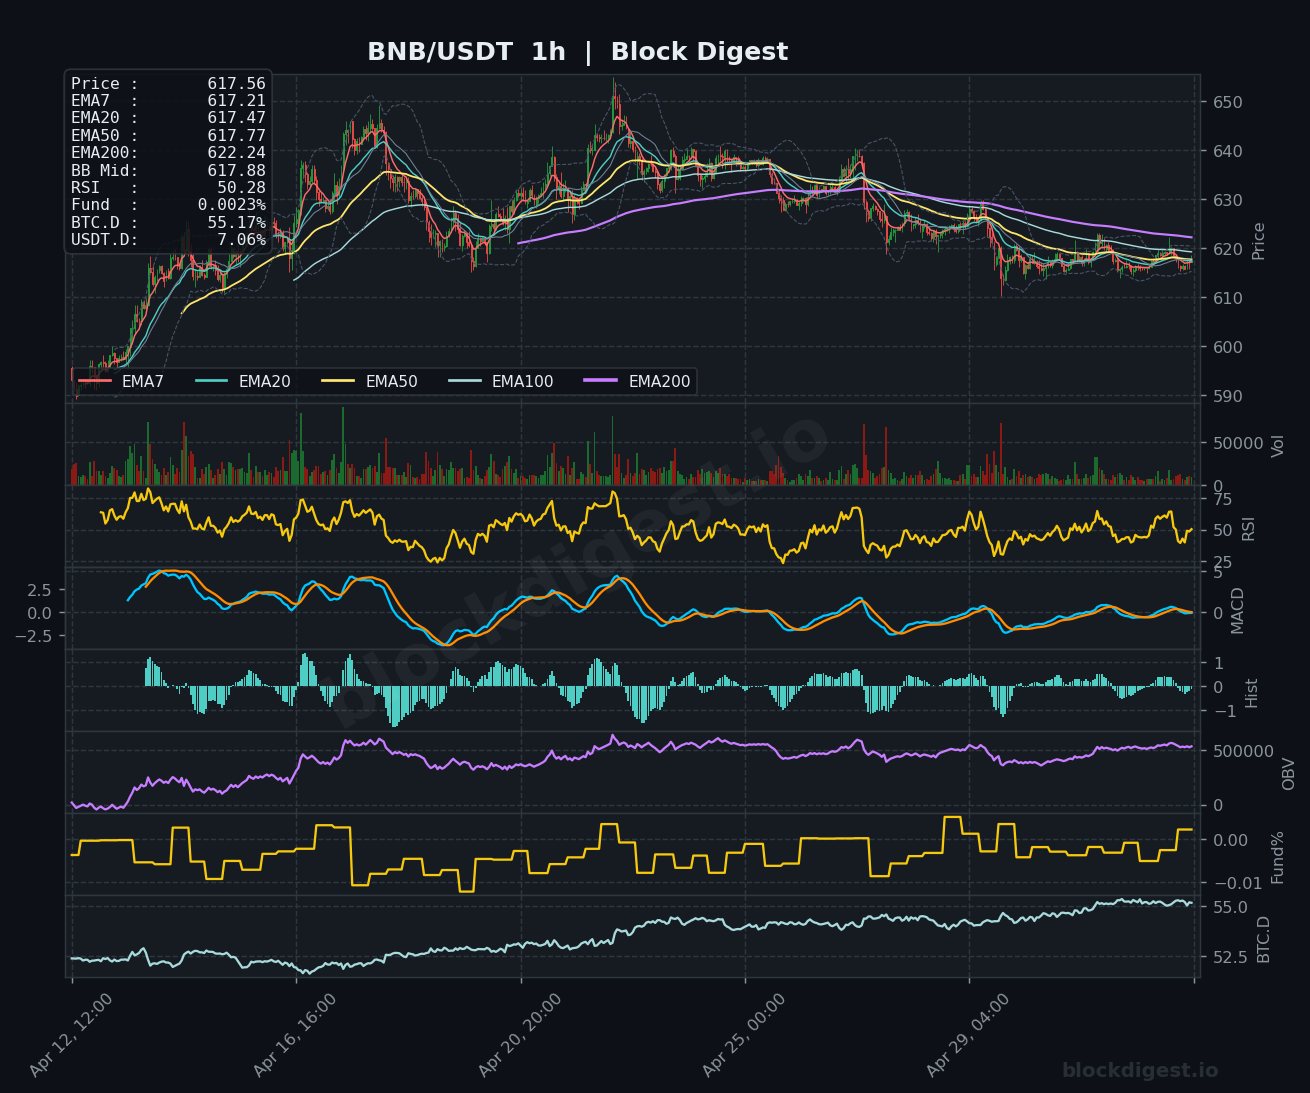
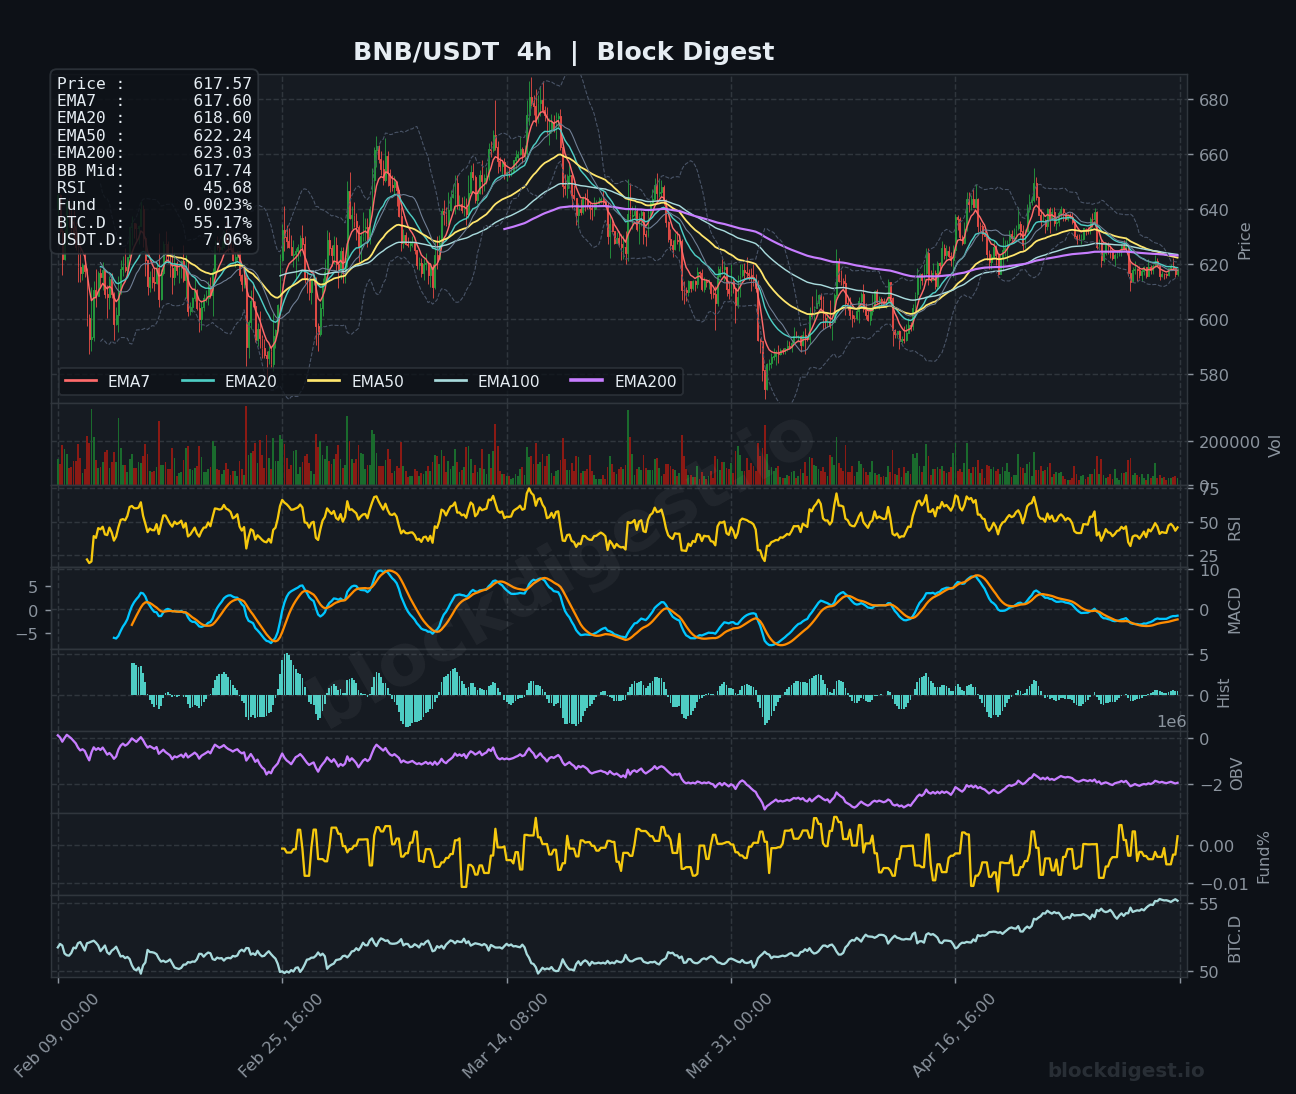
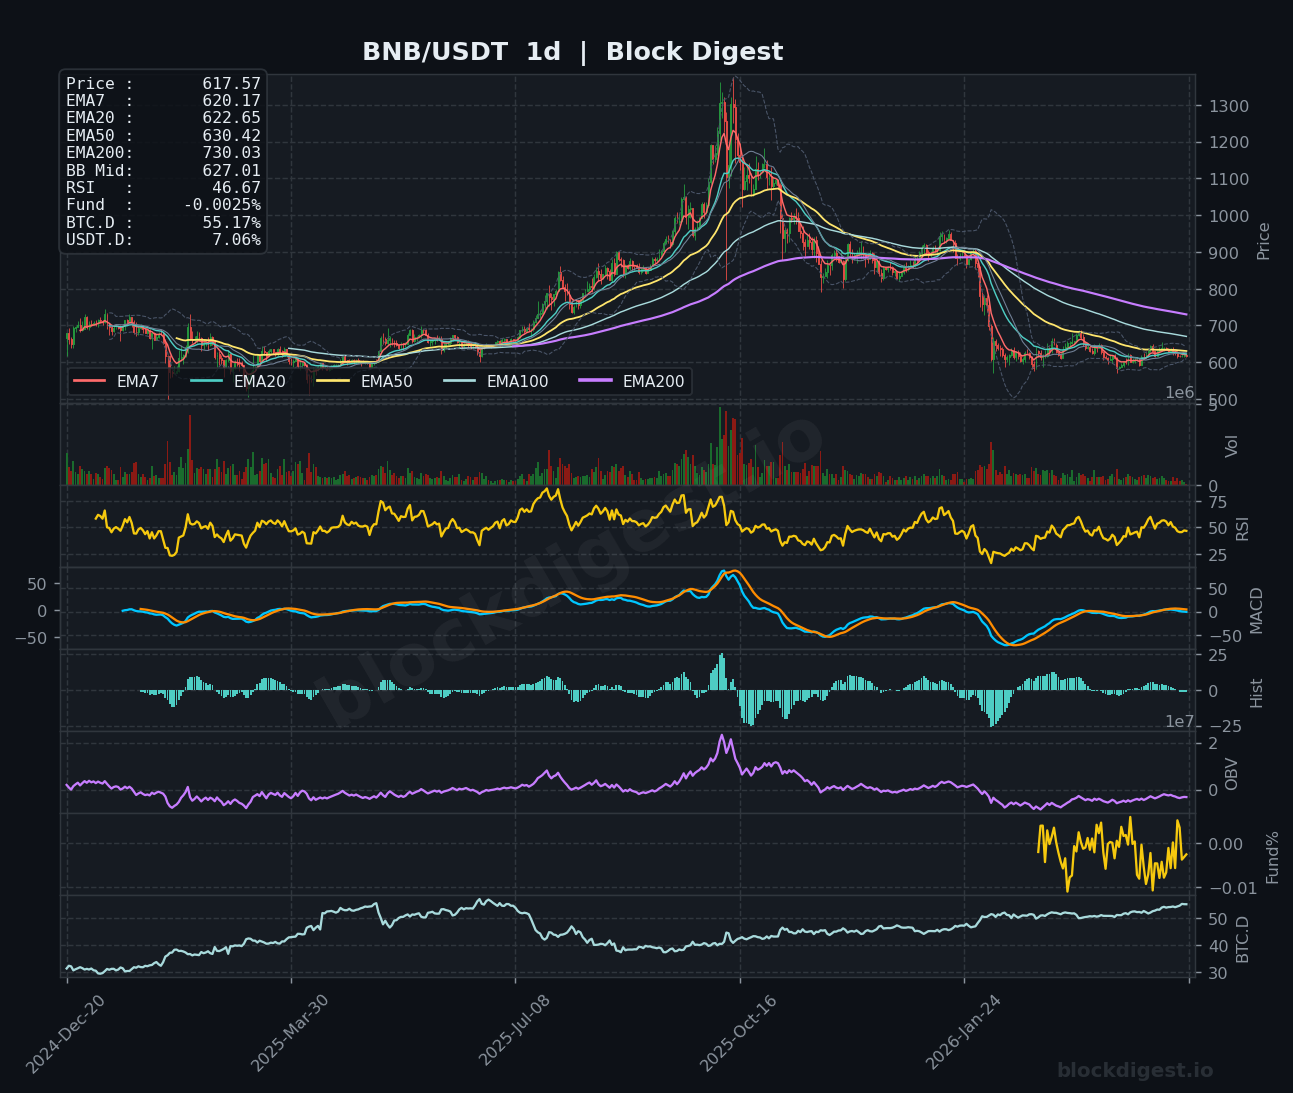
BNB (BNB)
BNB is trading at $617.56, showing relative weakness as price trades below the converging moving averages with the EMA50 at $617.77 acting as immediate resistance. The RSI at 50.28 sits at the midpoint, suggesting equilibrium between buyers and sellers, while the MACD hovers near neutral territory. From a broader perspective, BNB has experienced a significant decline from peaks above $1,300 and continues to trade below all major moving averages on the daily timeframe. The short-term outlook remains cautious; BNB needs to reclaim the $620-625 zone to shift momentum positively, otherwise continued consolidation or drift toward $610 support appears likely.
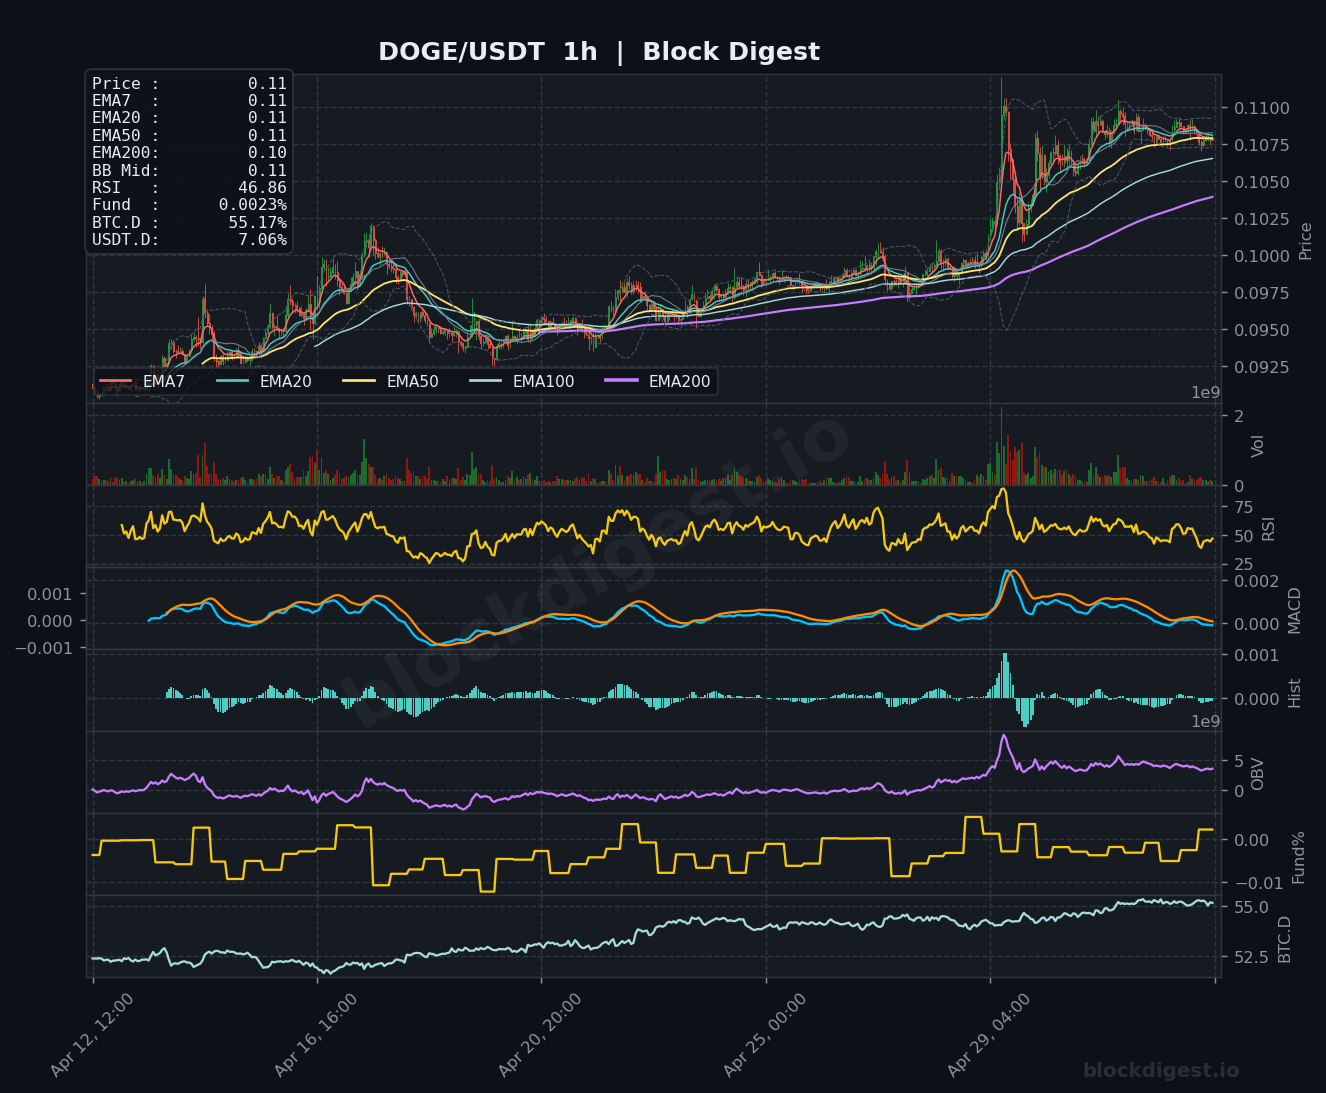
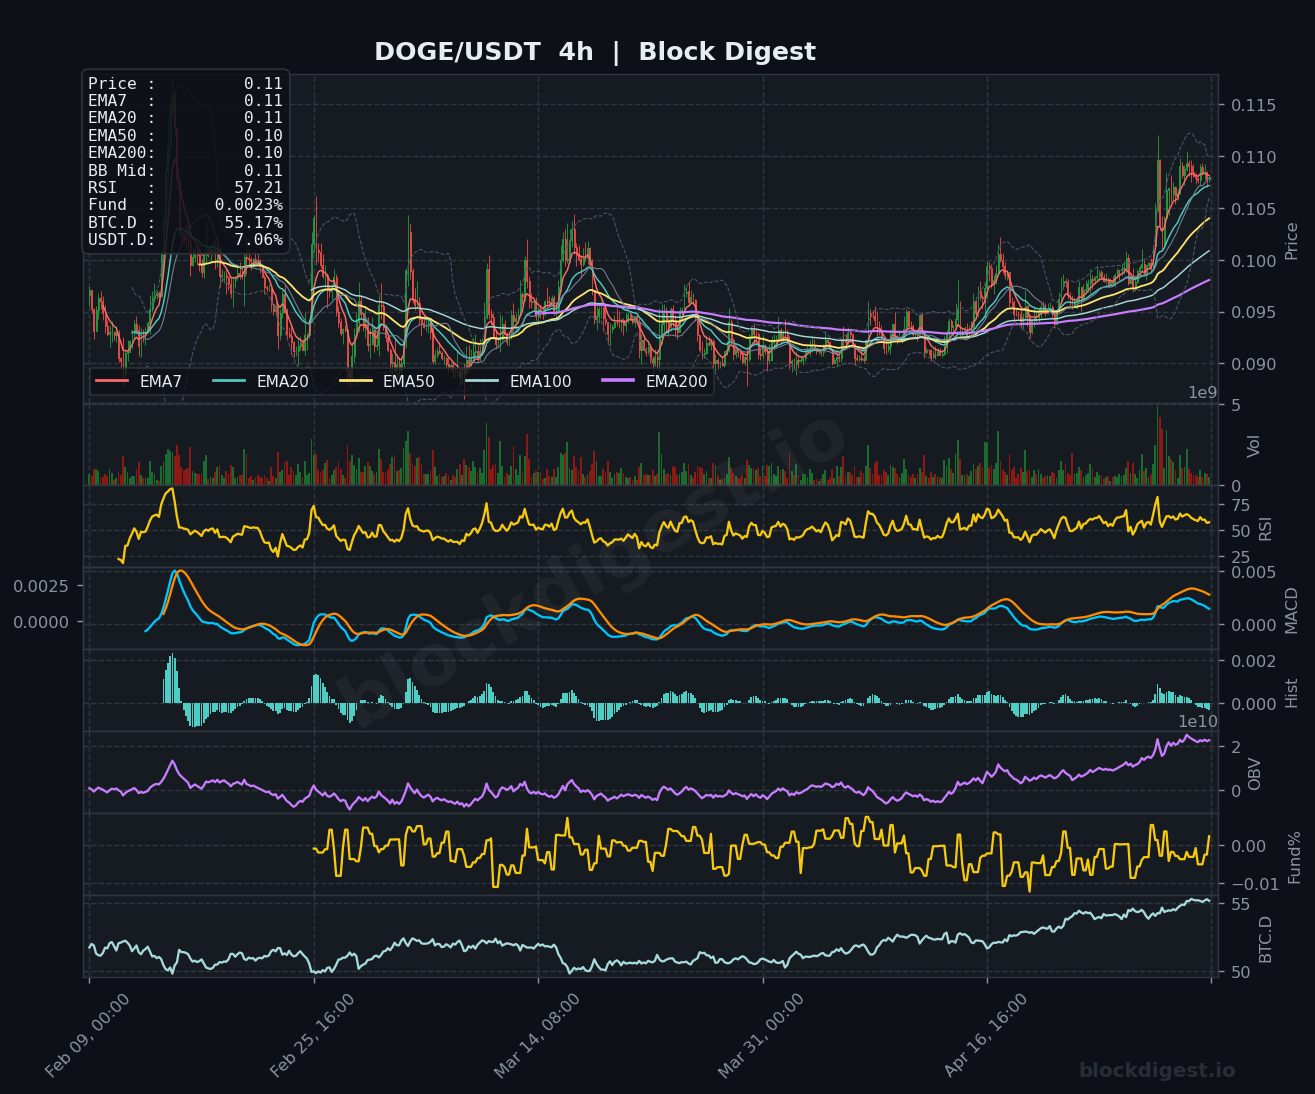
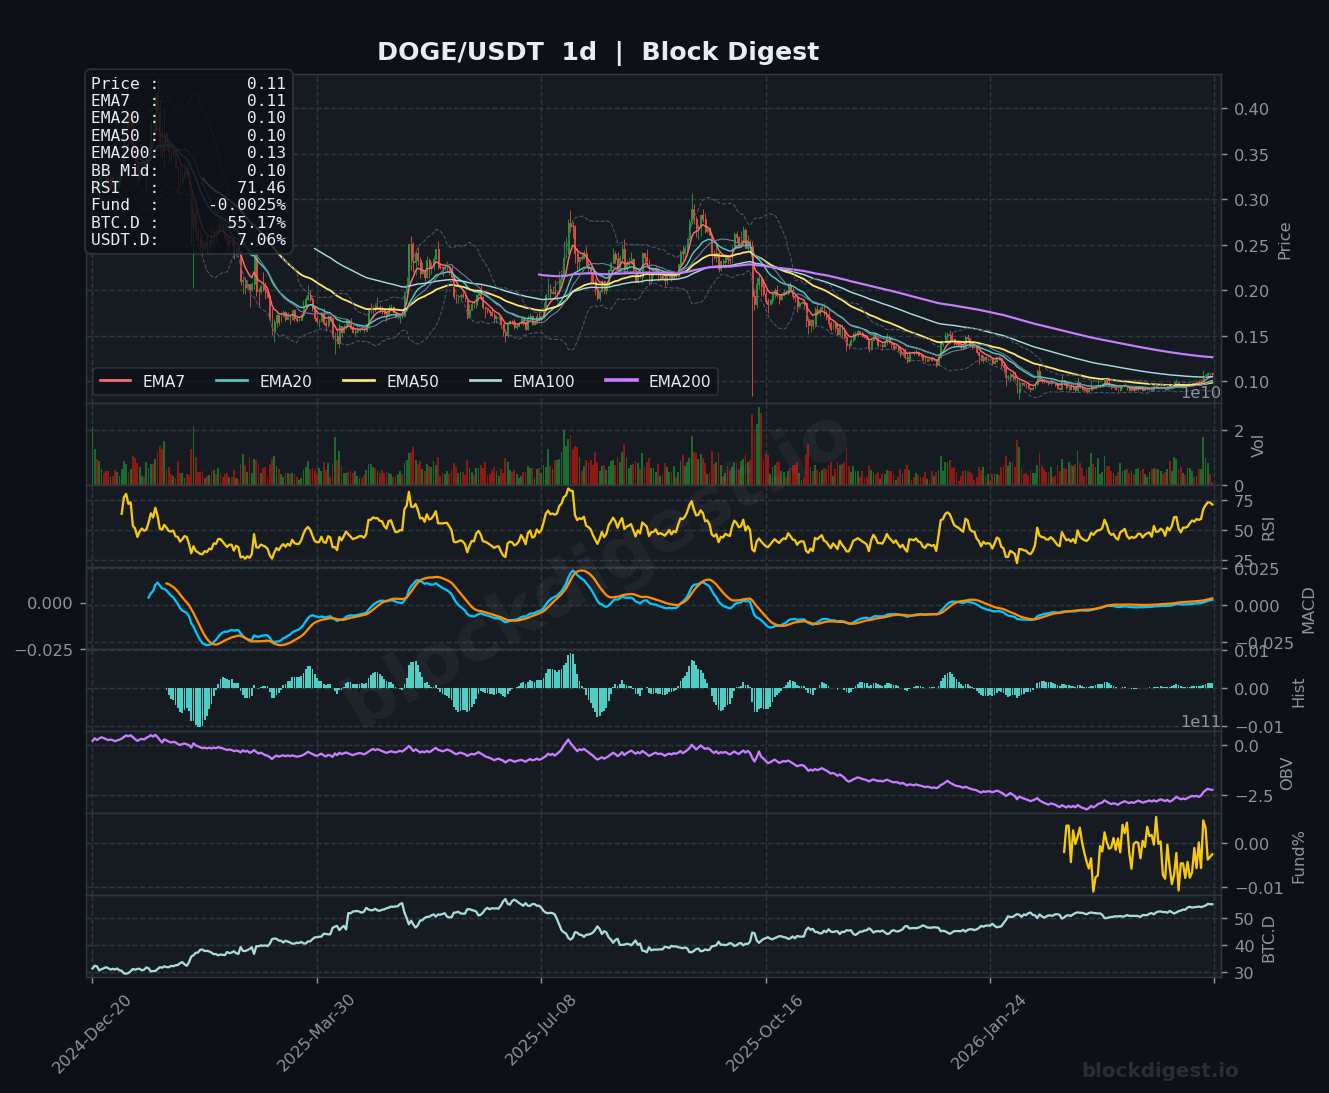
Dogecoin (DOGE)
Dogecoin is trading at $0.1100, showing signs of renewed strength after breaking above its converging moving averages with price now testing resistance near recent highs. The RSI at 46.86 remains below the midpoint despite the recent rally, suggesting room for further upside if momentum builds, while the MACD is beginning to show positive divergence. On the 4-hour chart, DOGE has established a clear uptrend with price climbing above the EMA50 and EMA200, and the RSI at 57.21 indicates building bullish momentum. The short-term bias is bullish; a sustained move above $0.1110 could open the path toward $0.1150-0.1200, though overbought conditions on shorter timeframes warrant caution for potential pullbacks to the $0.1050-0.1070 support zone.
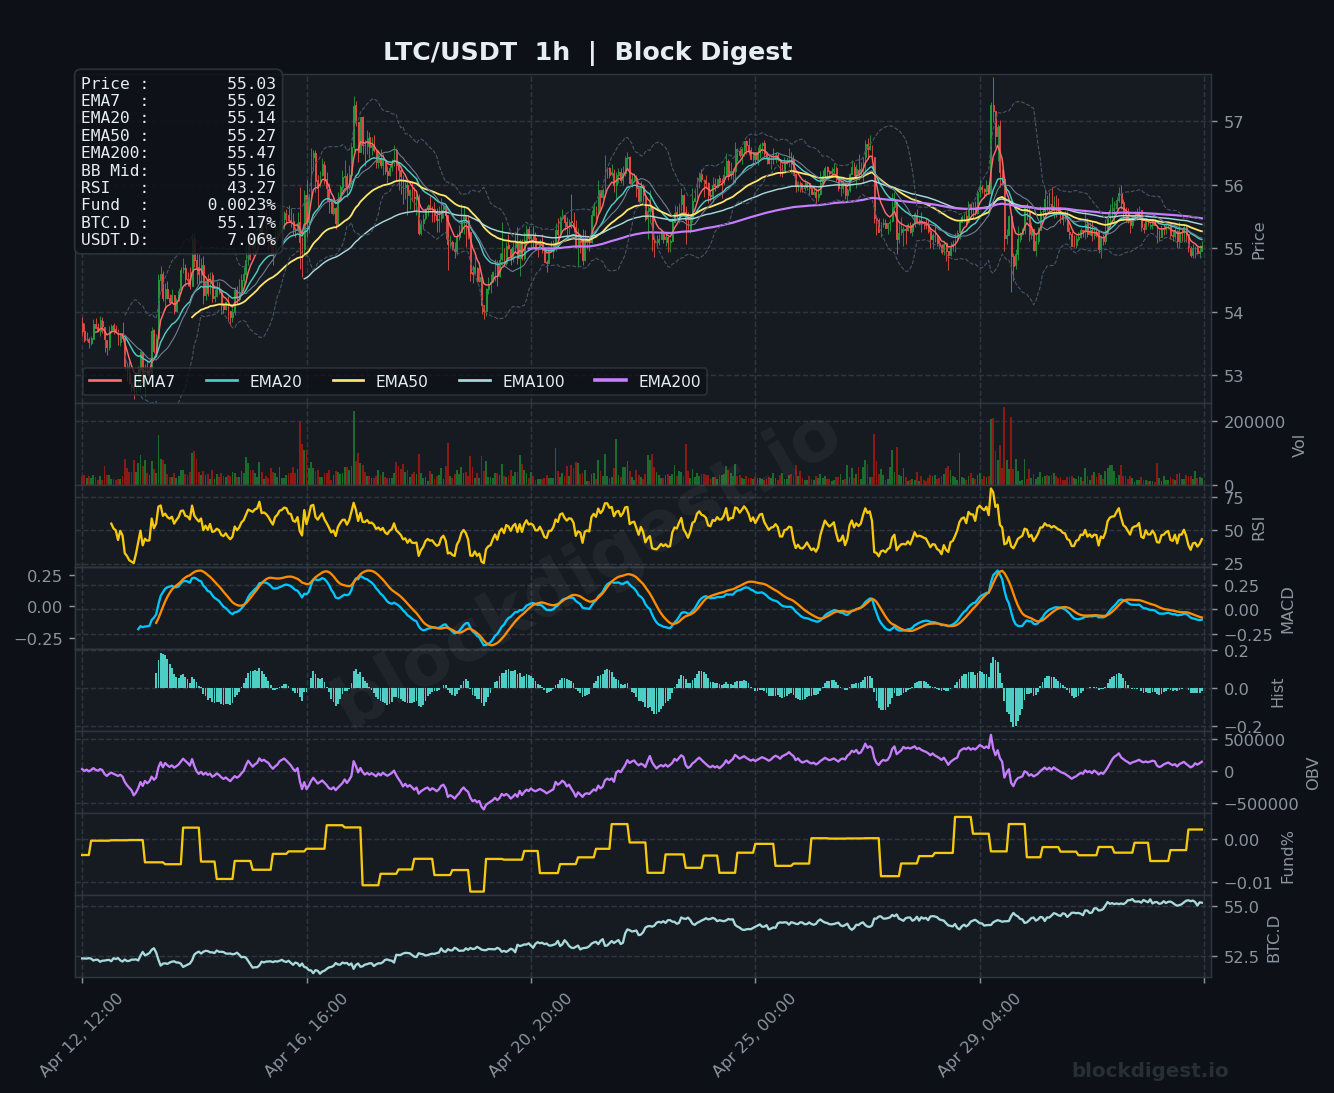
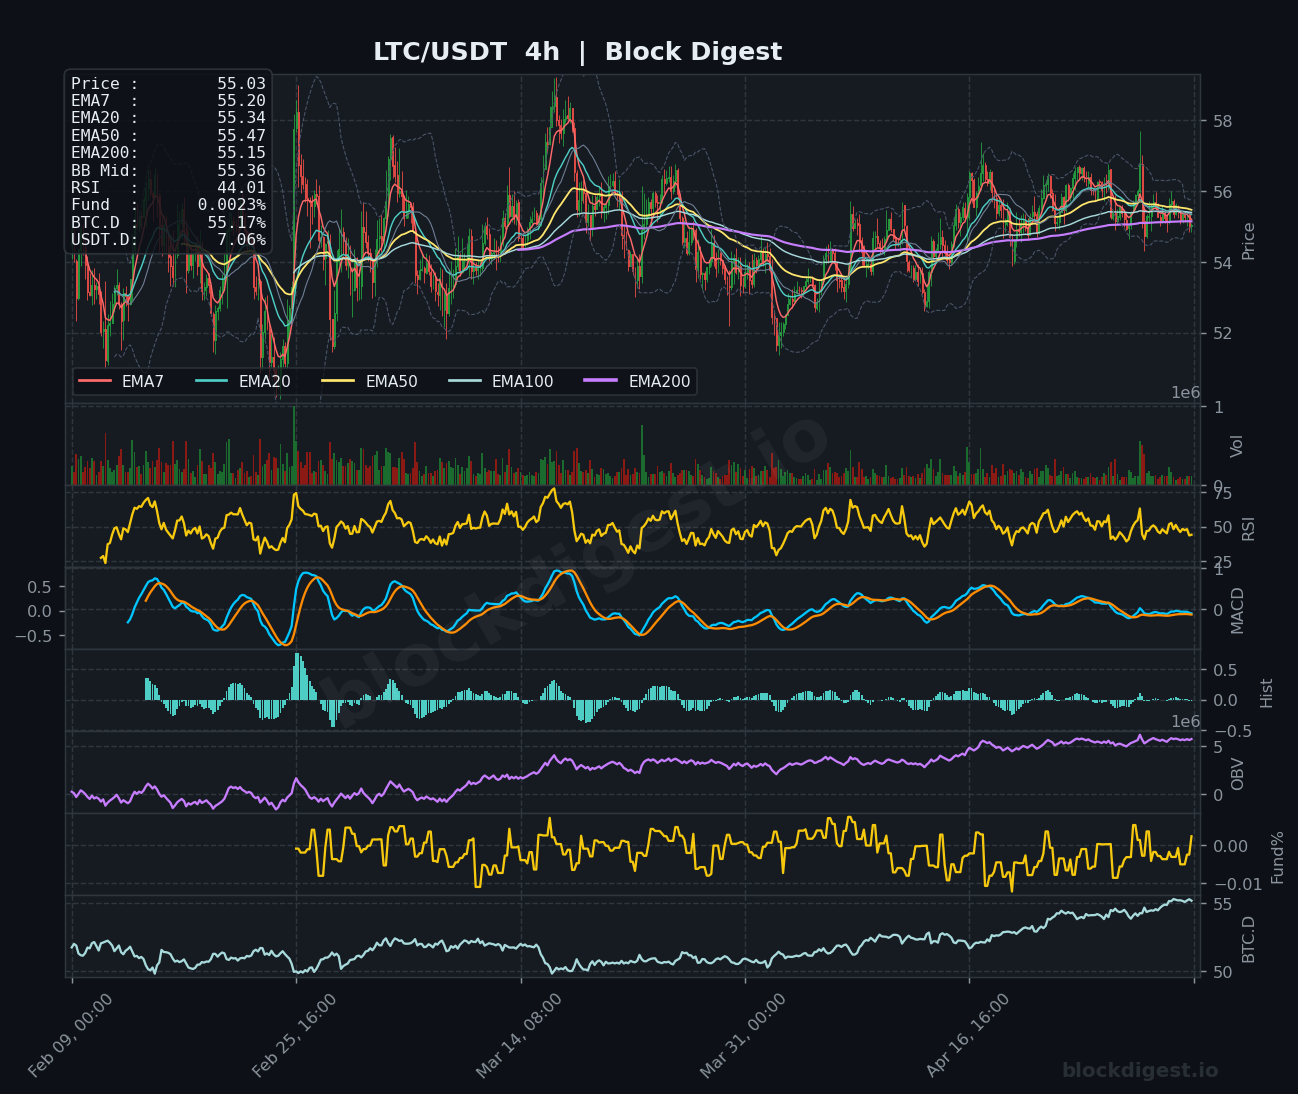
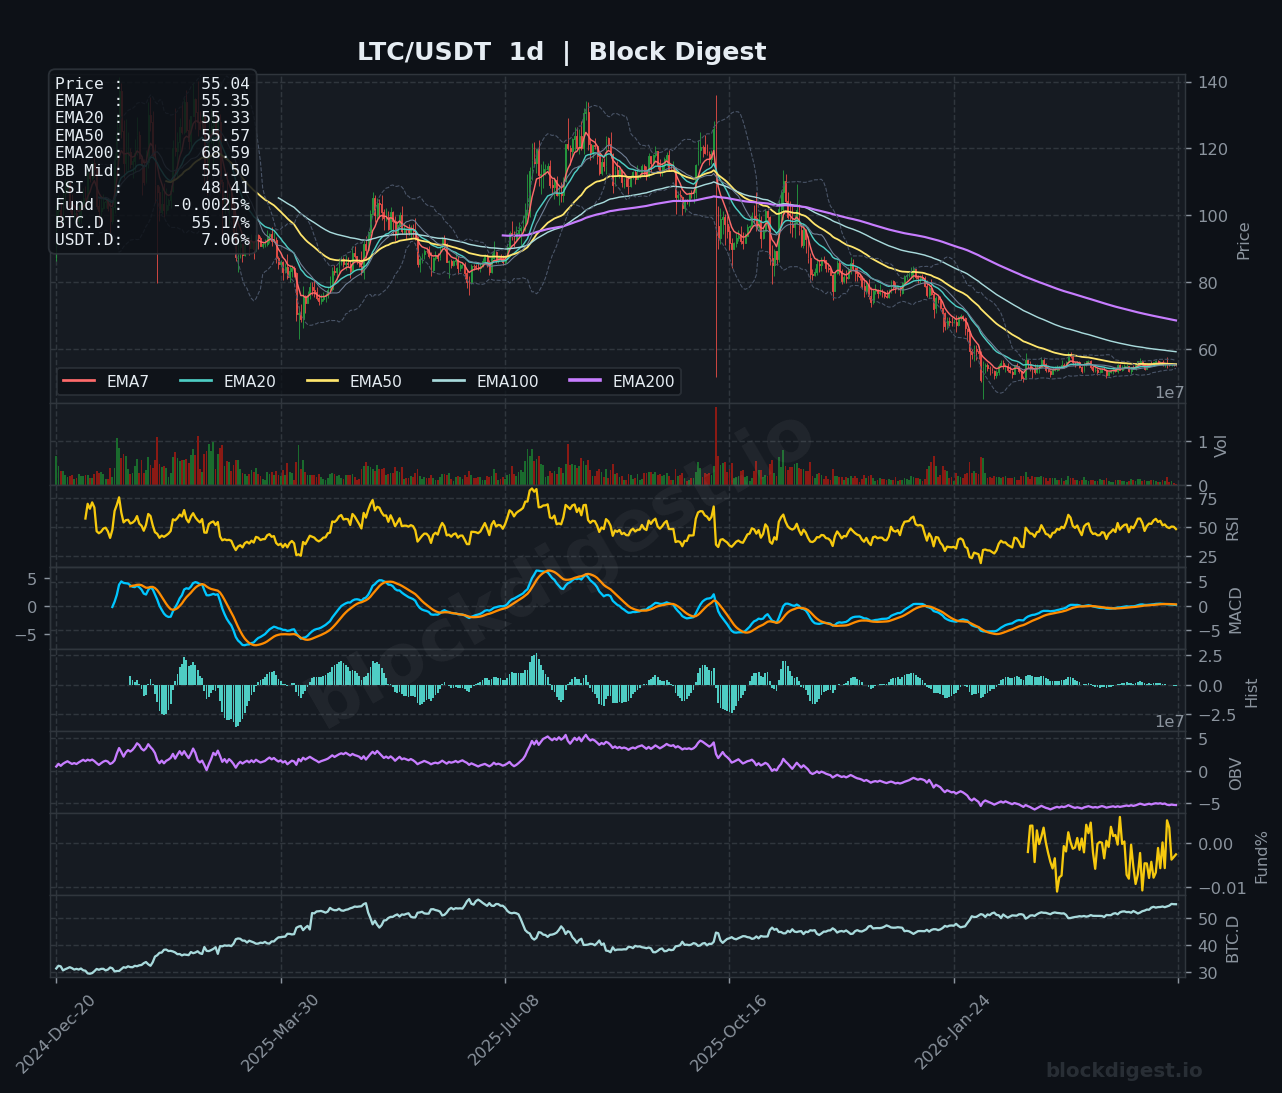
Litecoin (LTC)
Litecoin is trading at $55.03, trapped in a tight range with all moving averages compressed around the current price level, reflecting extended consolidation. The RSI at 43.27 suggests slightly bearish momentum, while the MACD remains flat near the zero line with no clear directional bias. On the daily chart, LTC continues to trade significantly below its long-term moving averages following a prolonged decline from highs near $140, with price now grinding sideways in the $54-56 range. The short-term outlook is neutral-to-bearish; LTC needs to break above $56 with volume to gain bullish traction, otherwise the risk of drift toward $53-54 support remains elevated.
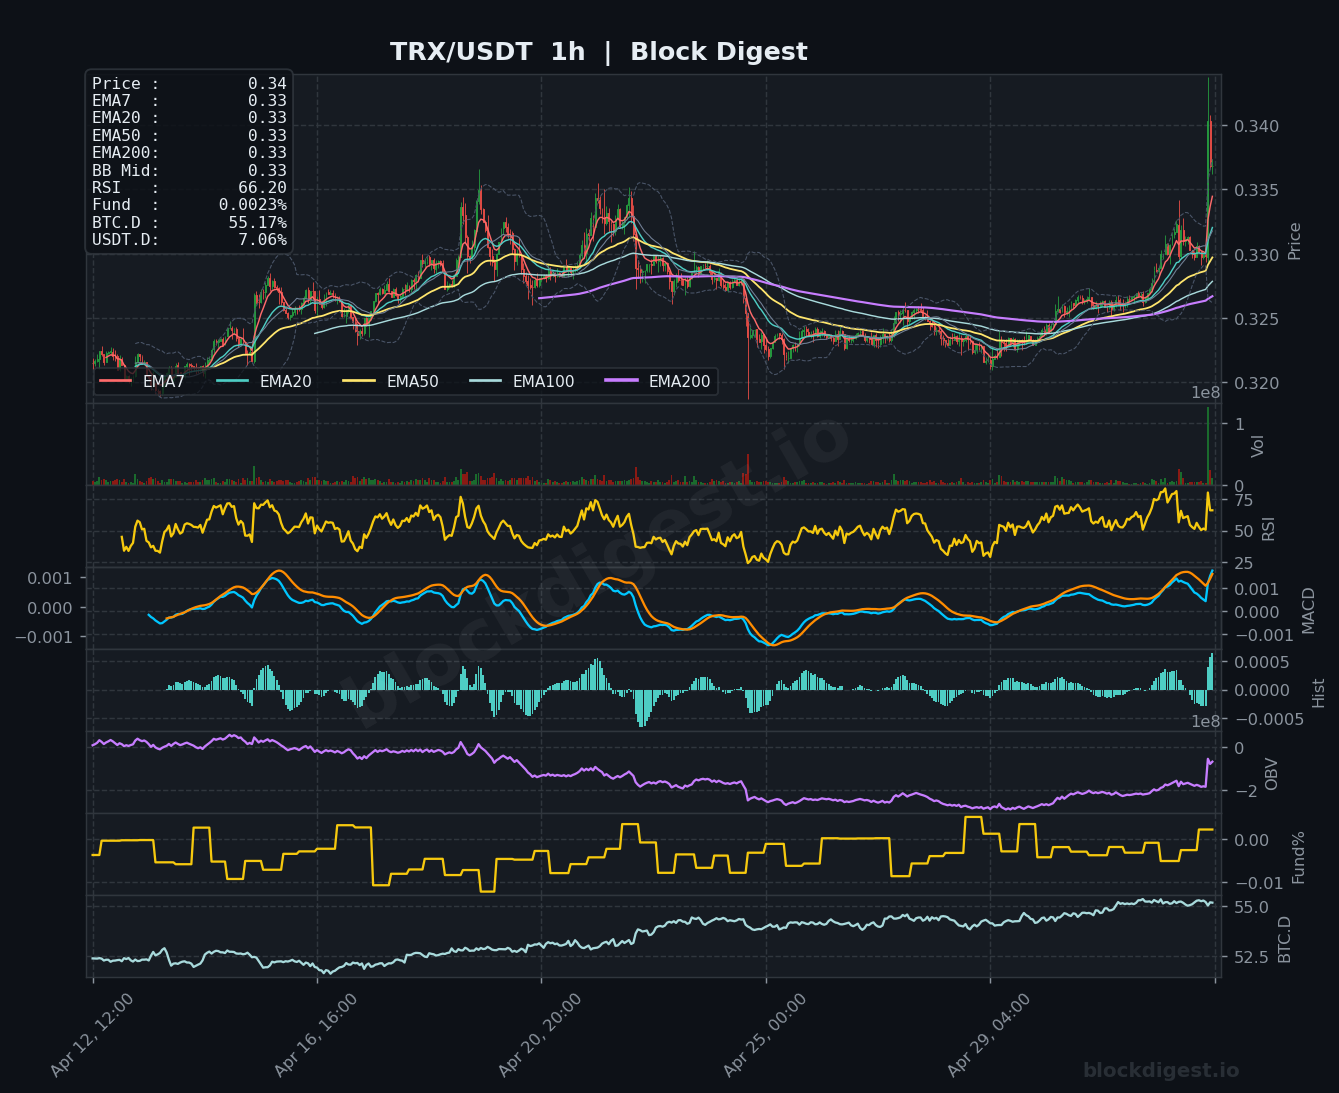
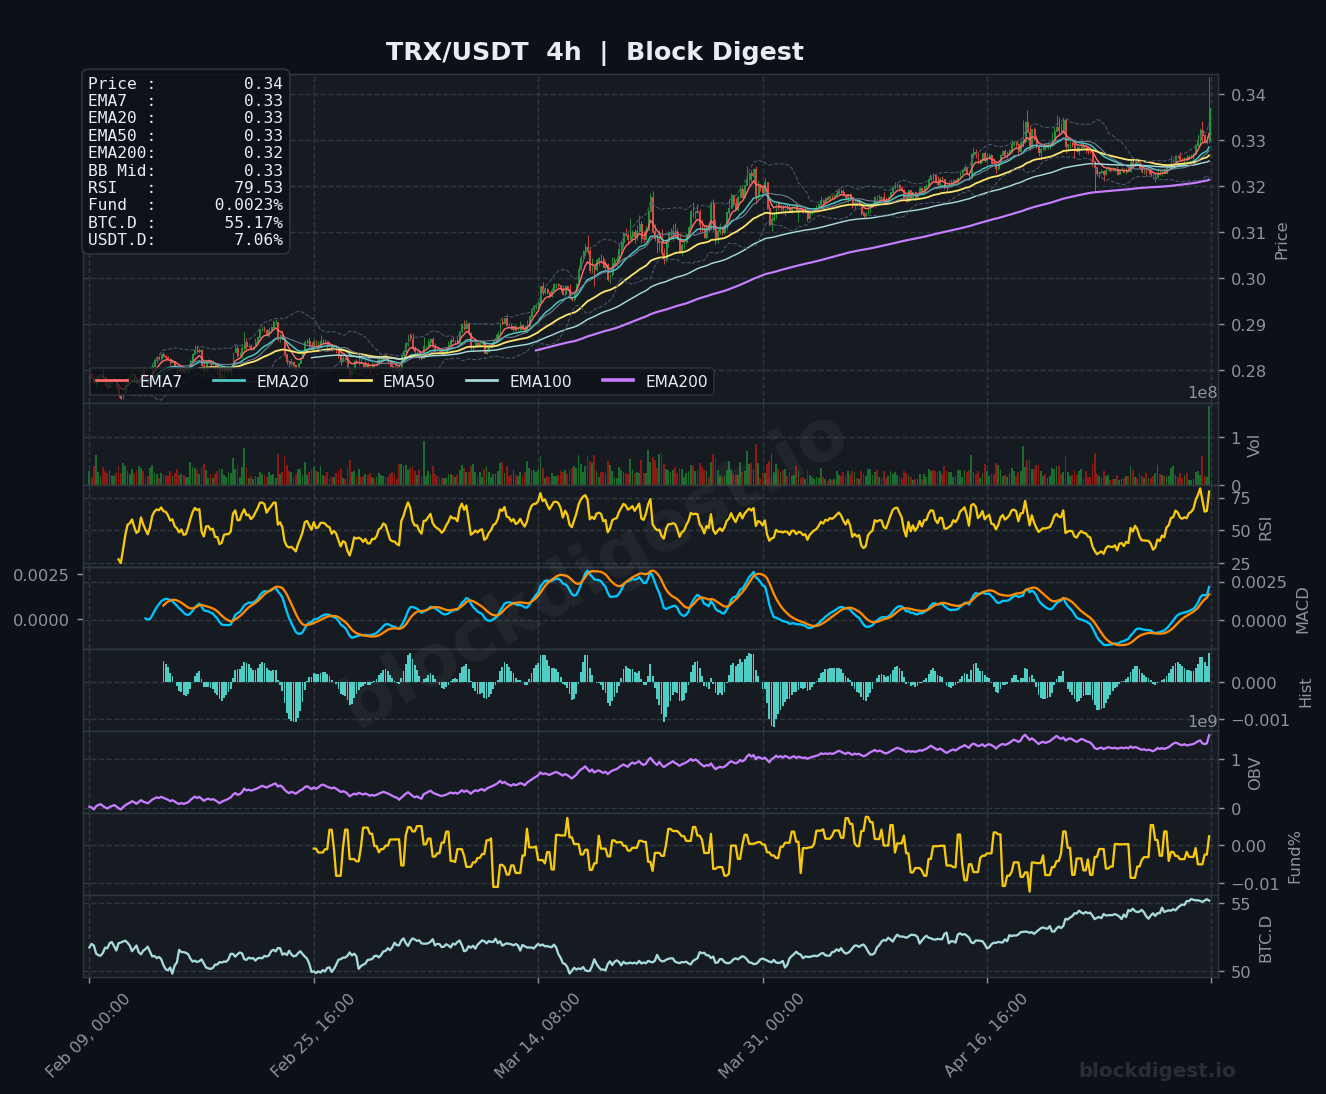
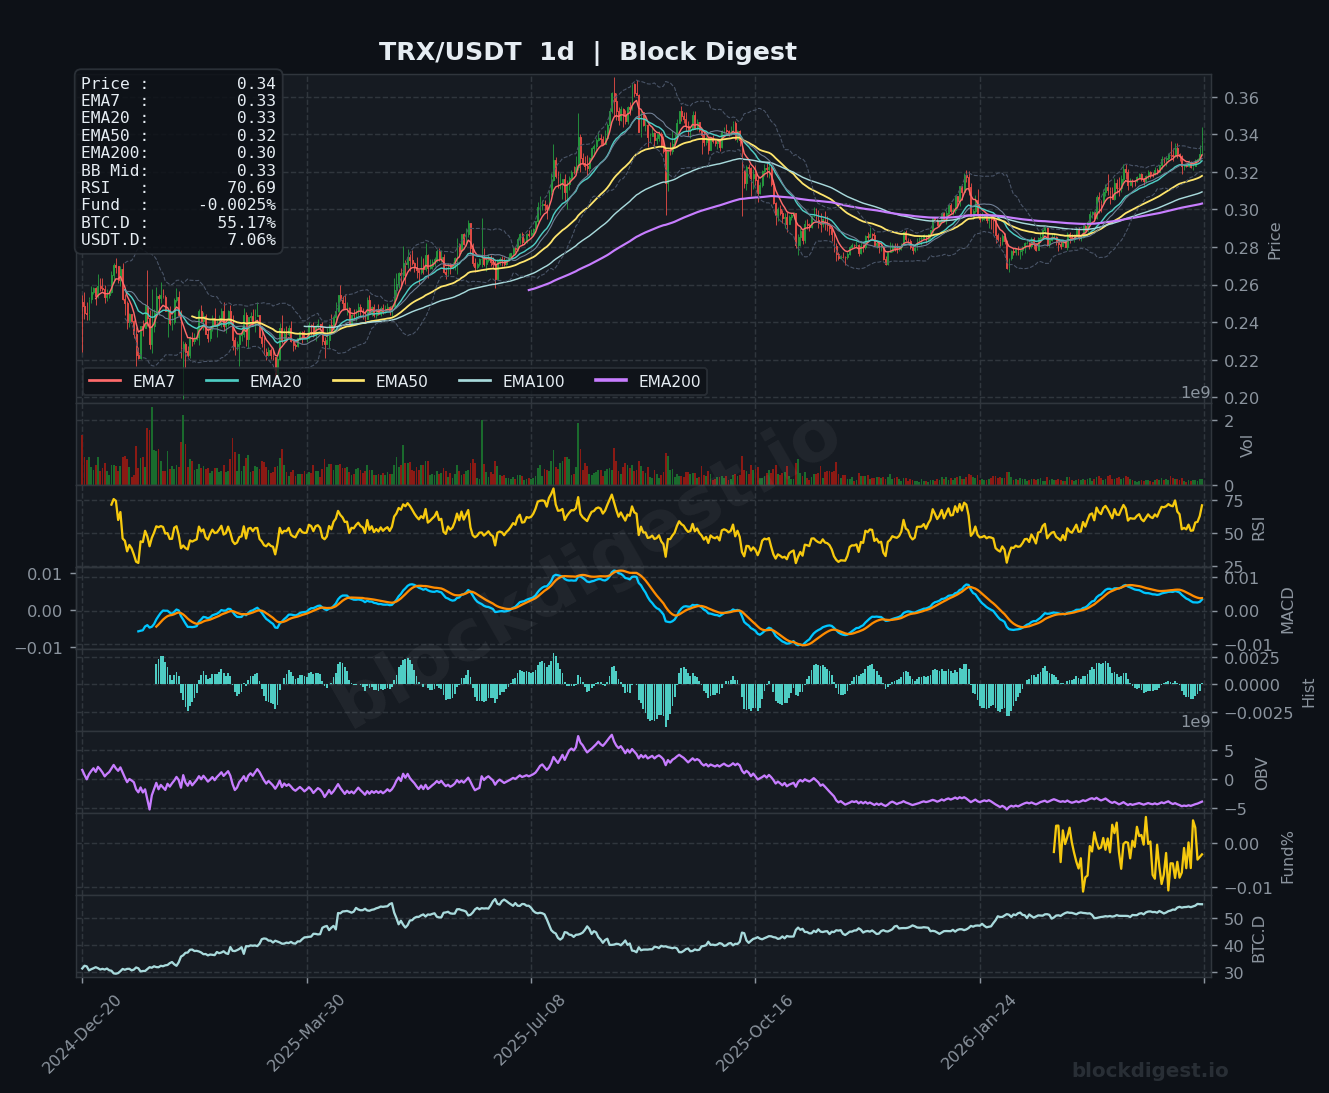
TRON (TRX)
TRON is exhibiting the strongest performance among major altcoins, trading at $0.34 with a powerful breakout above all major moving averages. The 1-hour RSI at 66.20 indicates building momentum approaching overbought territory, while the MACD shows strong positive divergence with expanding green histogram bars. On the 4-hour timeframe, TRX displays an impressive RSI reading of 70.53, confirming the strength of the current uptrend as price trades well above the EMA200. The short-term bias is decidedly bullish; TRX appears poised to test resistance at $0.35, with potential for extension toward $0.36-0.37 if momentum persists, though traders should monitor for overbought pullbacks to the $0.32-0.33 zone which would offer healthier entry opportunities.
Altcoin Outlook
The altcoin market presents a fragmented landscape with divergent setups across major tokens, suggesting sector-specific dynamics rather than coordinated moves. TRON stands out with the strongest technical setup, showing clear bullish momentum and breakout structure, while DOGE displays emerging strength worth monitoring. In contrast, SOL, XRP, BNB, and LTC remain trapped in consolidation patterns with bearish-to-neutral biases, requiring clear breakouts above resistance to shift sentiment. The key conditions to watch include Bitcoin’s behavior around current levels and whether USDT.D remains stable—any significant move in either could catalyze coordinated altcoin action and break the current indecisive environment.
Disclaimer: This analysis is for informational purposes only and does not constitute financial advice. Cryptocurrency markets are highly volatile and unpredictable. All trading decisions should be made based on your own research and risk tolerance. Block Digest is not responsible for any financial losses incurred as a result of acting on this content.