BTC Daily Analysis — May 03, 2026
BTC Daily Analysis – May 03, 2026
Market Overview
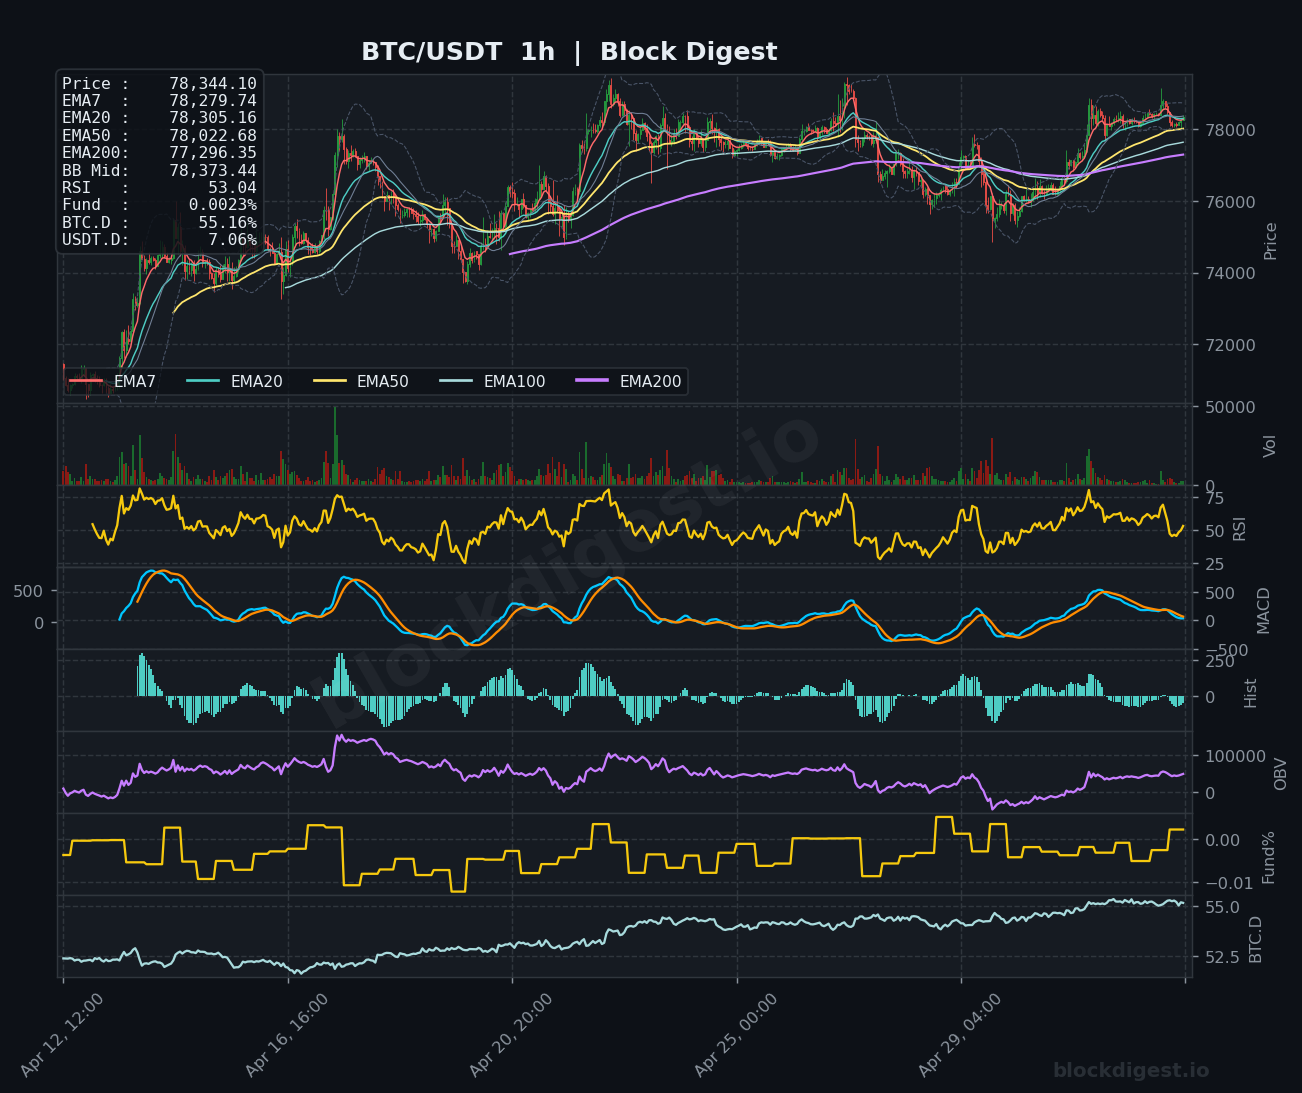
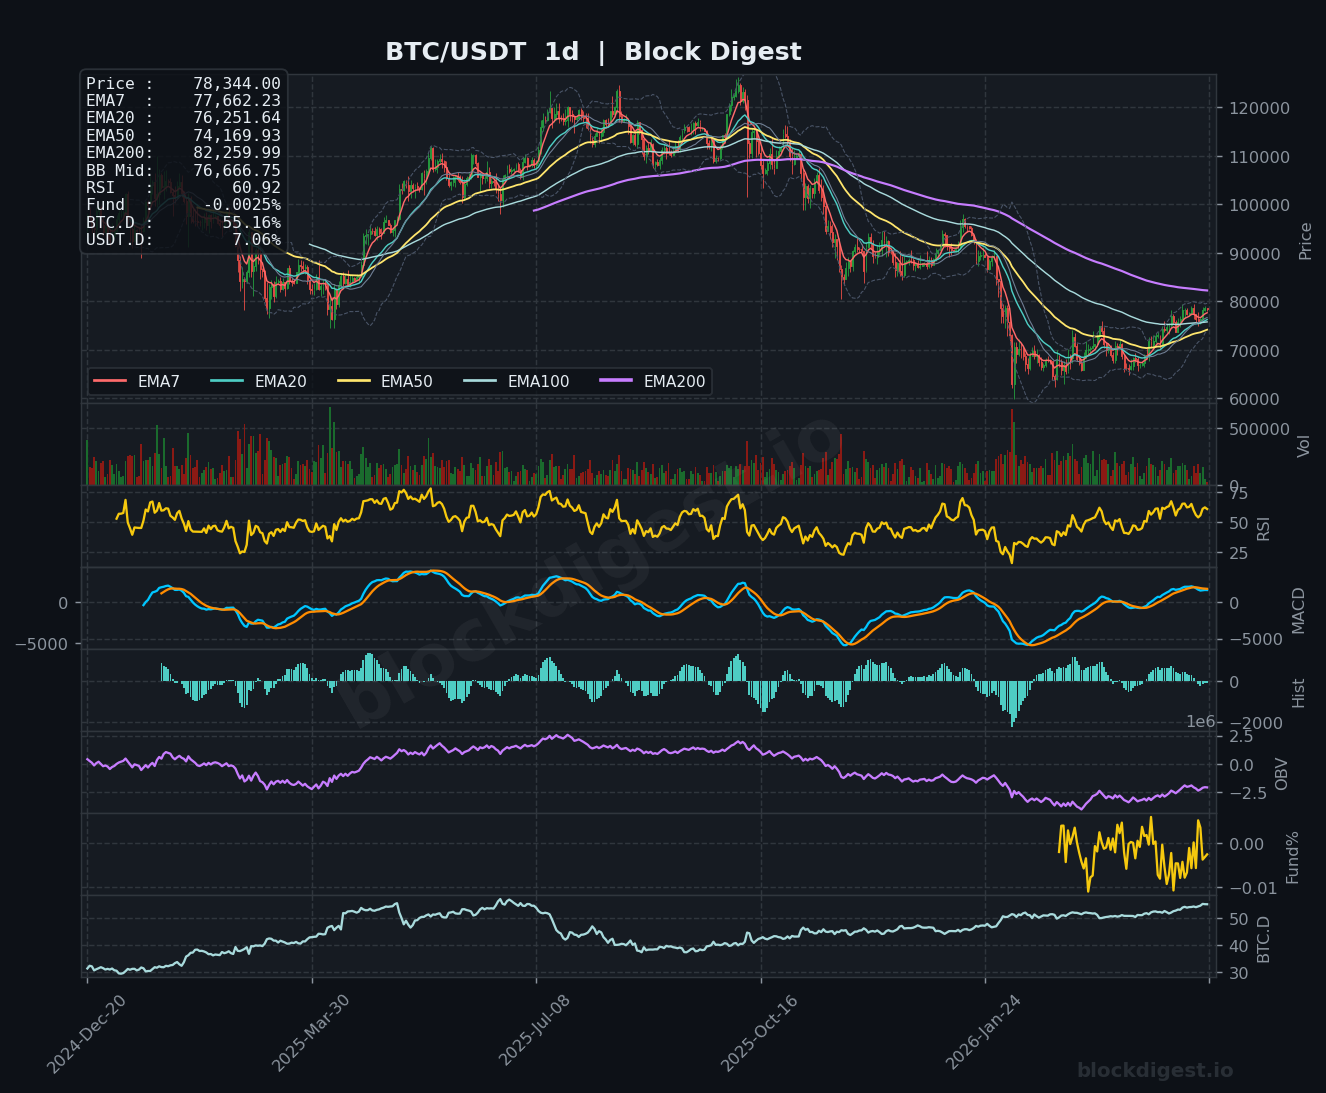
Bitcoin is currently trading at $78,344, positioned above all major exponential moving averages across the 1-hour timeframe, signaling near-term bullish momentum. Price is tracking along the upper Bollinger Band on the 1-hour chart at $78,373, suggesting potential overextension but also strong buying pressure. The daily timeframe reveals a more complex picture: BTC remains below the EMA200 at $82,259, indicating the broader trend is still in recovery mode following the significant correction visible in the left portion of the daily chart. The immediate structure shows consolidation with price compressed between the EMA50 at $74,169 and psychological resistance near $80,000, creating a critical inflection point for directional resolution.
Multi-Timeframe Confluence
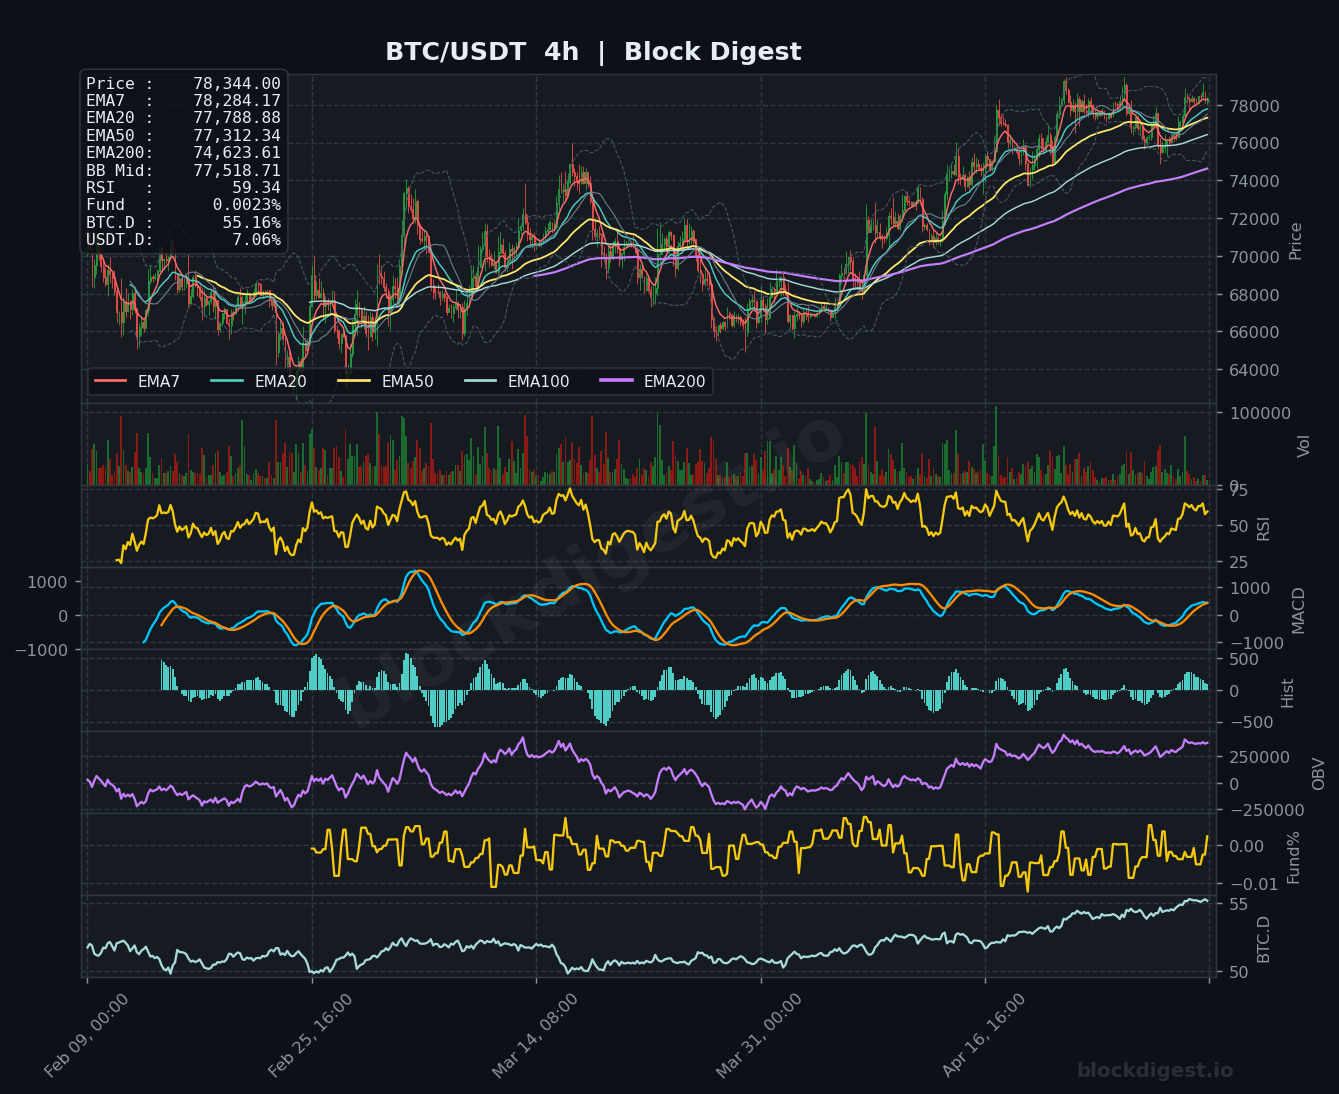
Cross-timeframe analysis reveals emerging bullish alignment with important caveats. The 1-hour chart shows price confidently above all EMAs with the fast-moving averages (EMA7 at $78,279 and EMA20 at $78,305) providing immediate support, while the 4-hour timeframe confirms this structure with price trading above the EMA50 at $77,312. However, the daily timeframe presents resistance ahead, with price still navigating below the EMA50 at $74,169 on that chart—though this appears to be outdated given current price action, suggesting a recent breakout attempt. The key confluence zone emerges between $77,300-$77,500, where the 4-hour EMA50 and daily EMA20 converge, representing the critical support level that must hold to maintain bullish structure. The shorter timeframes are showing strength, but sustainable upside requires daily timeframe confirmation above $80,000.
Key Levels to Watch
Resistance:
- $80,000 – Major psychological level and approximate location of prior consolidation resistance; daily close above this level would signal trend continuation
- $82,259 – Daily EMA200, representing the most significant resistance overhead and the dividing line between recovery and renewed uptrend
- $78,500-$78,800 – Immediate resistance cluster where price has recently faced rejection, coinciding with upper Bollinger Band on multiple timeframes
Support:
- $77,300-$77,500 – Critical support confluence zone featuring 4-hour EMA50 and multiple timeframe alignment; breakdown below invalidates near-term bullish structure
- $76,250 – Daily EMA20 support level and previous consolidation floor, representing secondary defense
- $74,170 – Daily EMA50 and major structural support; loss of this level would signal deeper corrective phase
Momentum & On-Chain Signals
Momentum indicators present mixed signals requiring careful interpretation. The 1-hour RSI at 53.04 shows neutral-to-bullish positioning with room for upside before overbought conditions, while the 4-hour RSI at 59.34 suggests strengthening momentum without extreme readings. The daily RSI at 60.92 indicates building bullish momentum but approaching levels where prior rejections occurred. MACD on the 1-hour and 4-hour charts shows bullish crossovers with positive histogram expansion, confirming short-term momentum favors buyers. The OBV trajectory shows gradual accumulation across all timeframes, particularly notable on the daily chart where volume is trending higher, suggesting institutional participation. Funding rates at 0.0023% (1-hour) and 0.0023% (4-hour) remain neutral-to-slightly-positive, indicating balanced positioning without excessive leverage on either side—a healthy condition for sustainable moves.
BTC Dominance & Market Sentiment
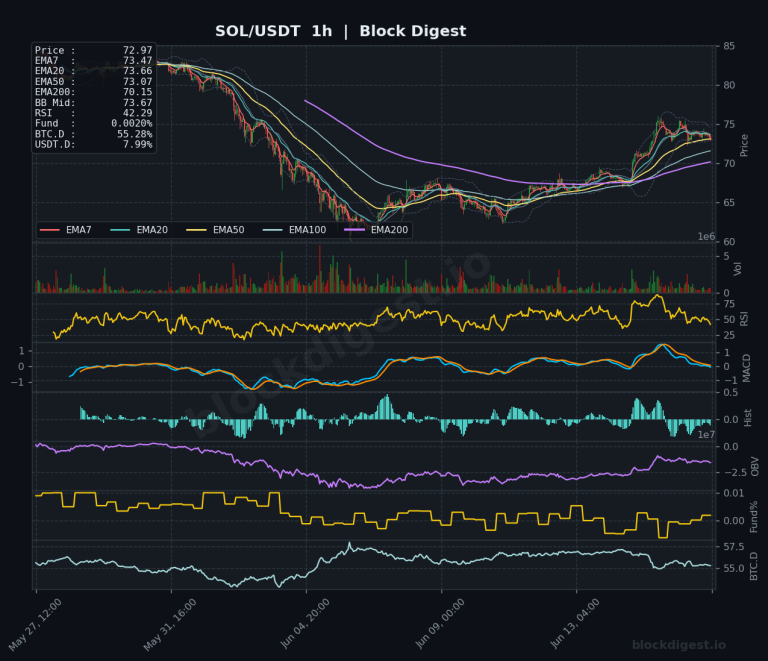
BTC.D currently sits at 55.16%, reflecting moderate Bitcoin dominance that has been gradually trending higher on the daily chart. This level suggests capital is flowing toward Bitcoin relative to altcoins, typically indicating risk-off sentiment within crypto markets or confidence in Bitcoin as the primary beneficiary of institutional flows. USDT.D at 7.06% shows relatively elevated stablecoin dominance, which traditionally signals cautious market positioning with significant dry powder on the sidelines. The combination of rising BTC.D and elevated USDT.D suggests a defensive market posture where investors favor Bitcoin over altcoins but maintain substantial cash reserves, potentially positioning for either breakout participation or protection against downside volatility.
Risk Scenarios
Bullish case: A decisive 4-hour close above $78,800 with sustained momentum and RSI holding above 55 would likely trigger continuation toward the $80,000 psychological barrier, with a daily close above that level opening the path to test the EMA200 at $82,259. Confirmation would require OBV expansion and funding rates remaining neutral-to-positive.
Bearish case: Failure to hold the $77,300 support confluence, particularly on 4-hour closing basis, would signal rejection of the current breakout attempt and likely trigger retests of $76,250 and potentially $74,170. A daily close below the EMA20 accompanied by negative MACD divergence would confirm renewed corrective pressure toward the $72,000-$73,000 zone.
Outlook
Bitcoin maintains a cautiously constructive setup as it consolidates near multi-week highs with technical structure favoring bulls on shorter timeframes while awaiting daily confirmation. The critical test lies immediately ahead at the $78,800-$80,000 resistance band, where price action over the next 24-48 hours will determine whether this represents a genuine breakout or another failed rally attempt. Key triggers include a sustained 4-hour close above $78,800 with expanding volume (bullish) or rejection back below $77,500 (bearish). The $77,300-$77,500 support zone represents the line in the sand—holding this level keeps the bull case intact, while loss of it would necessitate reassessment. With neutral funding, healthy OBV, and improving momentum indicators, the path of least resistance appears modestly higher, but traders should remain disciplined given proximity to significant resistance and the requirement for daily timeframe confirmation to validate any sustainable uptrend resumption.
Disclaimer: This analysis is for informational purposes only and does not constitute financial advice. Cryptocurrency markets are highly volatile and unpredictable. All trading decisions should be made based on your own research and risk tolerance. Block Digest is not responsible for any financial losses incurred as a result of acting on this content.