Altcoin Daily Analysis: Altcoins Under Pressure as Bitcoin Dominance Rises
Market Context
The broader altcoin market is under moderate pressure as the global crypto market cap shed approximately 2% over the past 24 hours to $2.15T. Bitcoin dominance sits at 54.98%, reflecting a measured but persistent BTC-favoring environment that continues to compress altcoin performance relative to cycle highs. USDT dominance at 8.01% remains elevated, signaling that a meaningful portion of capital remains parked on the sidelines and risk appetite has yet to fully recover — a headwind for sustained altcoin rallies.
Solana (SOL)
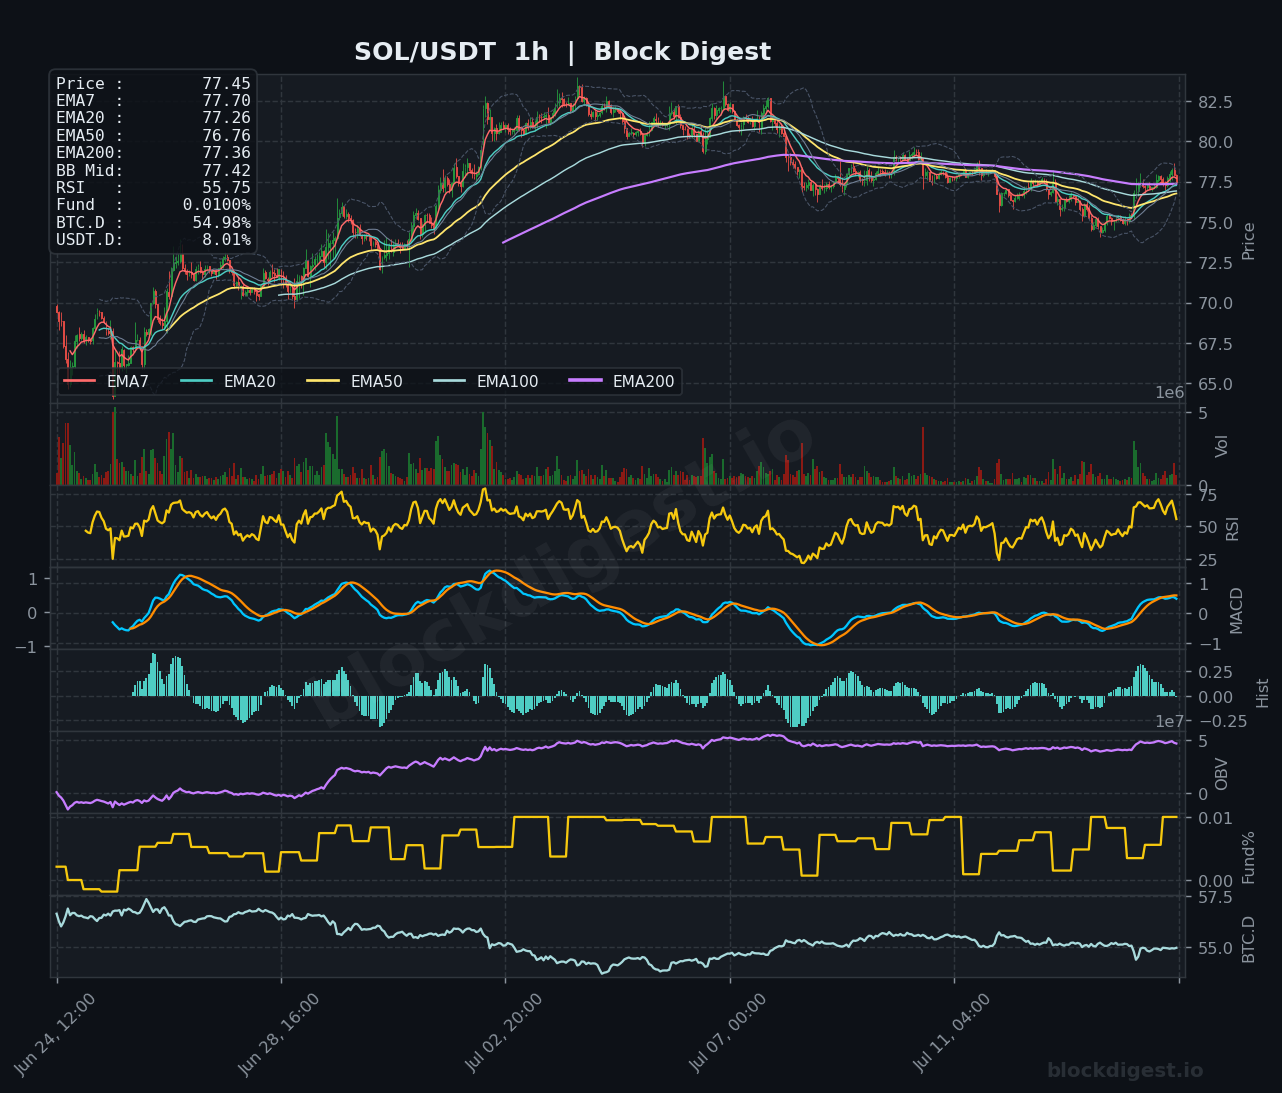
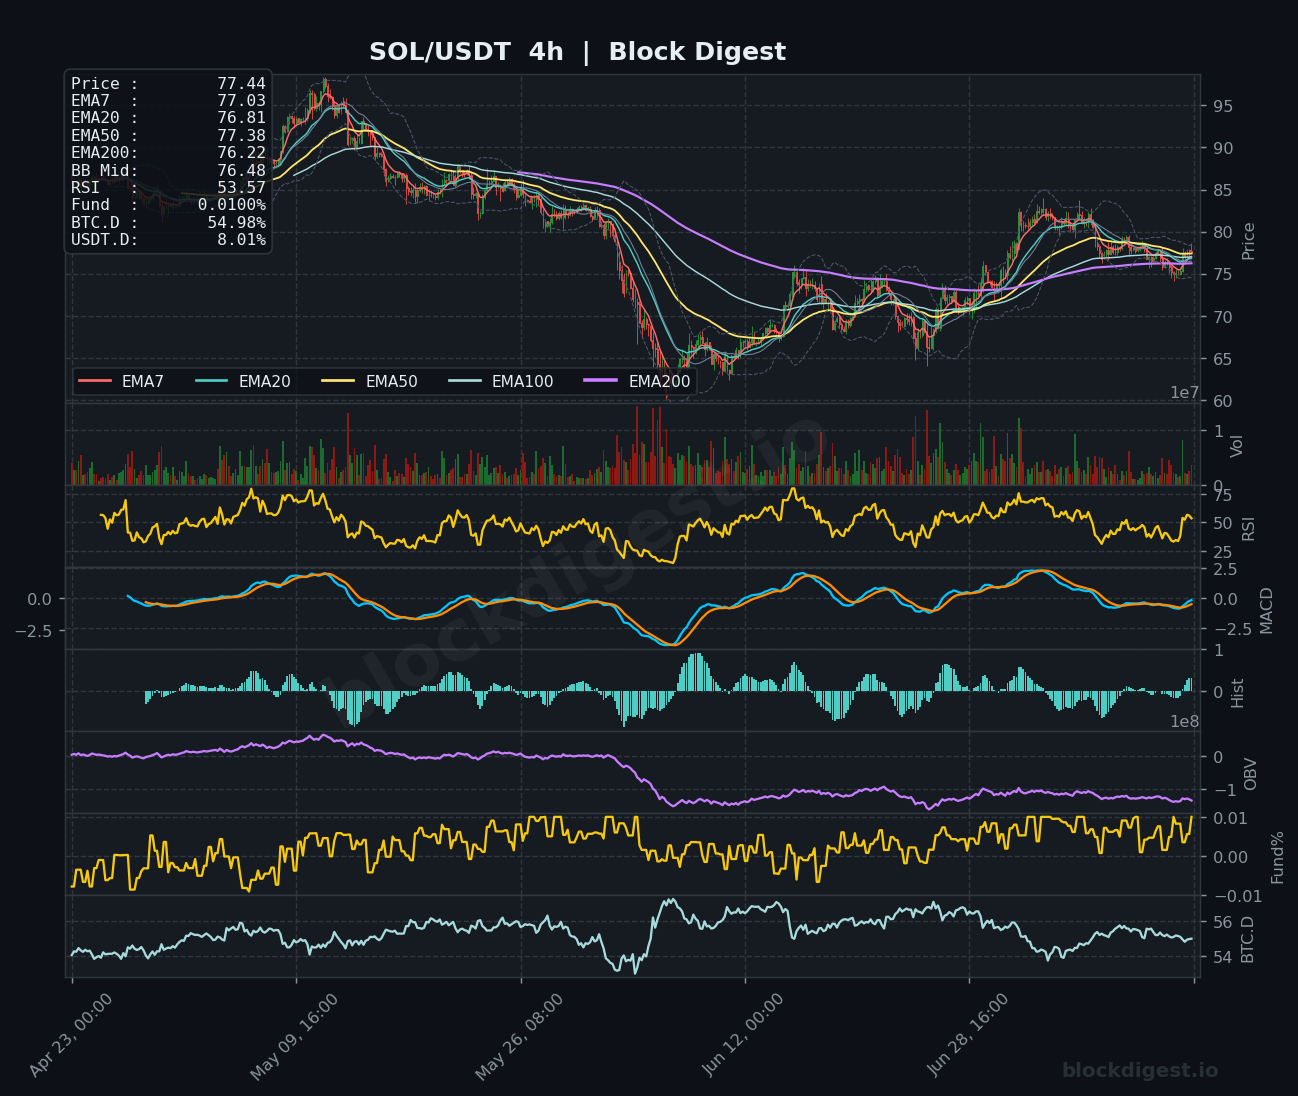
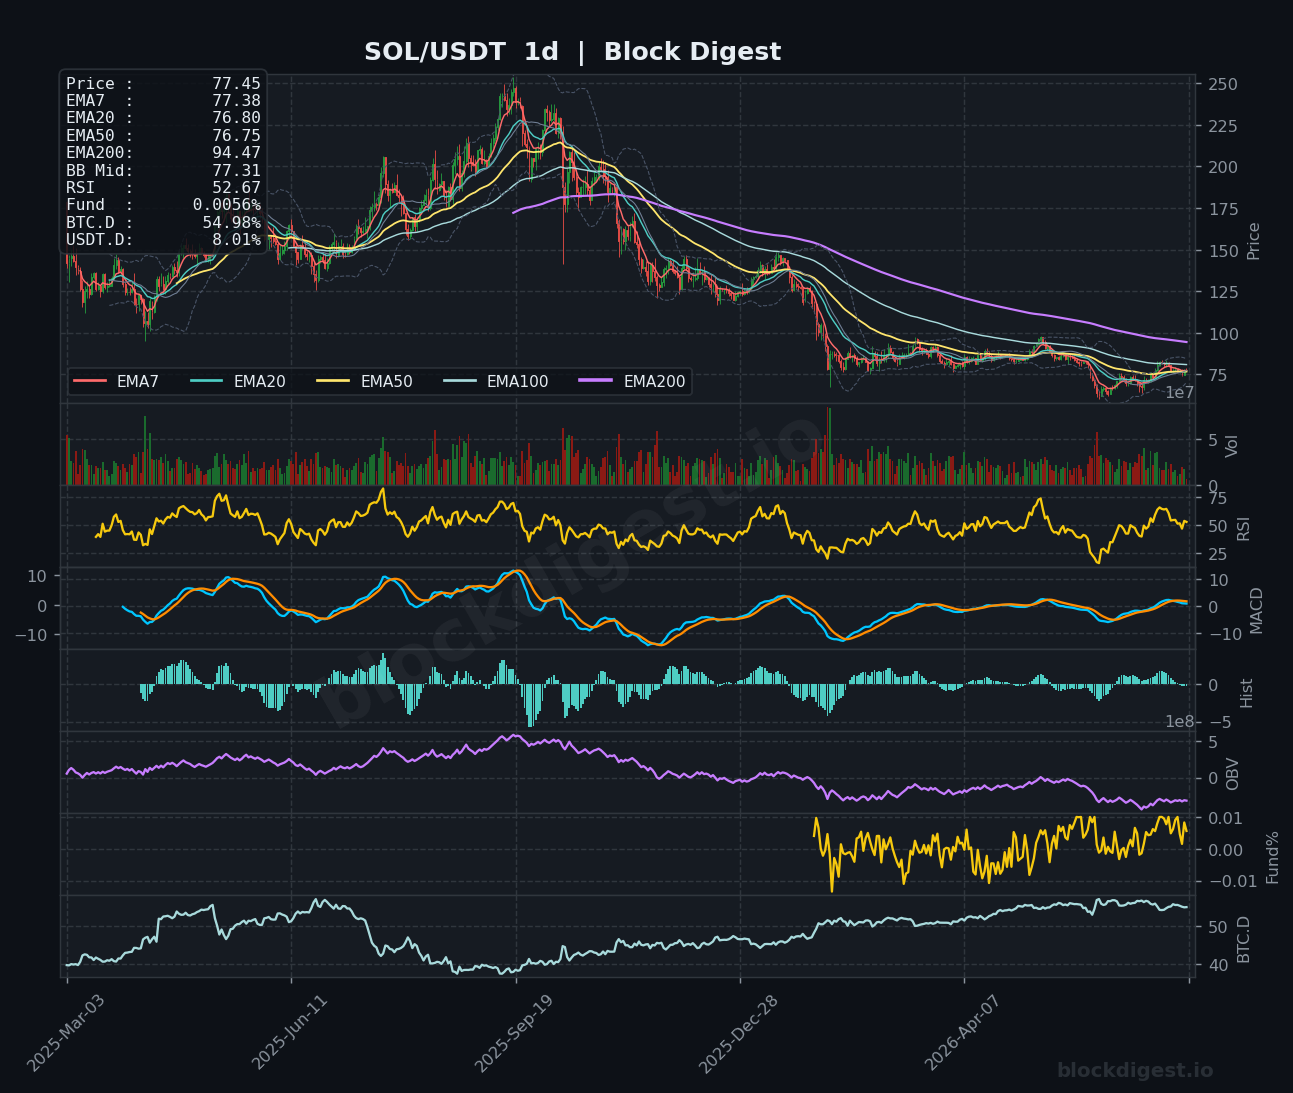
SOL trades around $77.45, currently coiled tightly around its short-term EMAs (EMA7 at $77.70, EMA20 at $77.26) with price sitting just above the Bollinger Band midline at $77.42 — a structurally neutral but slightly constructive posture on the 1h chart. The 1h RSI at 55.75 and a recovering MACD histogram suggest short-term bullish momentum is building after a recent pullback, while the OBV trend remains broadly positive over the near-term window. On the 4h, however, price is still fighting resistance from the EMA50 ($77.38) and remains well below the EMA200 ($76.22 flattening up), with the RSI at 53.57 confirming only tepid momentum recovery from the early July lows near $65. The daily chart tells the most cautionary tale — SOL is deeply beneath its EMA200 ($94.47), RSI sits at a lukewarm 52.67, and the MACD signal line remains near zero after a prolonged bearish stretch, keeping the macro bias neutral-to-bearish until a decisive close above $80 is achieved.
XRP (XRP)
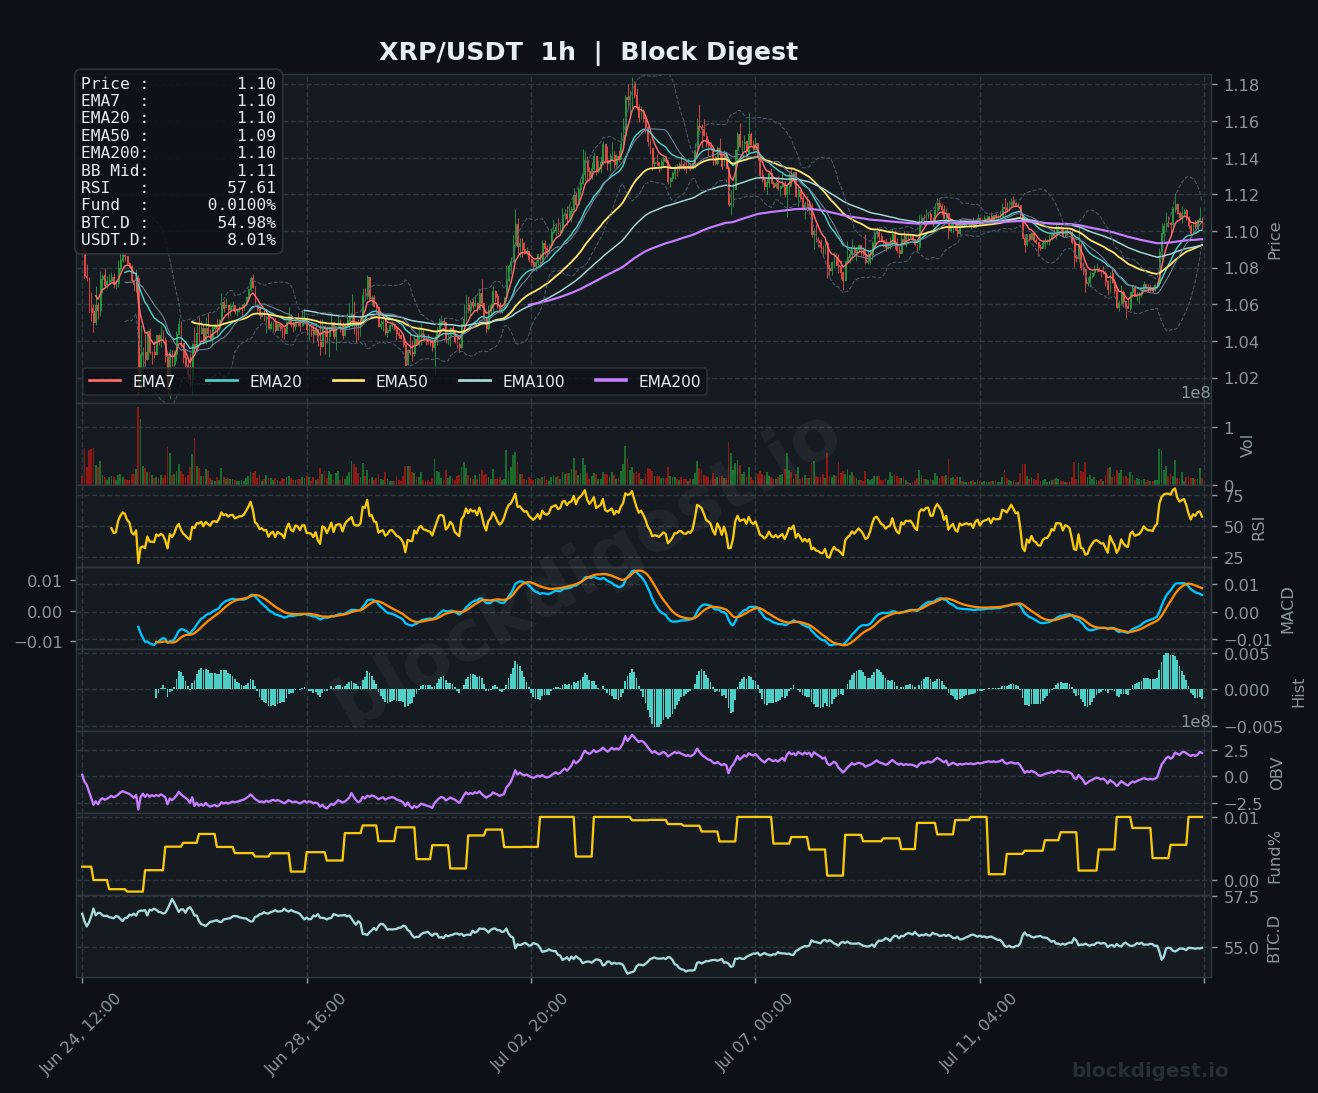
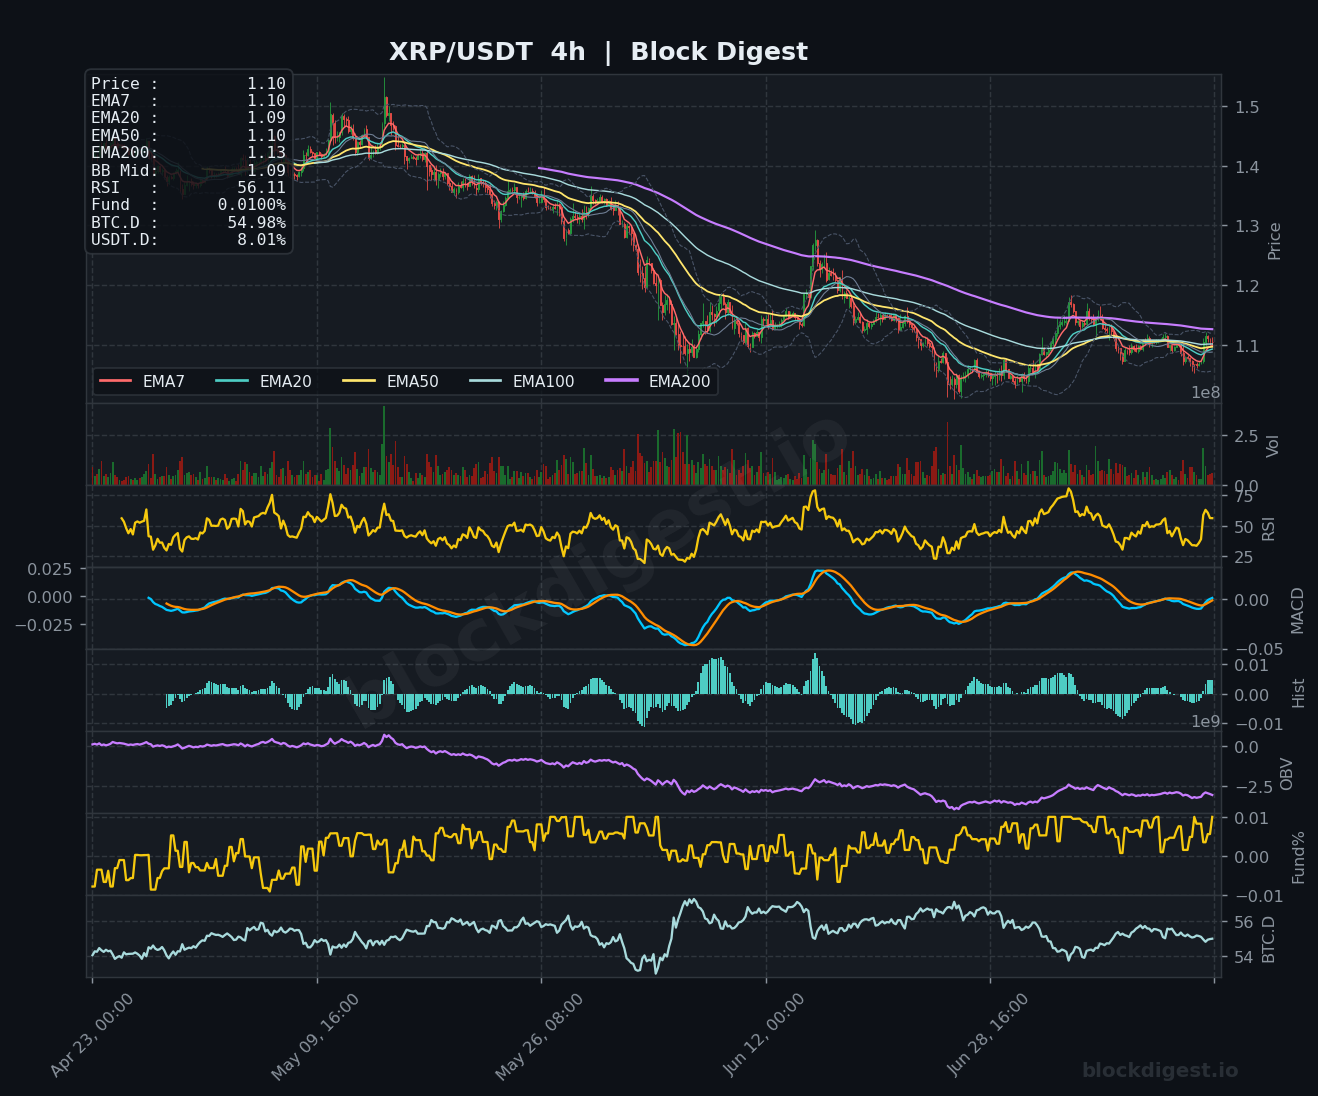
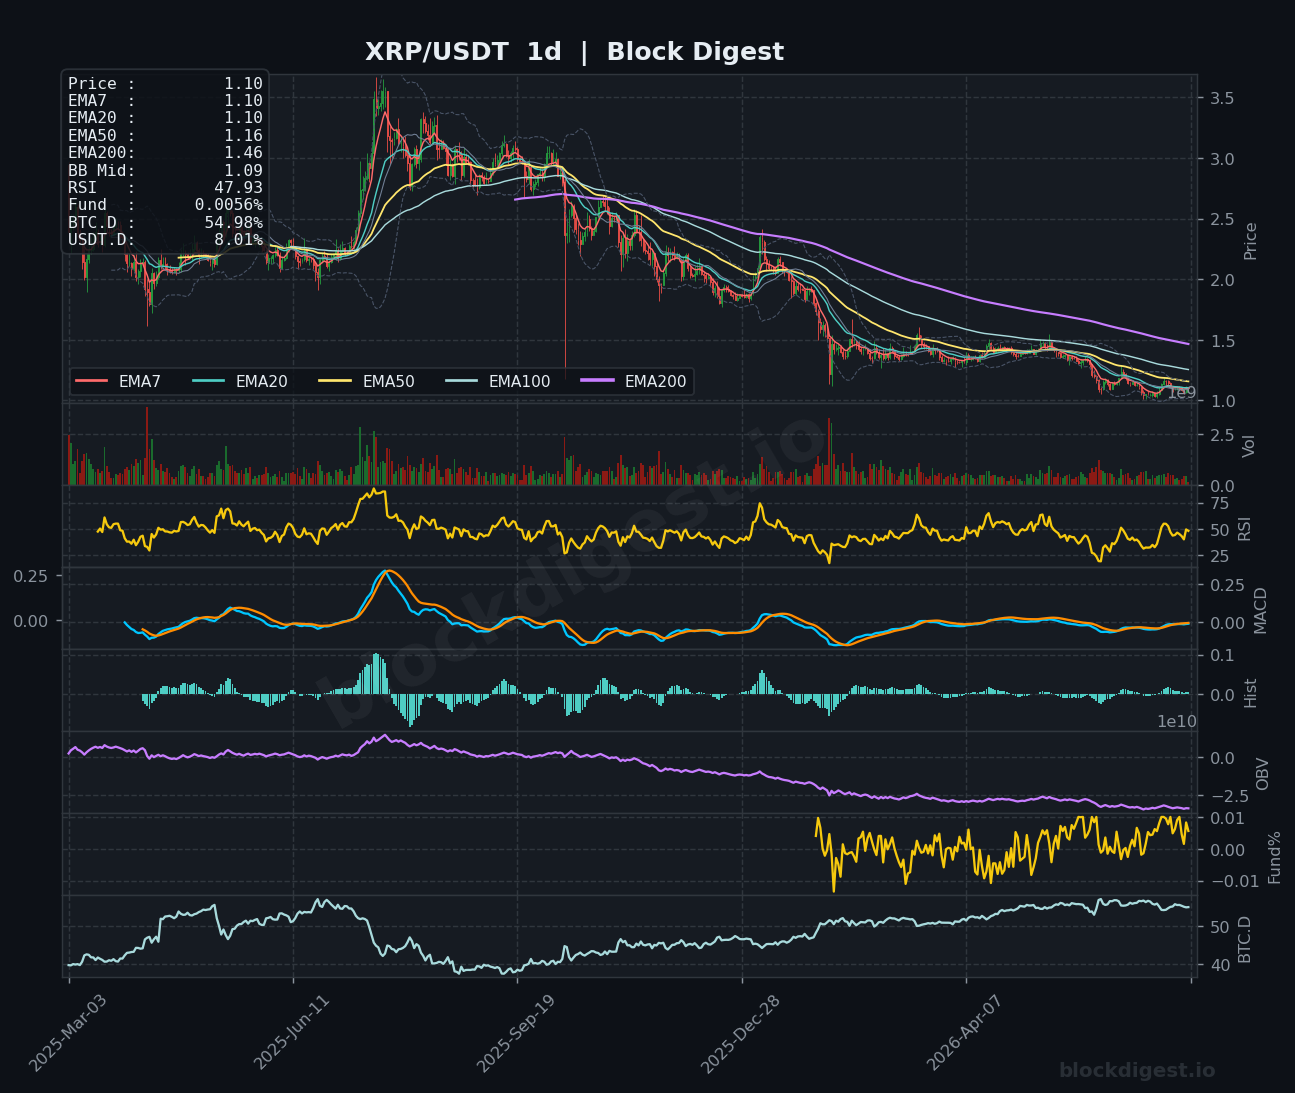
XRP is trading at $1.10, consolidating tightly with EMA7, EMA20, and EMA200 all converged at the same level — a textbook compression setup that typically precedes a directional break. The 1h RSI at 57.61 and a turning MACD histogram favor a near-term upside resolution, a reading supported by community bullishness and Ripple’s newly announced Premier Membership in the x402 Foundation alongside Visa and Mastercard, which adds a fundamental tailwind. On the 4h, the broader picture is less encouraging: price has been in a sustained downtrend from the $1.50+ range, and all EMAs are still stacked bearishly above current price, with RSI at 56.11 showing a modest recovery but no confirmation of trend reversal. The daily chart, where RSI sits at a concerning 47.93 and the EMA50 ($1.16) and EMA200 ($1.46) both overhang heavily, confirms that $1.10–$1.12 remains a key near-term resistance zone to watch, with $1.06–$1.07 as immediate support.
BNB (BNB)
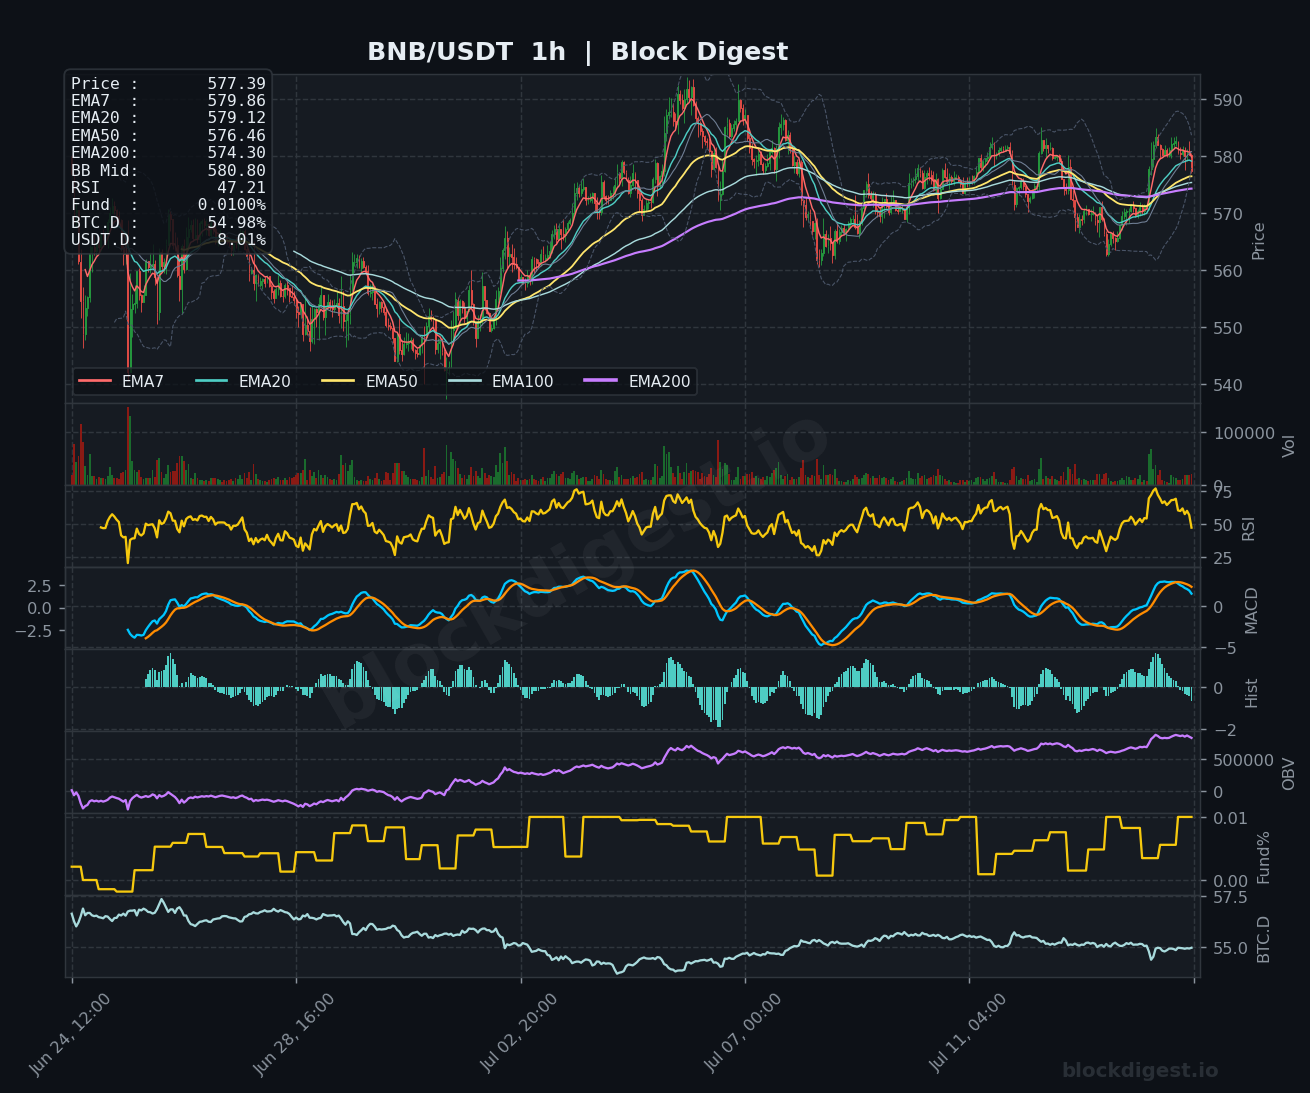
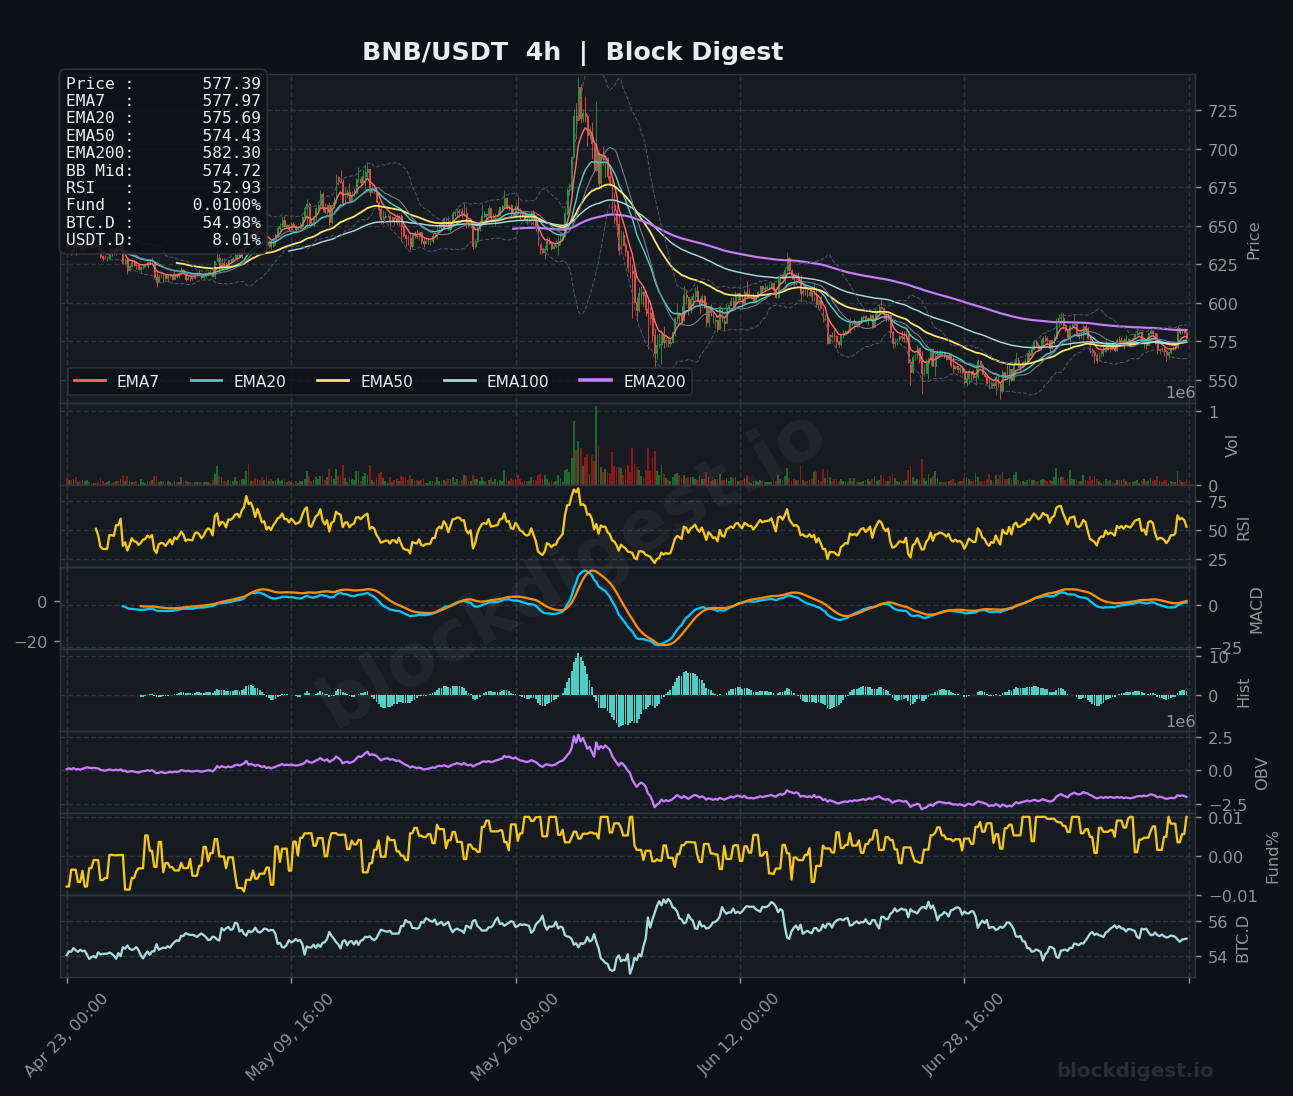
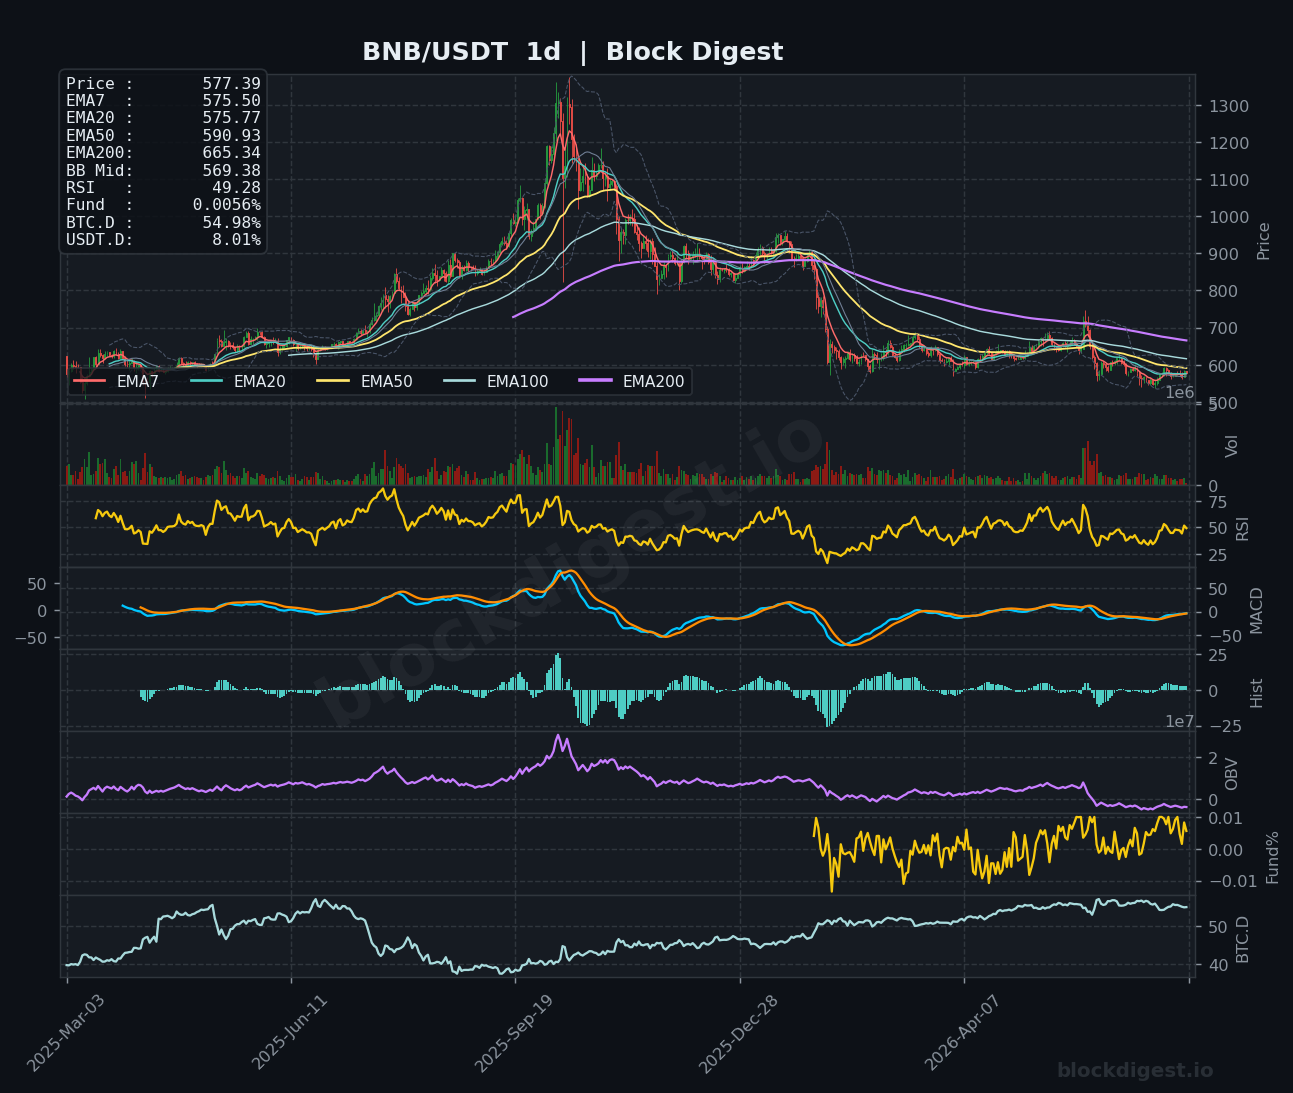
BNB is trading at $577.39, navigating a tight range between its 1h EMAs (EMA7 $579.86, EMA20 $579.12, EMA50 $576.46) with price sitting just below the Bollinger Band midline at $580.80. The 1h RSI at 47.21 and a MACD line recently curling back upward suggest a muted but modestly recovering momentum picture, though the community sentiment reads bearish today — a near-term caution flag. On the 4h timeframe, BNB shows a slow grind back toward the EMA200 ($582.30), having recovered from a significant drawdown; RSI at 52.93 is neutral, and the OBV has trended gently higher since the lows, indicating quiet accumulation. The daily chart remains structurally weak with the EMA50 ($590.93) and EMA200 ($665.34) both declining well above current price, and the daily RSI at 49.28 hovering just below the midpoint — a confirmed break above $585–$590 is needed to shift the medium-term bias from neutral to constructive.
Dogecoin (DOGE)
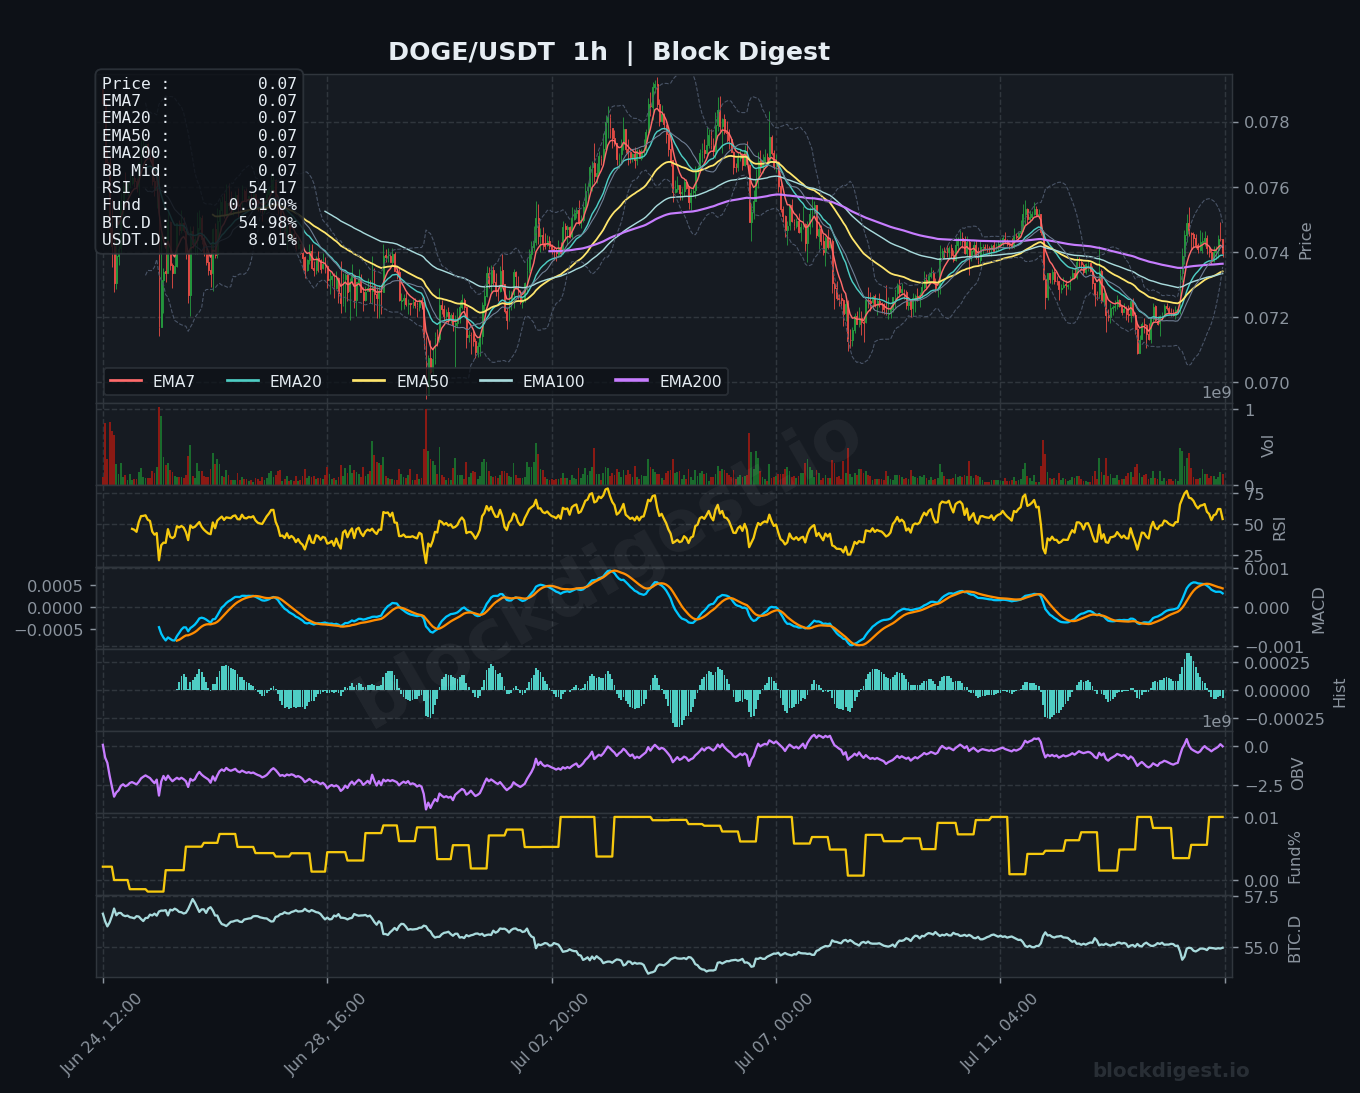
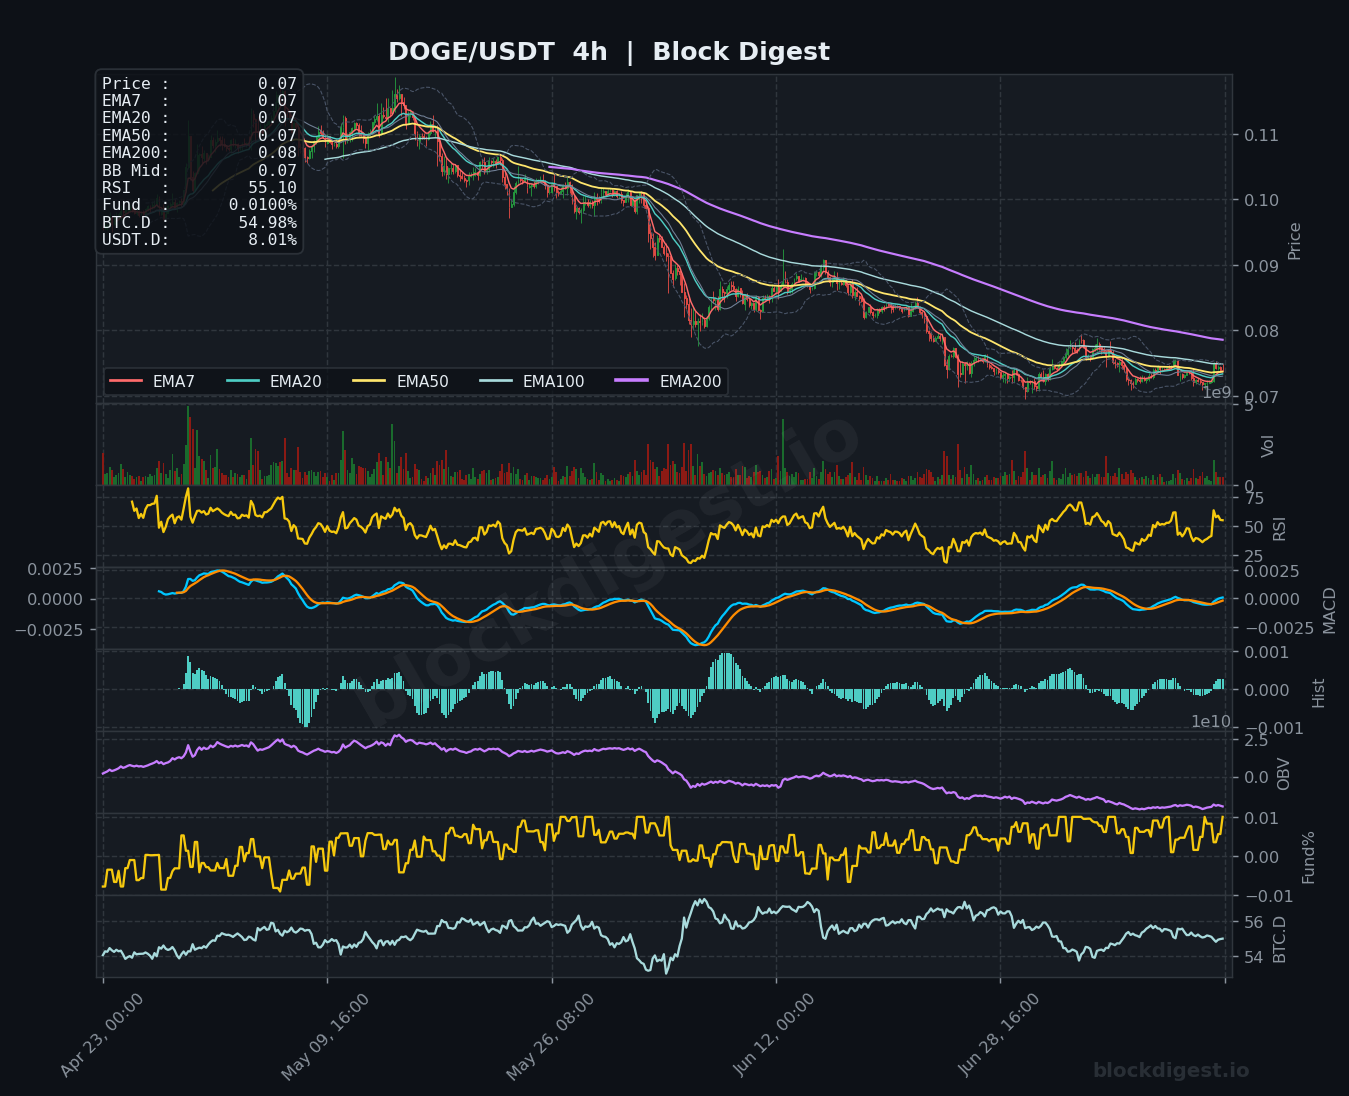
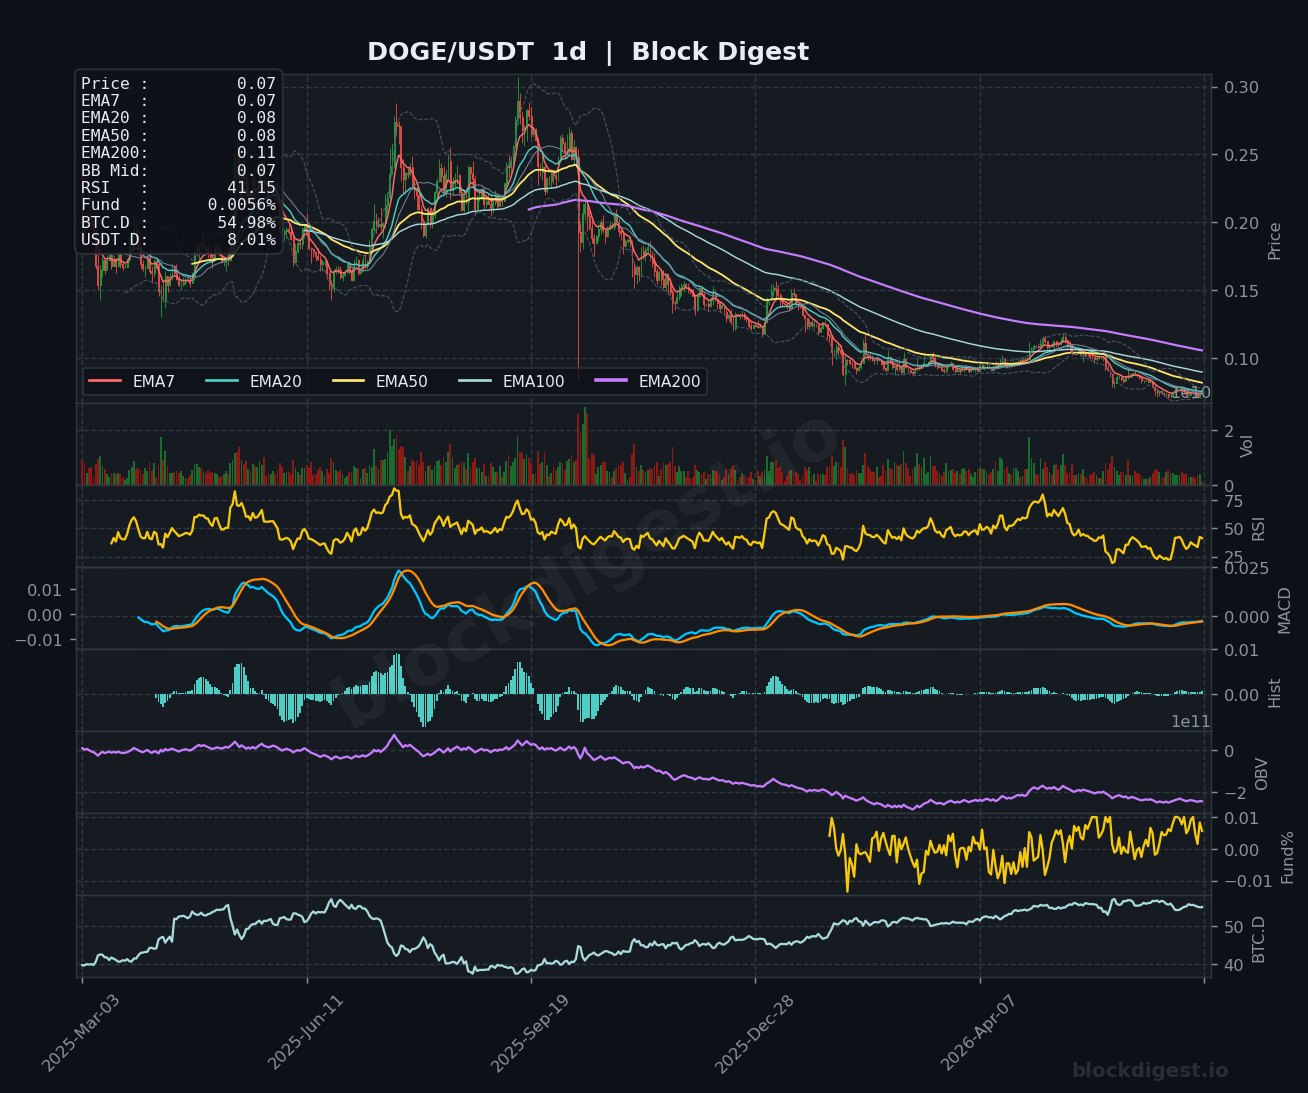
DOGE is trading at $0.0740, with all short-term EMAs compressed at $0.07 on the 1h chart, suggesting a low-volatility consolidation phase following the sharp pullback from the early July high near $0.079. The 1h RSI at 54.17 is mid-range and the MACD is turning modestly positive, indicating potential for a short-term bounce attempt toward the $0.075–$0.076 resistance cluster. On the 4h chart, the broader downtrend from the $0.11 range remains intact, with all EMAs still bearishly stacked; RSI at 55.10 reflects the bounce from recent lows but the OBV trend remains pressured downward over the medium term. The daily RSI at 41.15 is the most concerning reading in today’s set — approaching oversold territory while price sits well below the EMA50 ($0.08) and EMA200 ($0.11), keeping the macro bias firmly bearish and making DOGE one of the weaker setups in this cohort.
Litecoin (LTC)
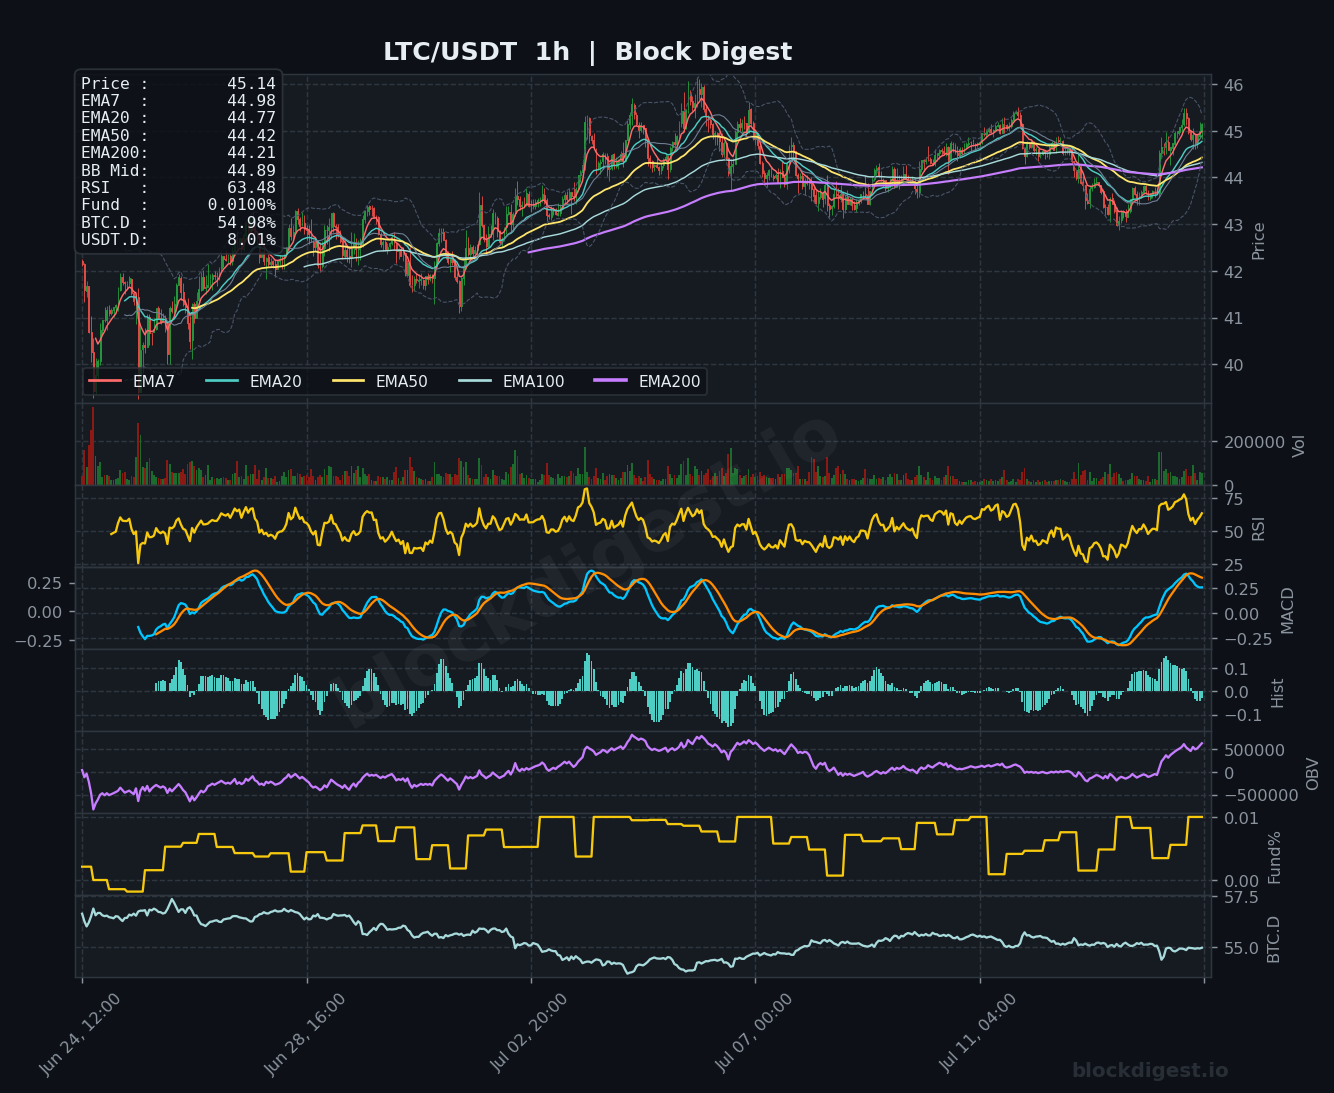
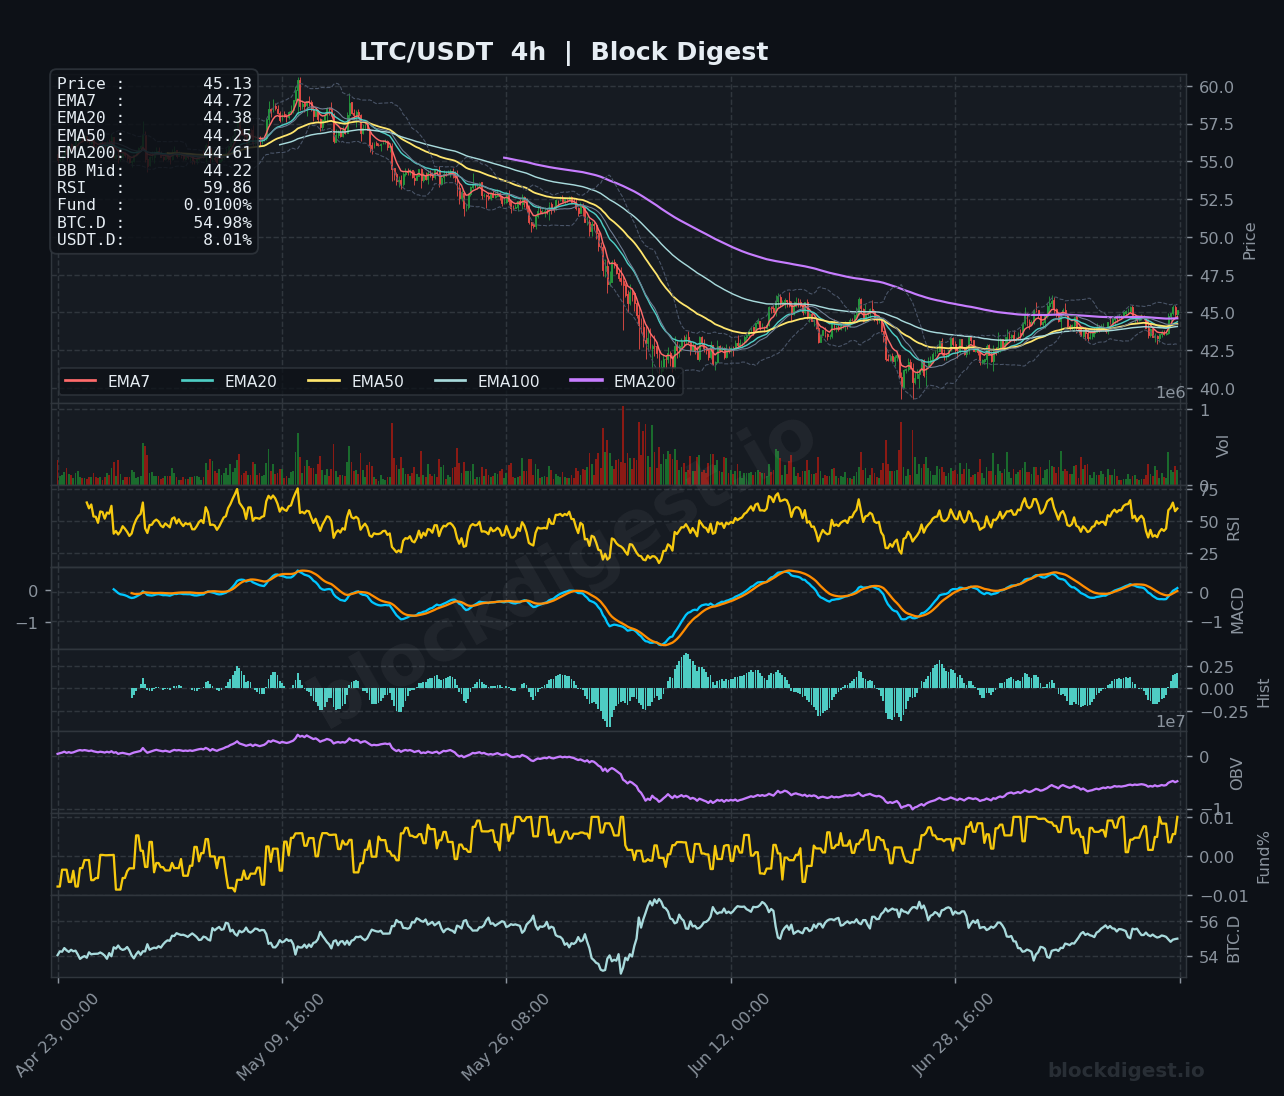
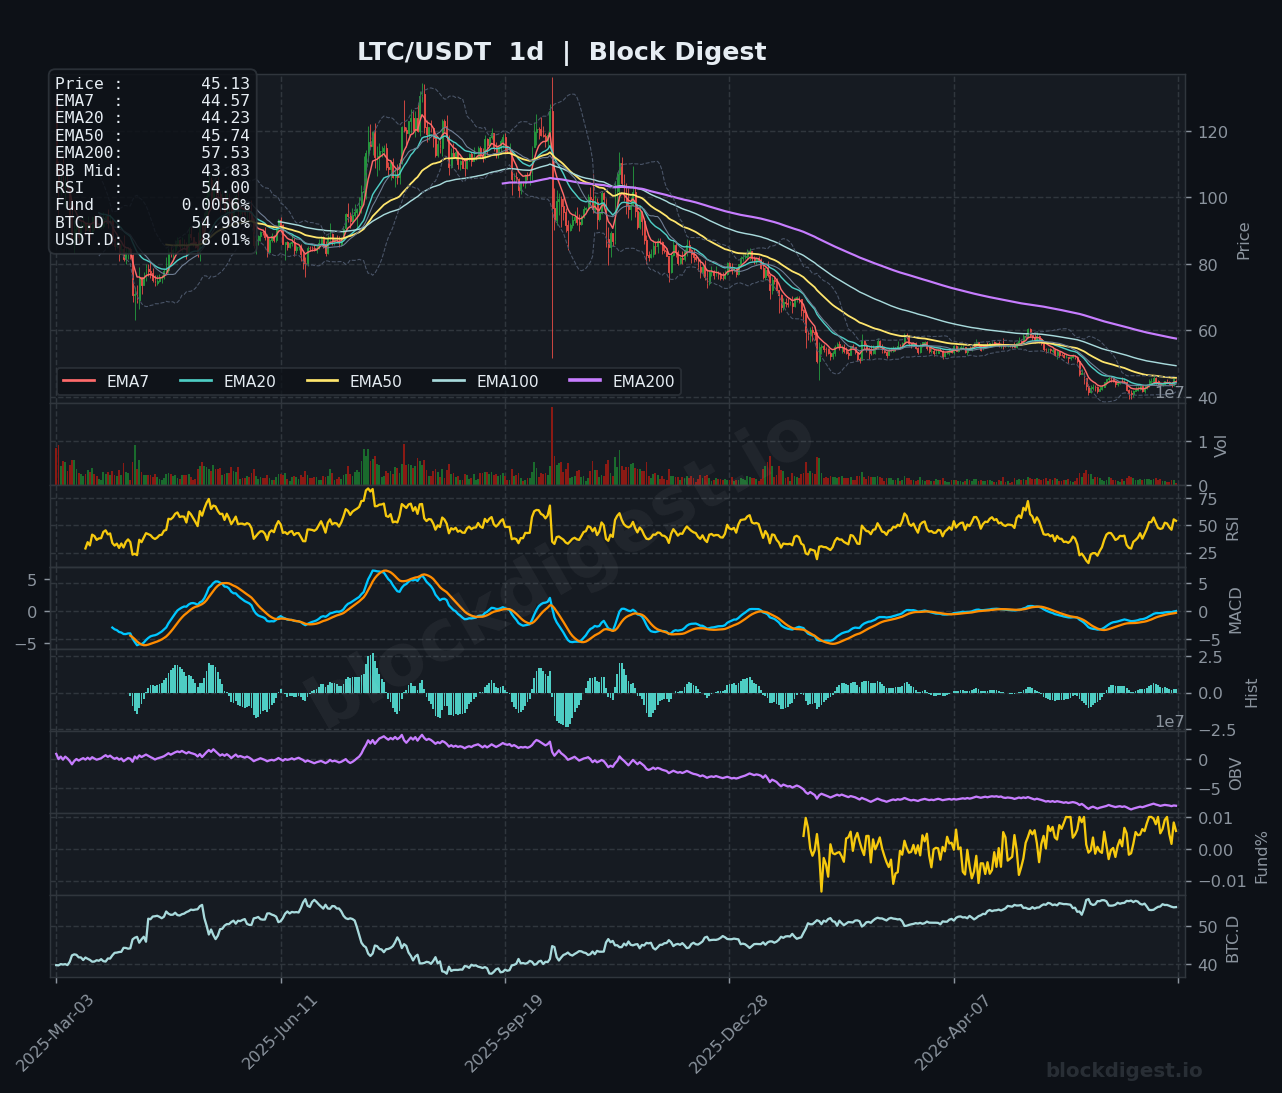
LTC stands out as arguably the most constructive setup in today’s roundup, trading at $45.14 with all short-term EMAs (EMA7 $44.98, EMA20 $44.77, EMA50 $44.42, EMA200 $44.21) aligned in a bullish sequential stack on the 1h chart. The 1h RSI is elevated at 63.48 and the MACD is trending clearly higher with a rising histogram, while OBV shows a sustained uptrend throughout the recent period — all pointing to genuine buying pressure. The 4h chart confirms this near-term strength with RSI at 59.86 and price reclaiming all key short-term EMAs, though the broader context on the daily shows LTC still sits beneath the EMA50 ($45.74), meaning that level is the immediate test for whether this recovery can extend into a more meaningful trend reversal. A sustained hold above $45.00 with volume confirmation would open the path toward the $47–$48 resistance zone.
TRON (TRX)
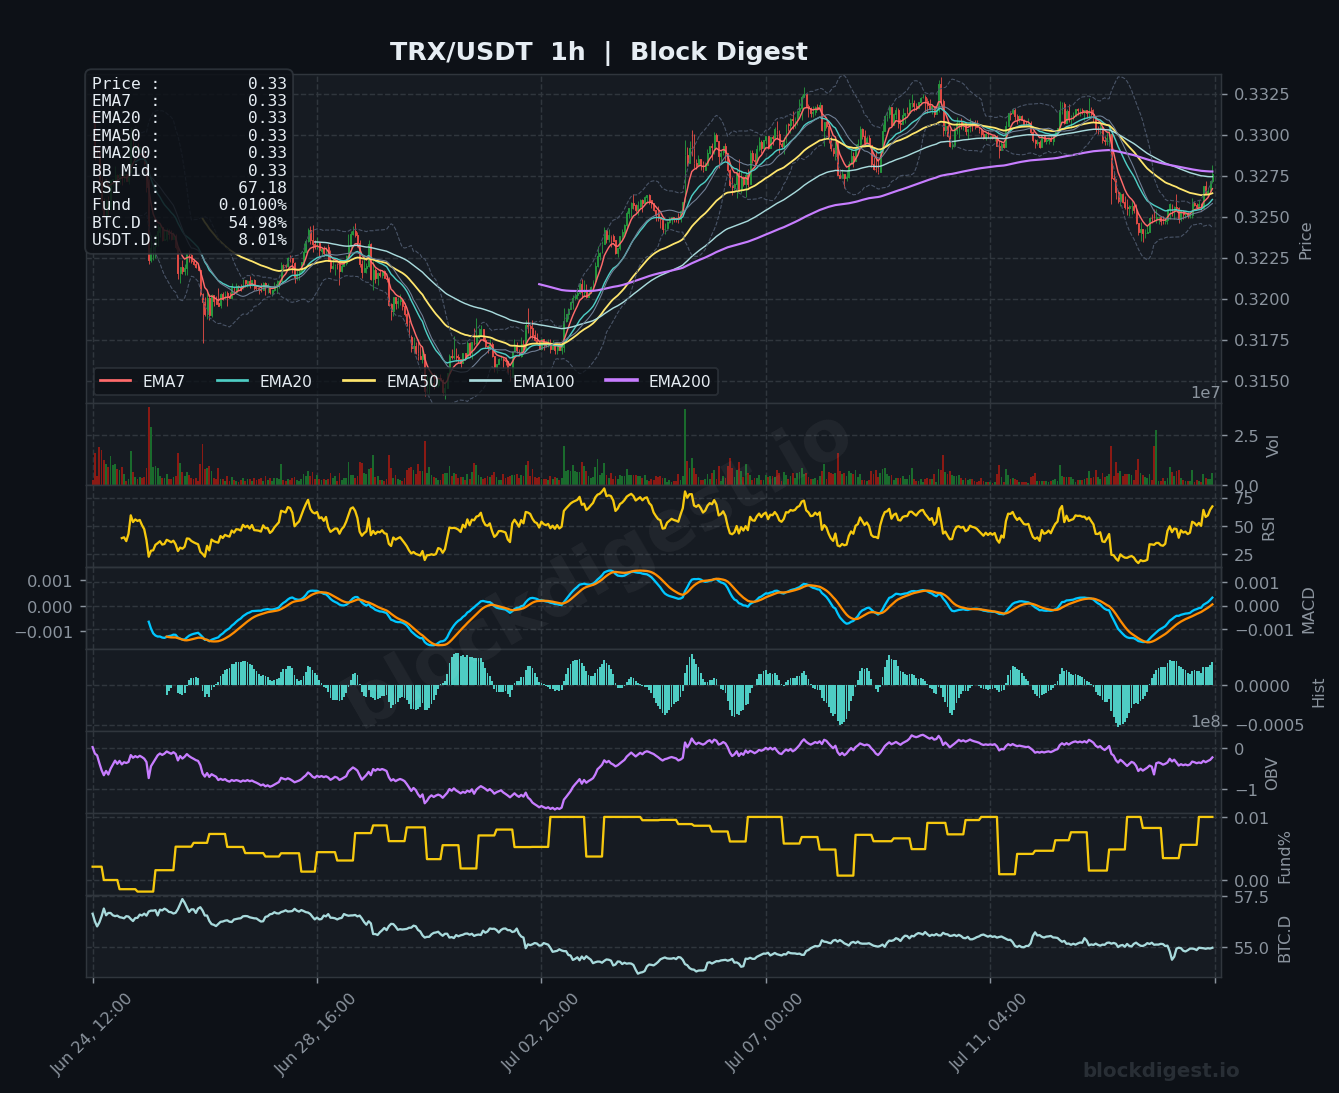
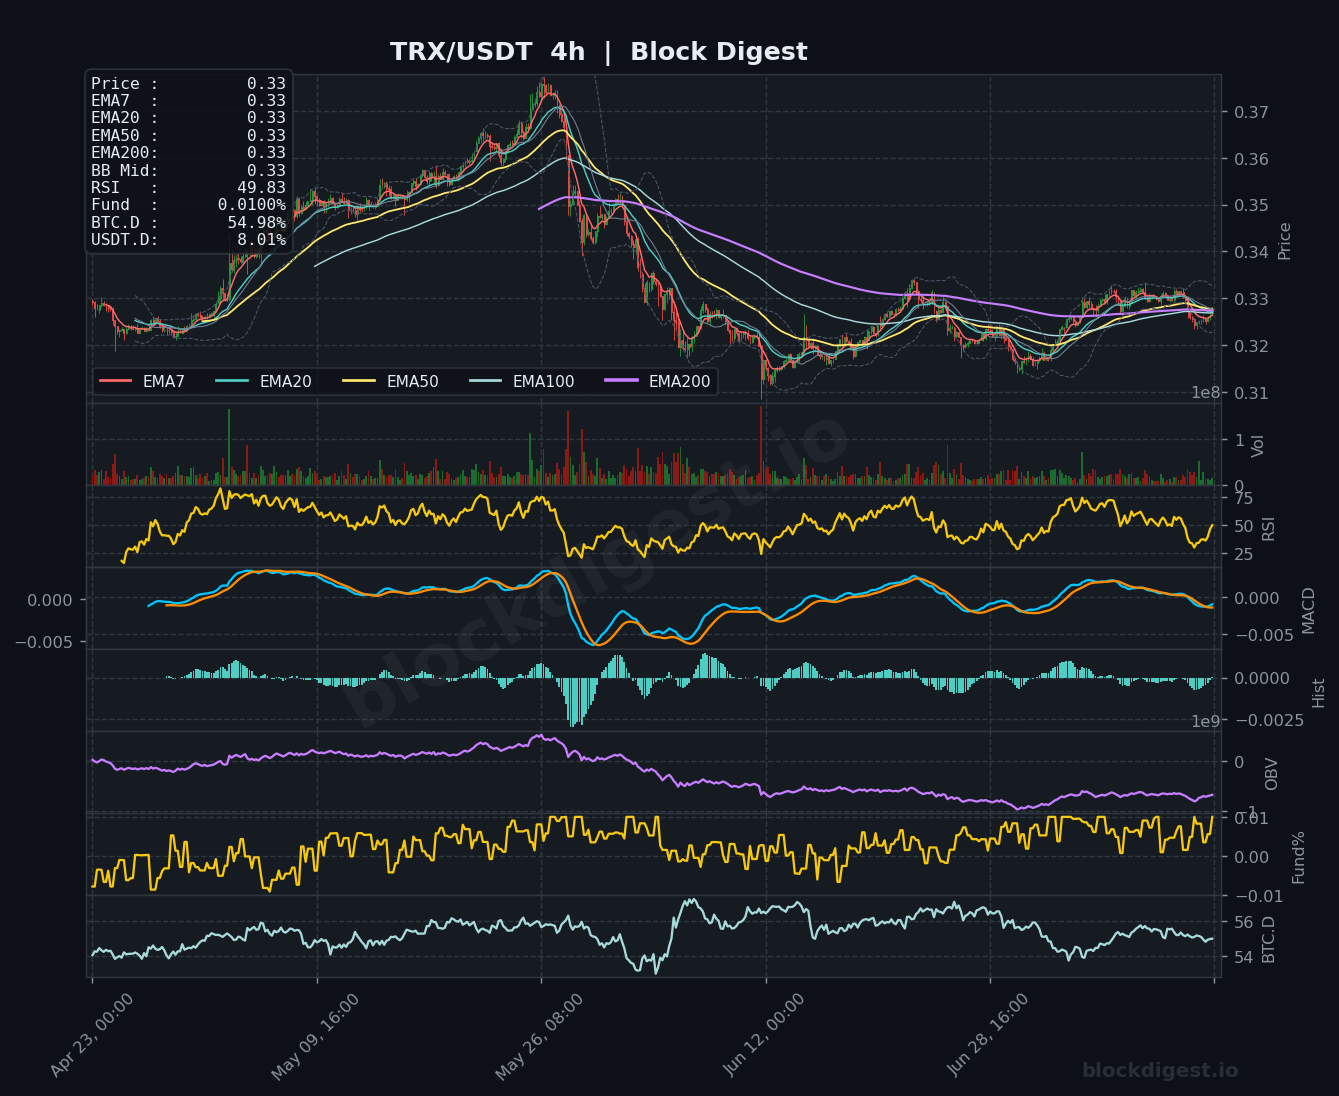
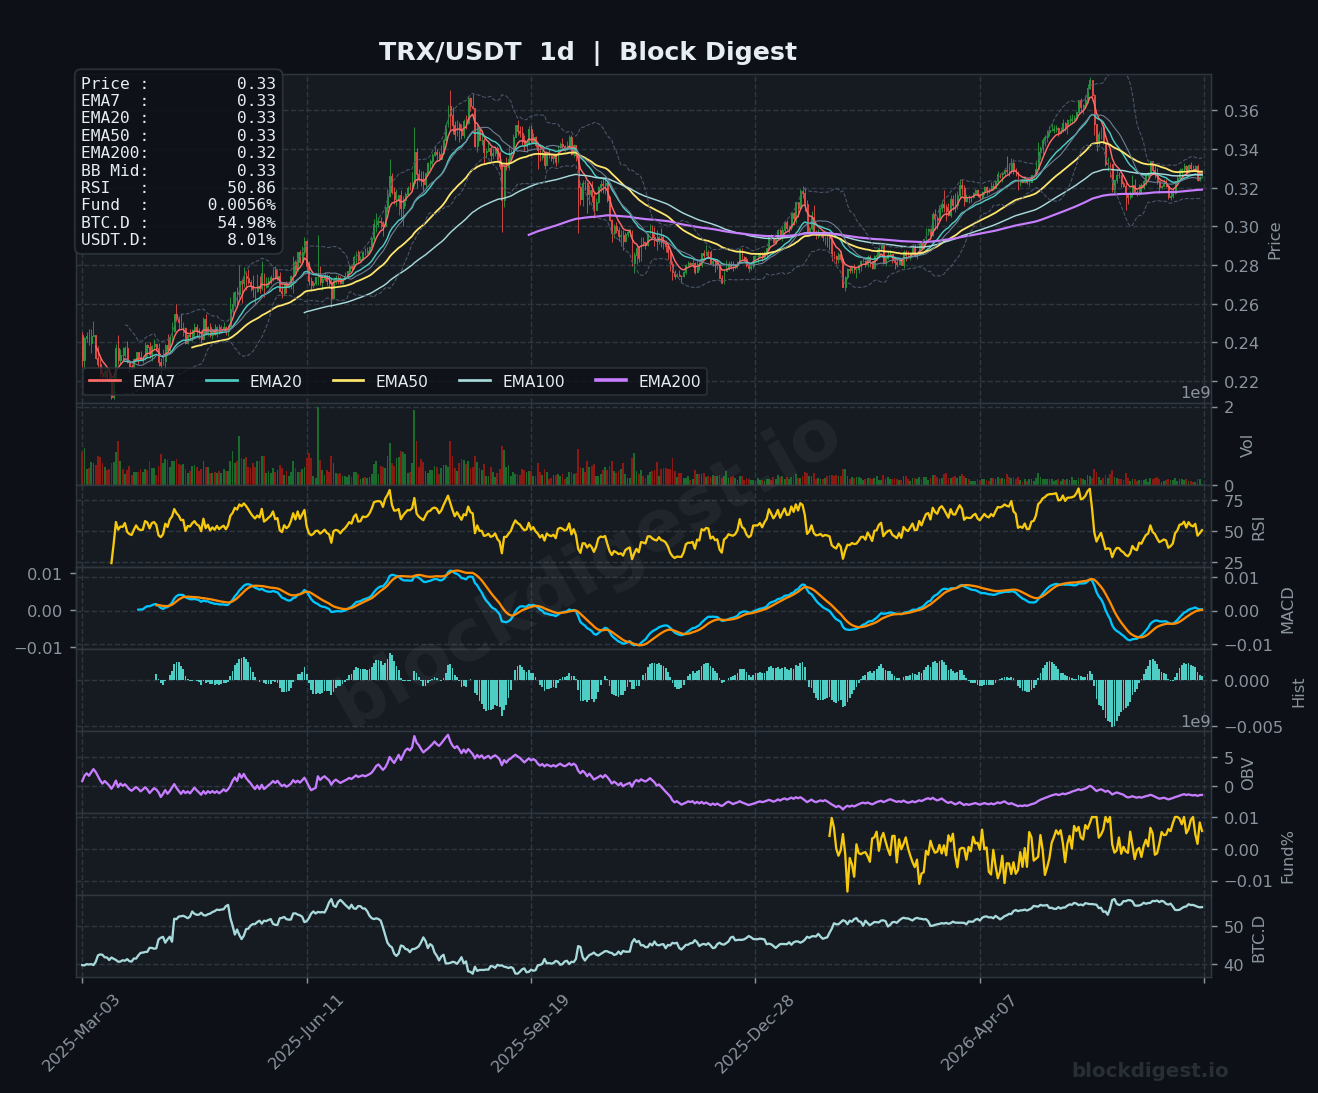
TRX is trading at $0.3275, holding near the top of its recent consolidation range with the 1h RSI at a notably strong 67.18 — the highest momentum reading among today’s featured assets. All EMAs are tightly clustered around $0.33 on the 1h chart and the MACD is in positive territory with a bullish crossover holding, suggesting near-term upward pressure remains intact. On the 4h timeframe, the RSI at 49.83 paints a more neutral picture as price consolidates after failing to sustain the push toward $0.35, with the EMA stack beginning to flatten; the OBV has been gradually recovering from prior lows, however, which is encouraging. The daily chart is arguably the healthiest macro picture in this group — TRX trades above its EMA200 ($0.32), the daily RSI is holding at 50.86, and price has been consolidating tightly in the $0.32–$0.34 range, offering a relatively stable base compared to peers that are still in deep macro downtrends.
Altcoin Outlook
The overall altcoin setup as of July 15, 2026 is one of cautious consolidation rather than directional conviction, with the majority of assets still in macro downtrends relative to their cycle peaks and BTC dominance suppressing broad altcoin outperformance. LTC and TRX present the most technically constructive near-term setups — LTC for its clean short-term EMA alignment and strong momentum, TRX for its relative macro stability above the daily EMA200. XRP offers the most interesting near-term catalyst potential given the fundamental news flow and tight price compression, but needs a clean break above $1.12 to confirm bullish intent. The key conditions to watch across the board are a decisive move in USDT.D below 7.5% (which would signal genuine risk capital re-entering the market) and BTC dominance softening below 54%, either of which would materially improve the setup for a sustained altcoin rotation.
Disclaimer: This analysis is for informational purposes only and does not constitute financial advice. Cryptocurrency markets are highly volatile and unpredictable. All trading decisions should be made based on your own research and risk tolerance. Block Digest is not responsible for any financial losses incurred as a result of acting on this content.