
Market Overview
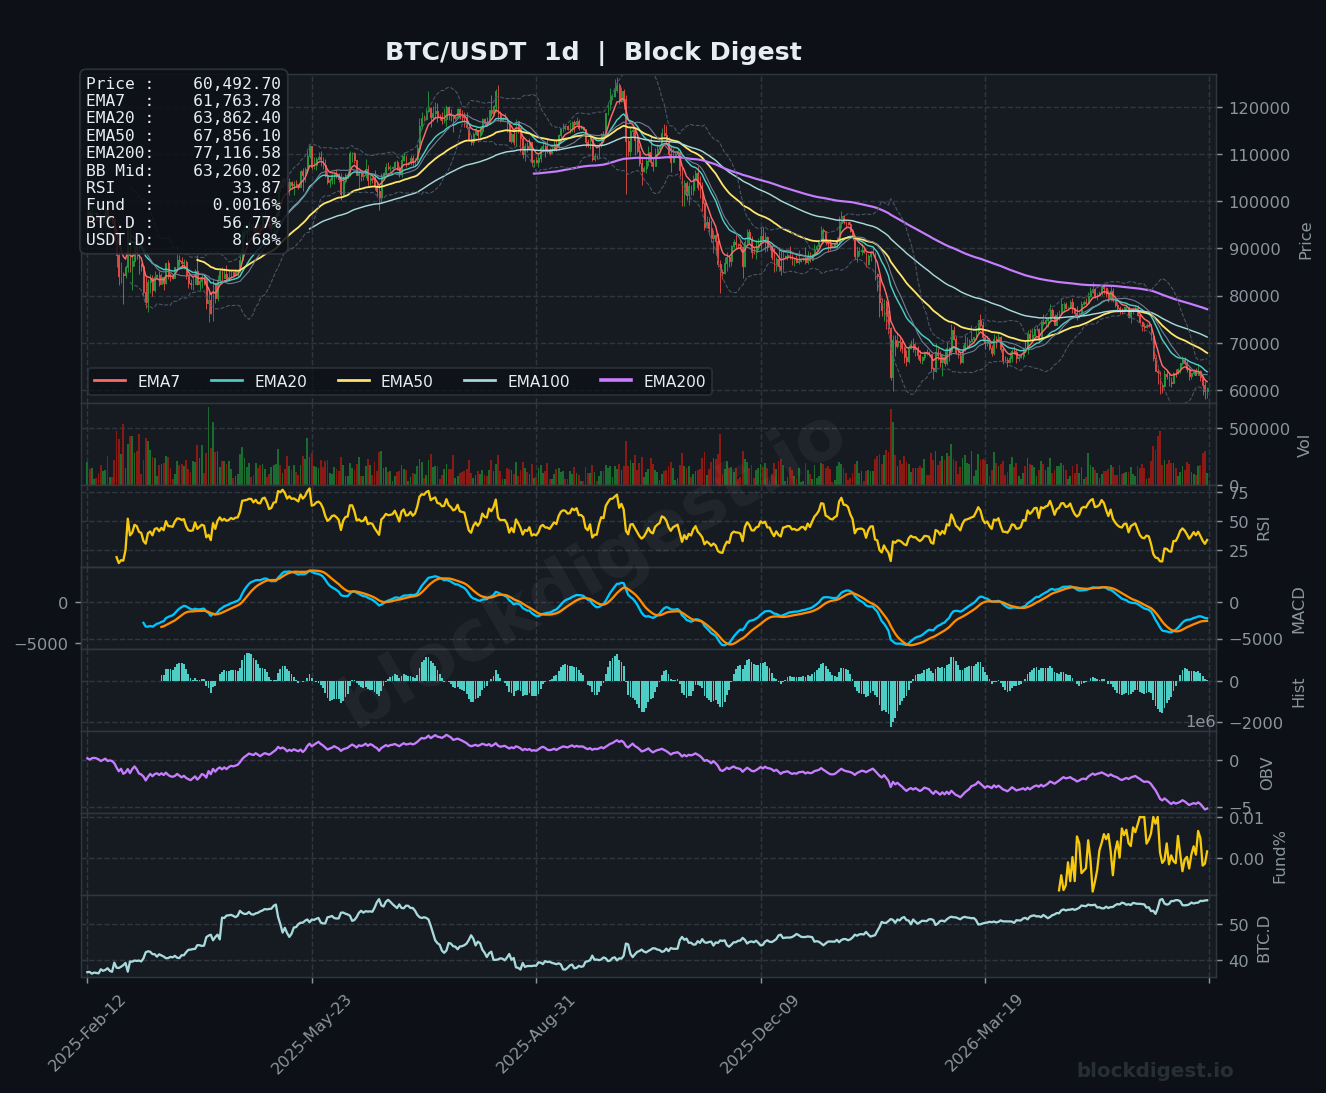
Bitcoin is currently trading at $60,492, facing sustained selling pressure that has pushed price well below all major EMAs on the daily timeframe. The dominant trend on the 1d chart remains firmly bearish, with price trading beneath the EMA7 ($61,763), EMA20 ($63,862), EMA50 ($67,856), and EMA200 ($77,116) — a fully stacked bearish EMA configuration that signals structural deterioration. Price is also trading below the daily Bollinger Band midline at $63,260, reinforcing downside momentum. The recent sharp decline has brought BTC to levels not seen since early in the current cycle leg, raising the stakes around the $60,000 psychological round number.
Multi-Timeframe Confluence
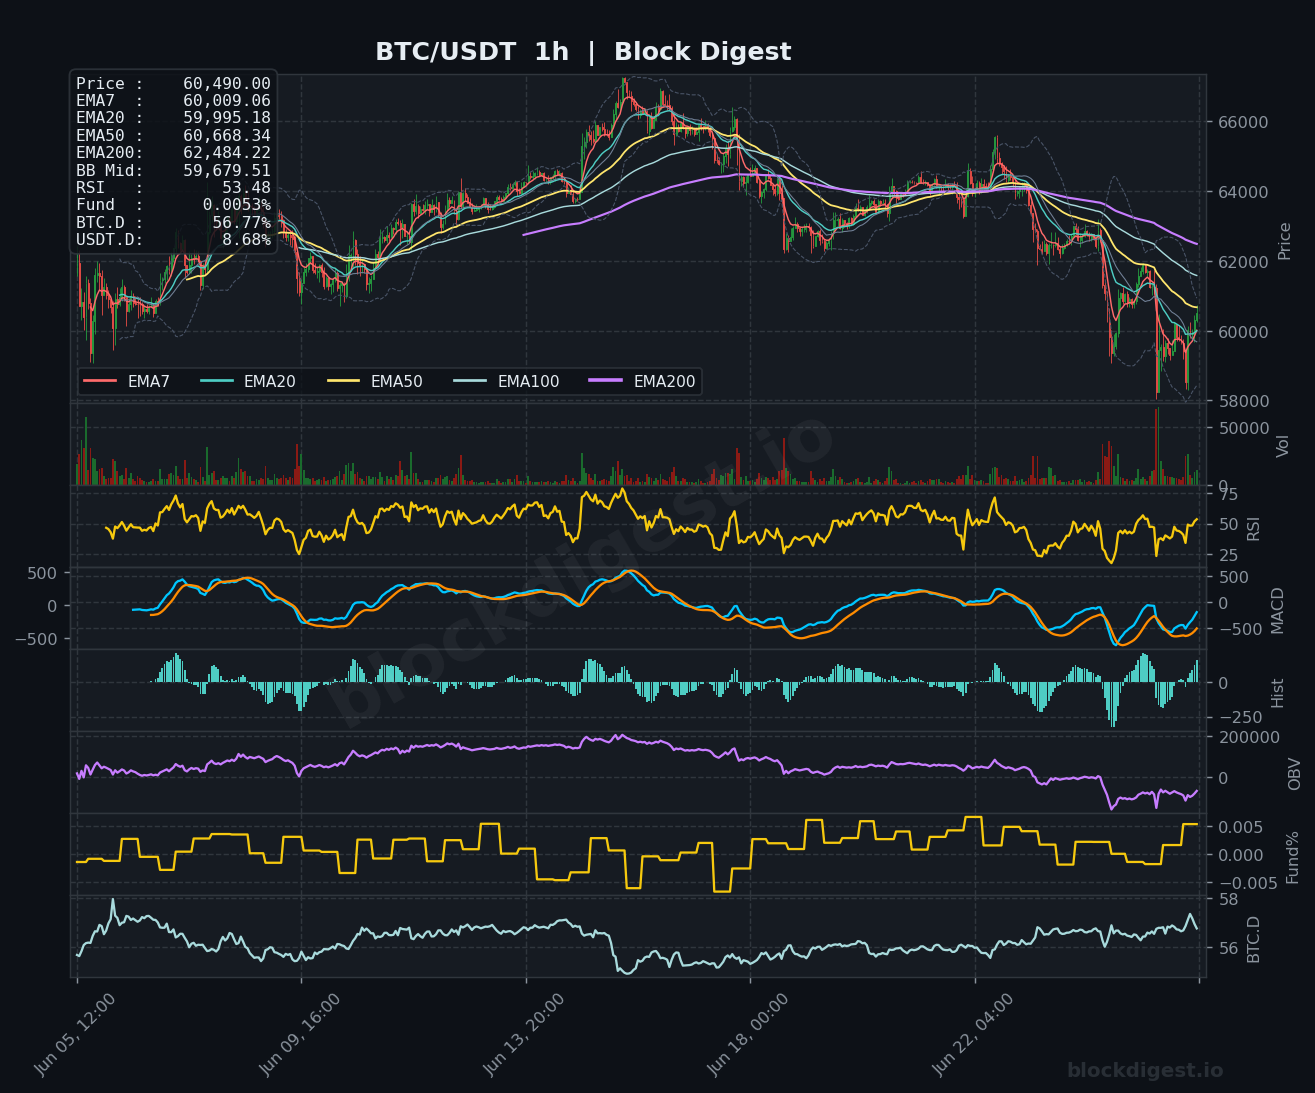
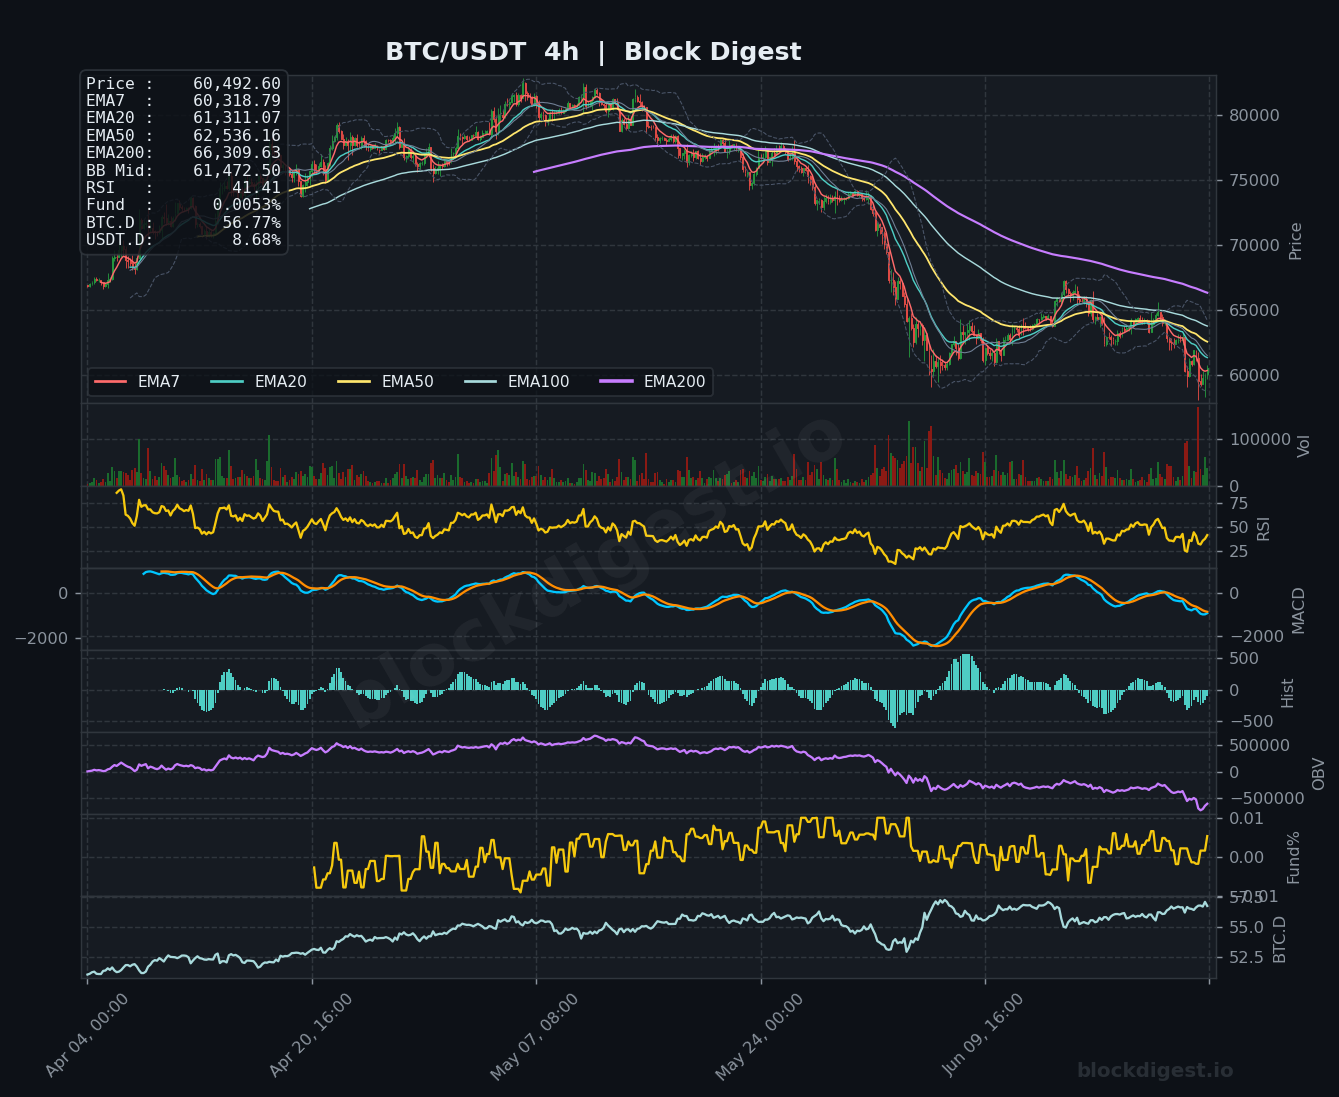
Across all three timeframes, the bearish bias is consistent and well-aligned, offering little technical ambiguity. On the 1h chart, price is attempting a minor stabilization near $60,490 with the RSI recovering to 53.48, but the EMA50 ($60,668) and EMA200 ($62,484) continue to act as overhead resistance. The 4h chart presents perhaps the clearest bear structure, with EMA7 ($60,318), EMA20 ($61,311), EMA50 ($62,536), and EMA200 ($66,309) all sloping downward and stacked in bearish order above current price. The 4h RSI reading of 41.41 confirms that momentum remains weak without approaching oversold extremes, suggesting room for further downside before a meaningful technical bounce materializes.
Key Levels to Watch
- Resistance: $61,311 — 4h EMA20, the most immediate dynamic resistance that capped prior recovery attempts
- Resistance: $62,484–$62,536 — confluence zone where 1h EMA200 and 4h EMA50 converge, a critical ceiling for any recovery rally
- Resistance: $63,260–$63,862 — daily Bollinger Band midline and daily EMA20, the structural line-in-the-sand for bulls to reclaim trend
- Support: $60,000 — major psychological level and short-term demand zone currently being tested
- Support: $58,000–$58,500 — visible price structure and lower Bollinger Band region on the 1h chart, next meaningful downside target on a $60K breach
- Support: $55,000–$56,000 — longer-term structural support visible on the 4h and daily charts, representing a significant capitulation zone if selling accelerates
Momentum & On-Chain Signals
The daily RSI at 33.87 is approaching but has not yet confirmed oversold territory (below 30), suggesting the trend exhaustion signal has not fully fired — bulls should not assume a bottom until RSI dips and reclaims 30+ with divergence. The 4h MACD remains in bearish territory with the signal line below zero and the histogram printing negative bars, though the histogram has begun compressing slightly, hinting at a potential deceleration of selling momentum. OBV on both the 4h and daily timeframes is trending sharply lower, confirming that institutional-level distribution has been ongoing and is not yet showing signs of absorption. Funding rates at +0.0053% on the 1h and 4h are mildly positive, indicating residual long bias in perpetual markets — a setup that could accelerate losses if a flush triggers cascading liquidations toward $58,000.
BTC Dominance & Market Sentiment
BTC dominance sits at 56.77%, near the upper end of its recent range visible on the 4h chart, which historically indicates capital is rotating into Bitcoin relative to altcoins during risk-off conditions rather than flowing into the broader crypto market. USDT dominance at 8.68% reflects elevated levels of sideline cash, consistent with a risk-averse environment where participants prefer stablecoin holdings over active deployment. Together, these readings suggest the market is in a defensive posture, and a sustained recovery in BTC price would likely require a meaningful decline in USDT.D as sidelined capital re-enters risk assets.
Risk Scenarios
- Bullish case: A decisive hourly close back above $61,311 (4h EMA20) on elevated volume, accompanied by a positive 4h MACD histogram crossover, would signal a short-term trend reversal targeting the $62,500–$63,260 resistance confluence. Sustained reclamation of the daily BB midline at $63,260 would meaningfully shift the intermediate-term outlook.
- Bearish case: A confirmed break and close below the $60,000 psychological level on the 4h timeframe would open the path toward the $58,000–$58,500 support zone, with further downside risk toward $55,000 if OBV continues declining and RSI fails to produce a bullish divergence.
Outlook
The overall setup for BTC as of June 26, 2026 is bearish across all major timeframes, with the $60,000 level representing the last meaningful near-term support before a more significant drawdown comes into play. The critical trigger to watch over the next 24–48 hours is whether price can hold above $60,000 on a closing basis while the 1h RSI maintains its current recovery above 50 — failure here would materially increase the probability of the bearish scenario. Bulls need to see a volume-backed reclaim of $61,311 at minimum before any confidence in a recovery rally is warranted. Until price reclaims the daily BB midline at $63,260 and EMA20 at $63,862, any bounce should be treated as a relief rally within a broader downtrend rather than a structural reversal.
Disclaimer: This analysis is for informational purposes only and does not constitute financial advice. Cryptocurrency markets are highly volatile and unpredictable. All trading decisions should be made based on your own research and risk tolerance. Block Digest is not responsible for any financial losses incurred as a result of acting on this content.
Stay Ahead of the Market
Follow BlockDigest for crypto market intelligence, research and real-time updates.


