Market Context
The broader altcoin market is navigating a challenging environment as BTC dominance holds firm at 54.65%, continuing to suppress capital rotation into altcoins. USDT.D at 8.20% suggests a moderate but not extreme risk-off posture — investors haven’t fled to stables en masse, yet meaningful risk appetite remains elusive. Block Digest’s BD Pulse Score sitting at just 34/100 with an RSI of 43.74 underscores the broader market’s lack of conviction, pointing to a market in consolidation rather than one primed for a decisive breakout.
Solana (SOL)
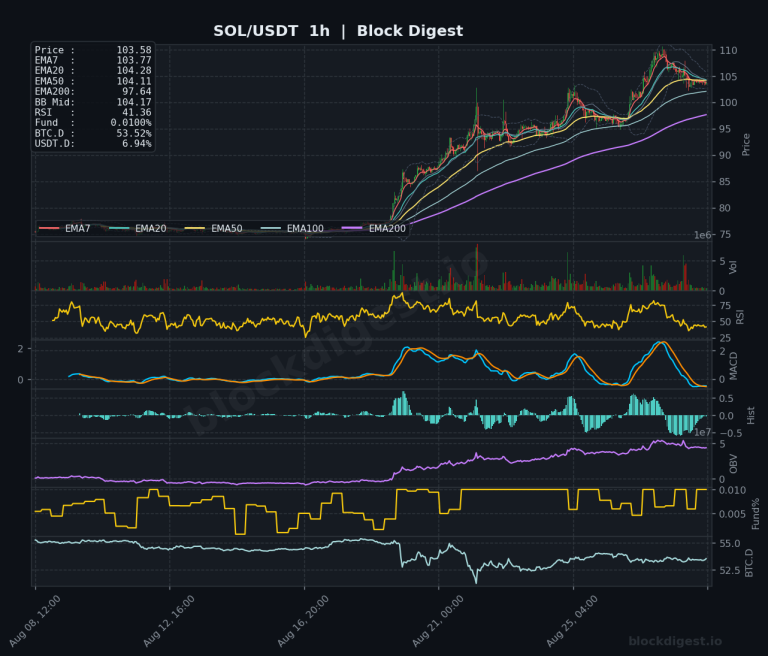
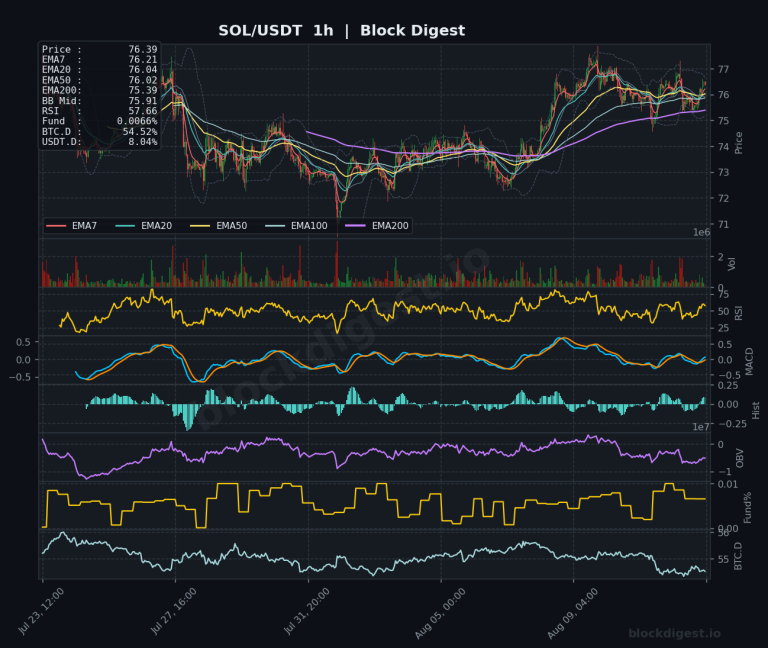
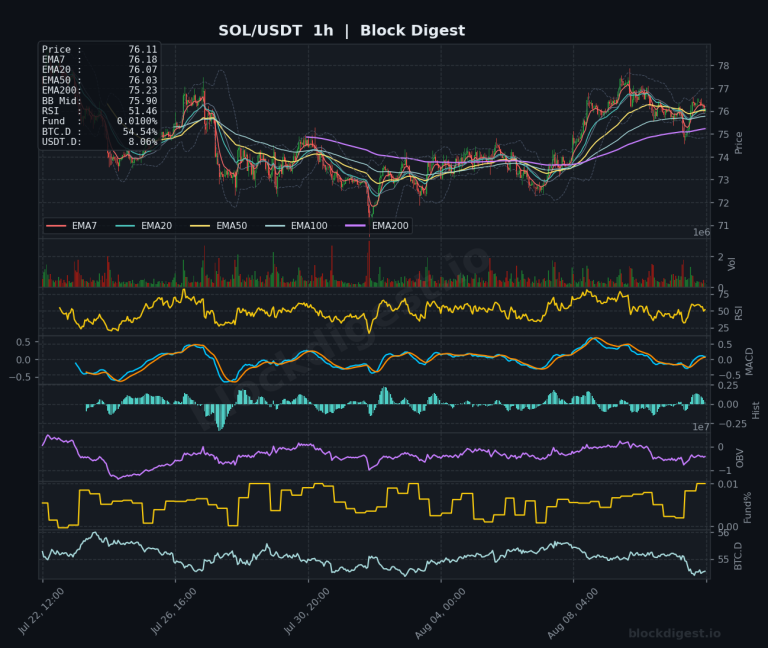
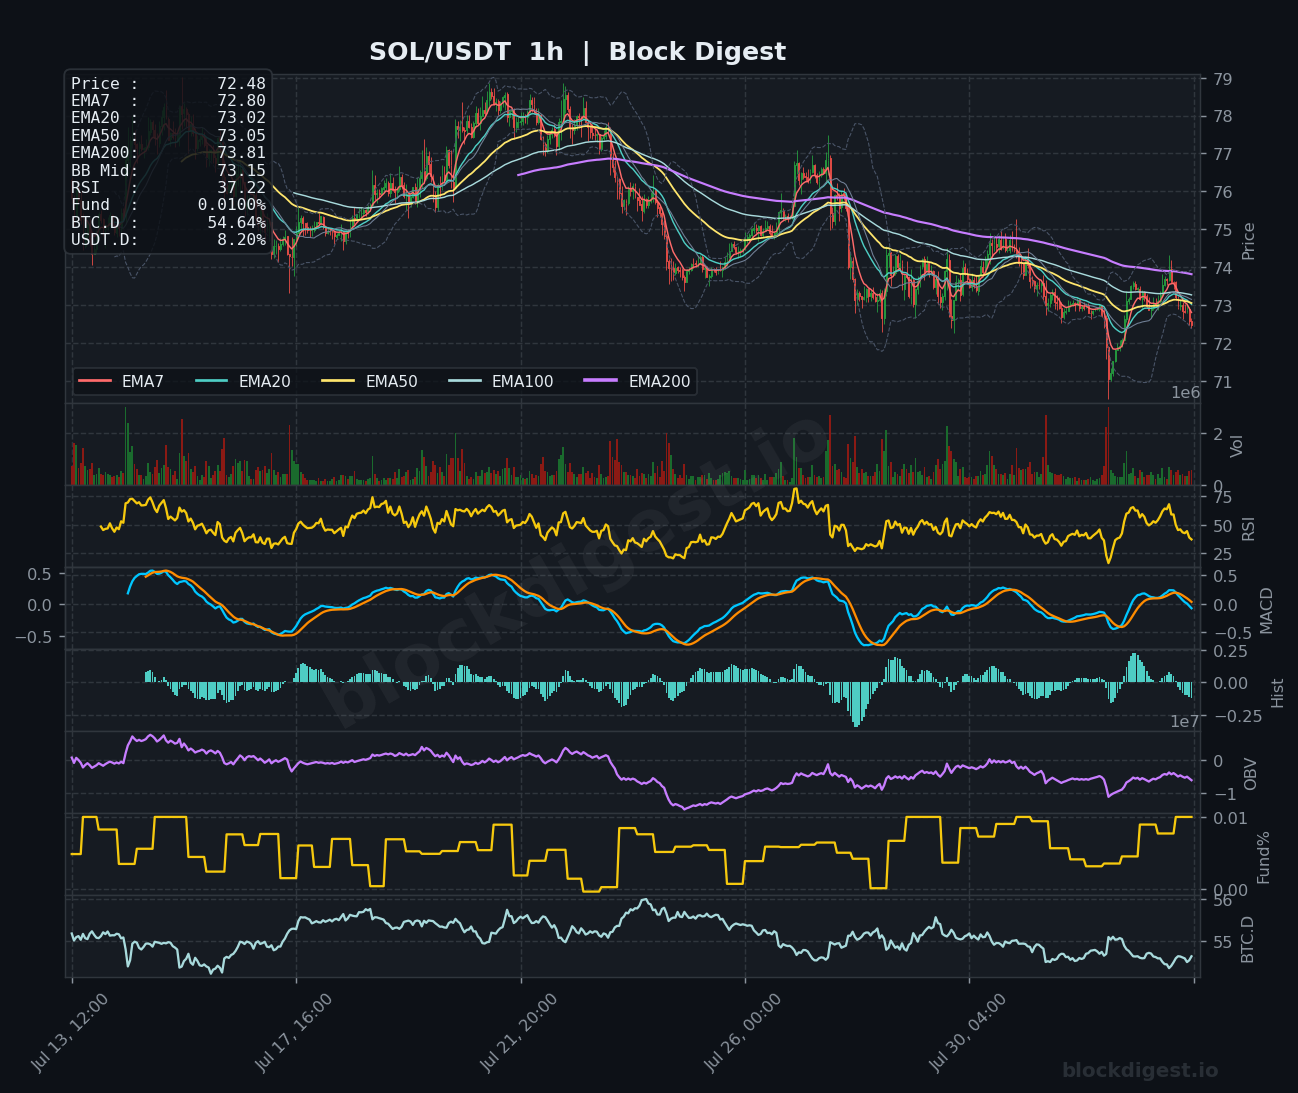
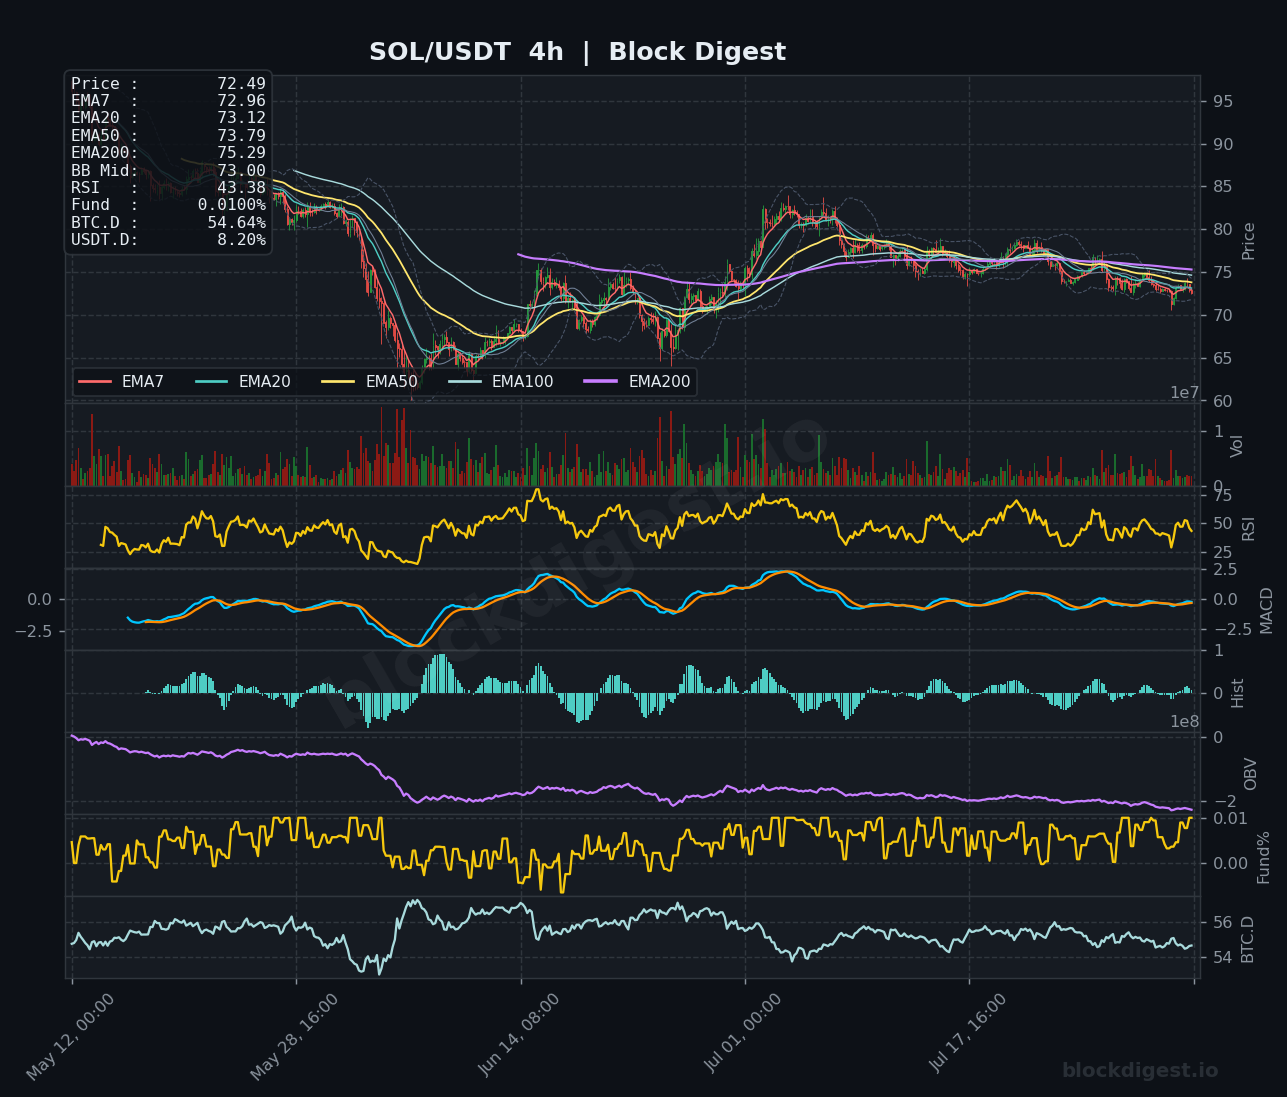
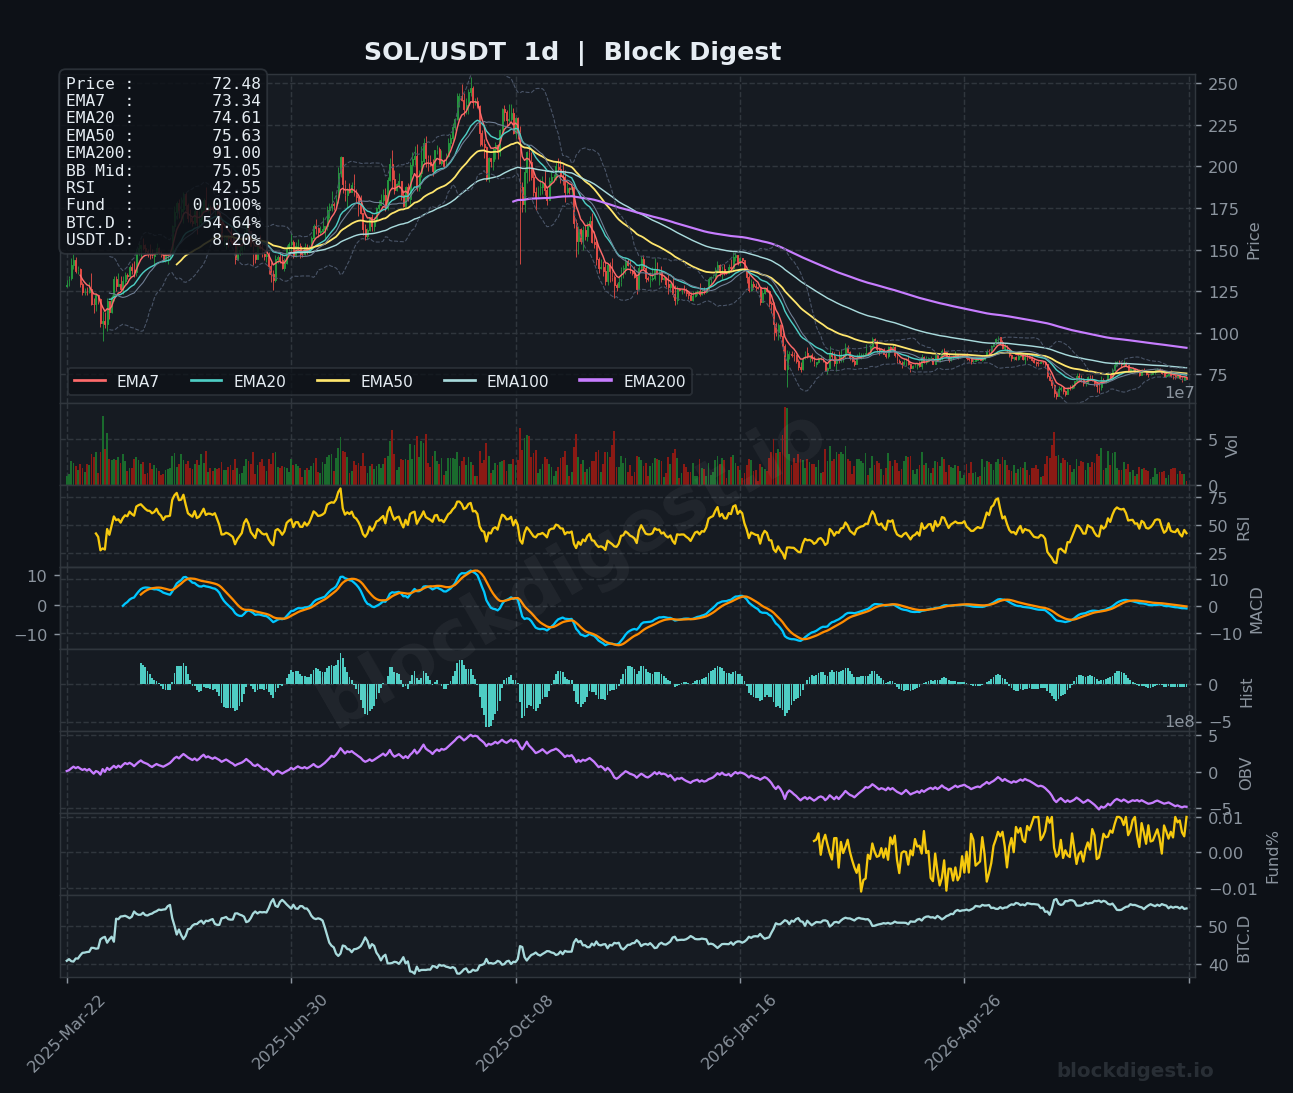
SOL is trading at $72.48, firmly below all key EMAs on both the 1h and 4h charts — the EMA7 ($72.80), EMA20 ($73.02), EMA50 ($73.05), and EMA200 ($75.29) are all stacked bearishly overhead, forming a dense resistance cluster between $73 and $75.30. The 1h RSI at 37.22 and the daily RSI at 42.55 both reflect weak momentum without yet reaching oversold extremes that might attract buyers. On the daily chart, the OBV has been in steady decline since the mid-cycle peak, confirming that selling pressure has been persistent and not yet exhausted. Immediate support sits near the $71 swing low, and unless SOL can reclaim $73.50 with conviction, the short-term bias remains bearish with further downside risk toward the $69–$70 zone.
XRP (XRP)
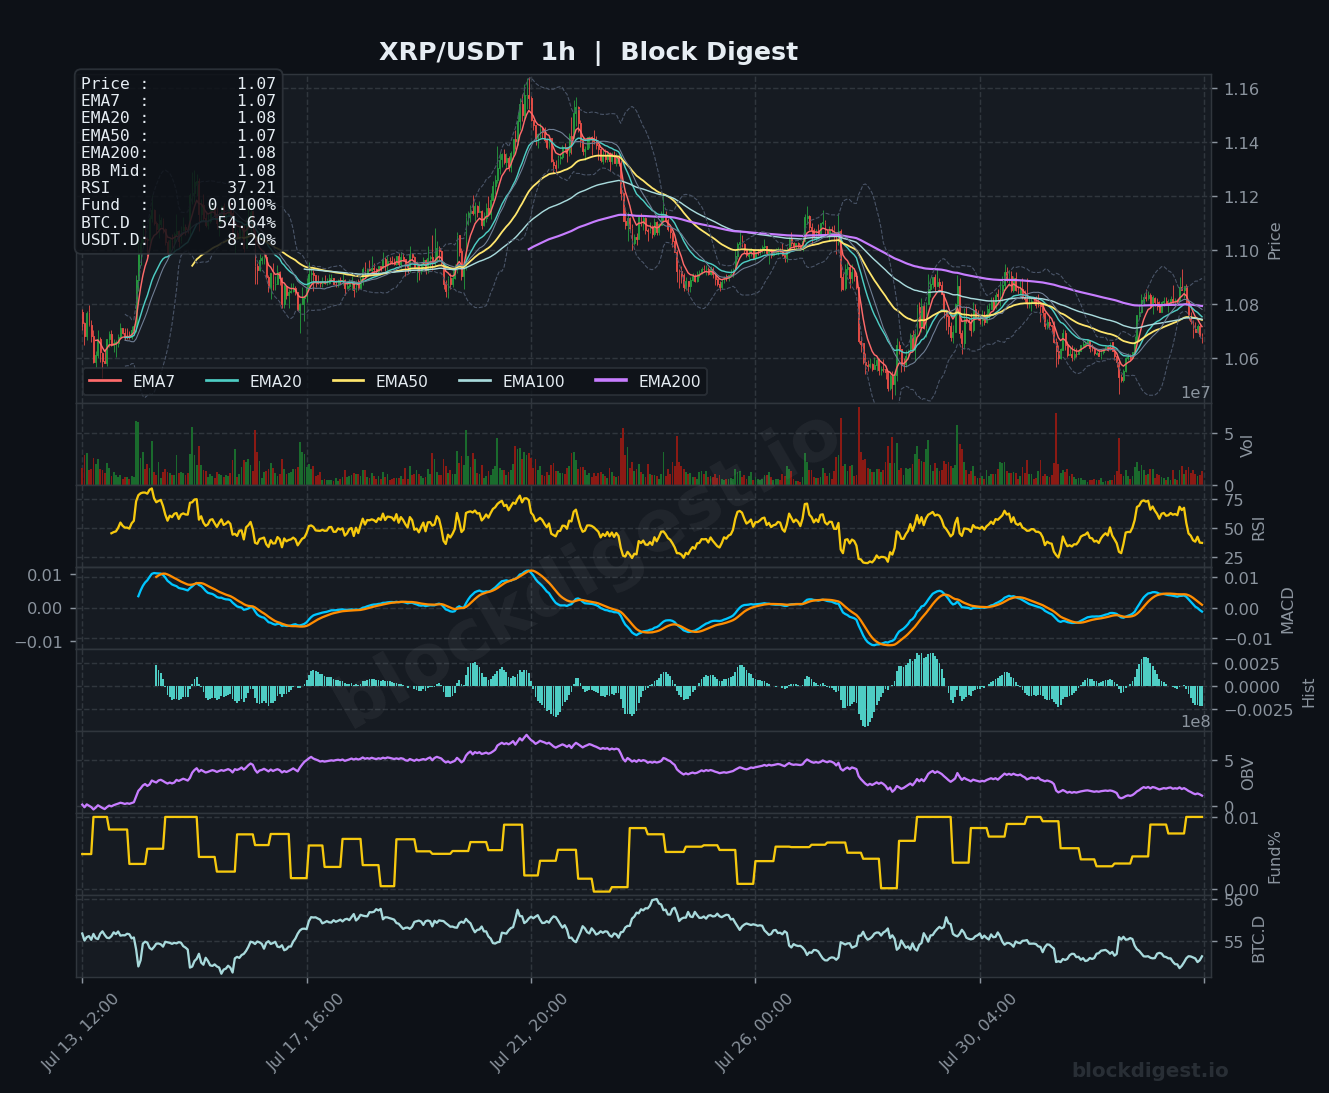
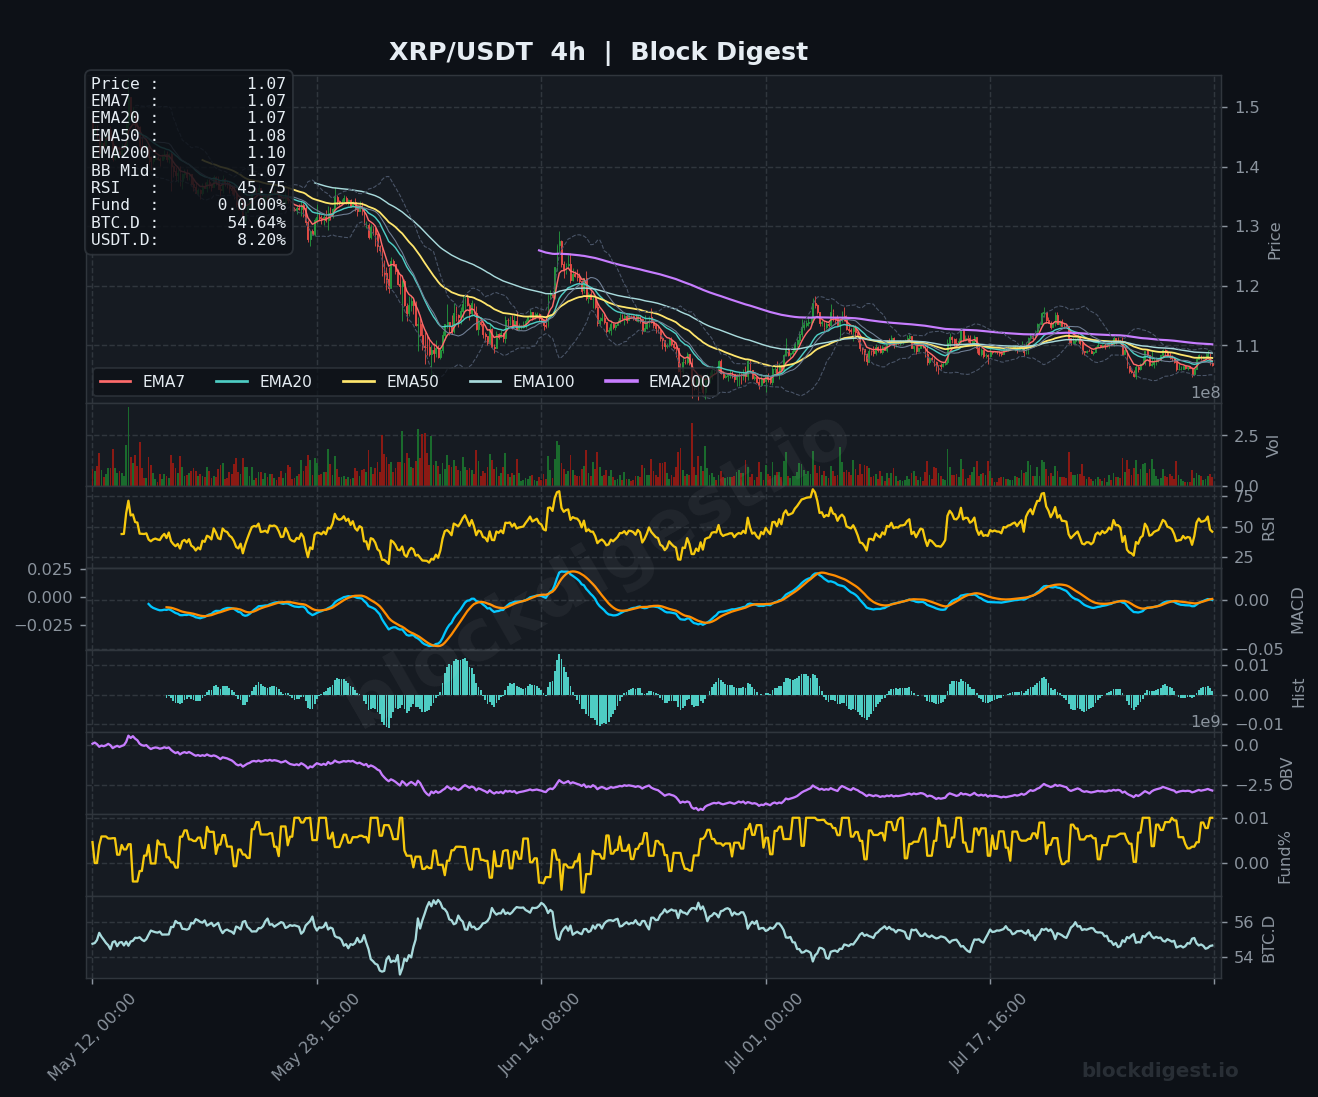
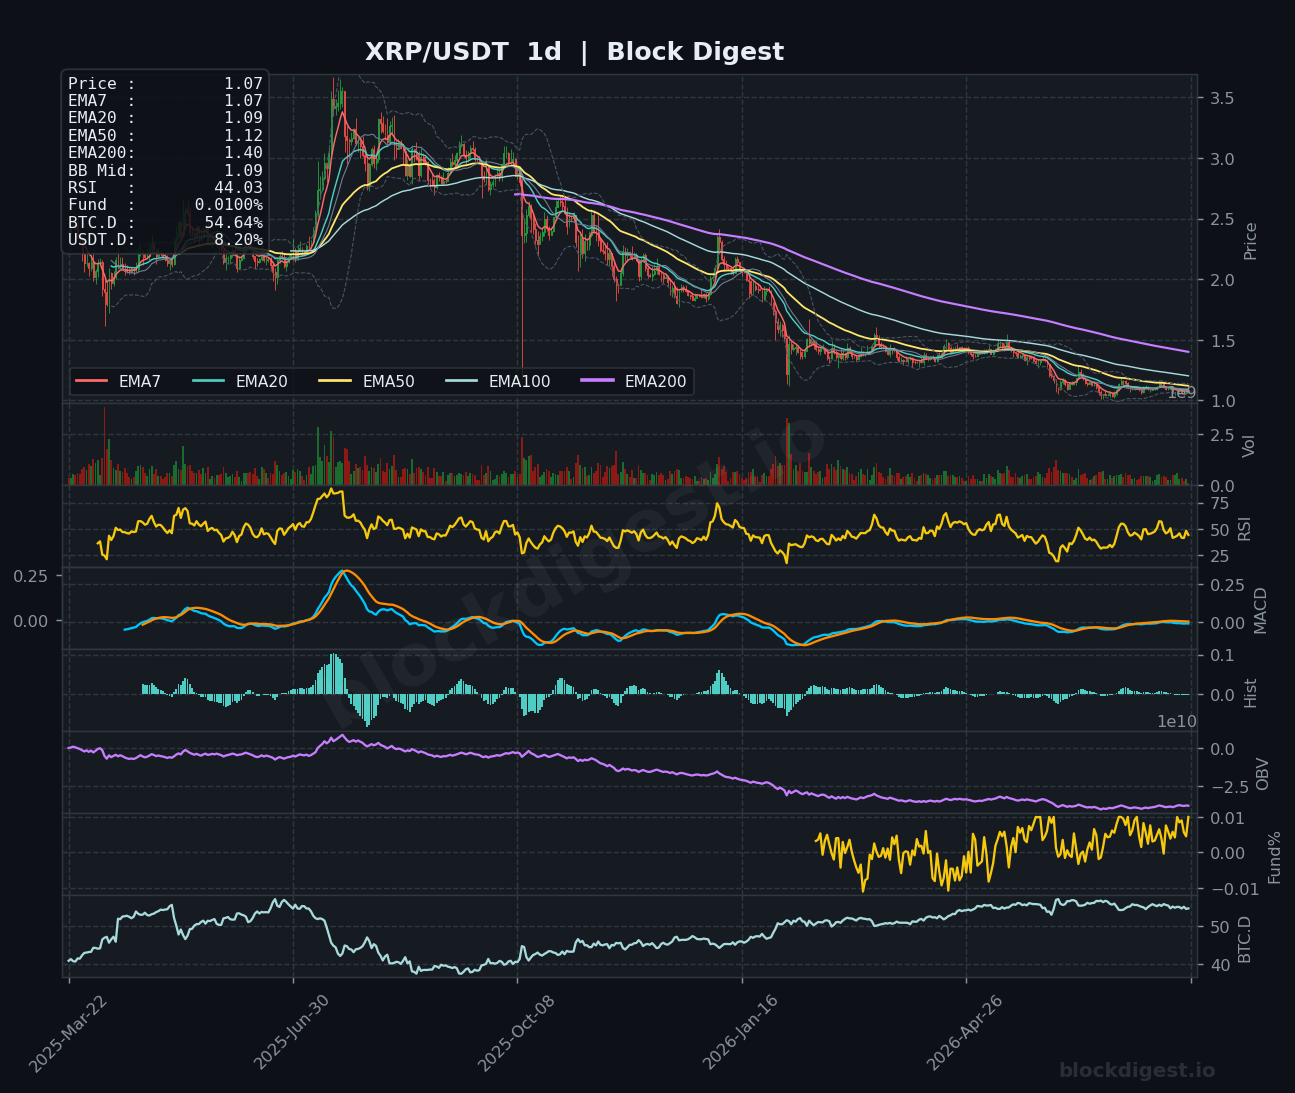
XRP is trading at $1.07, a significant distance from the news-context figure of $3.16, suggesting the charts reflect a different pair or period — based purely on chart technicals, price is pinned just below the EMA cluster with the EMA7 and EMA50 both at $1.07–$1.08, while the EMA200 on the 4h sits at $1.10, acting as overhead resistance. The daily RSI at 44.03 and the 4h RSI at 45.75 place XRP in neutral-to-weak territory, with the MACD on both timeframes hovering near the zero line without a clear directional signal. The daily OBV has been trending lower over an extended period, a persistent bearish divergence that warns against expecting a sustained bounce without a catalyst-driven volume surge. Key support is at $1.05–$1.06; a clean break below that level opens the door to $1.00, while reclaiming $1.10 would be the first meaningful sign of recovery.
BNB (BNB)
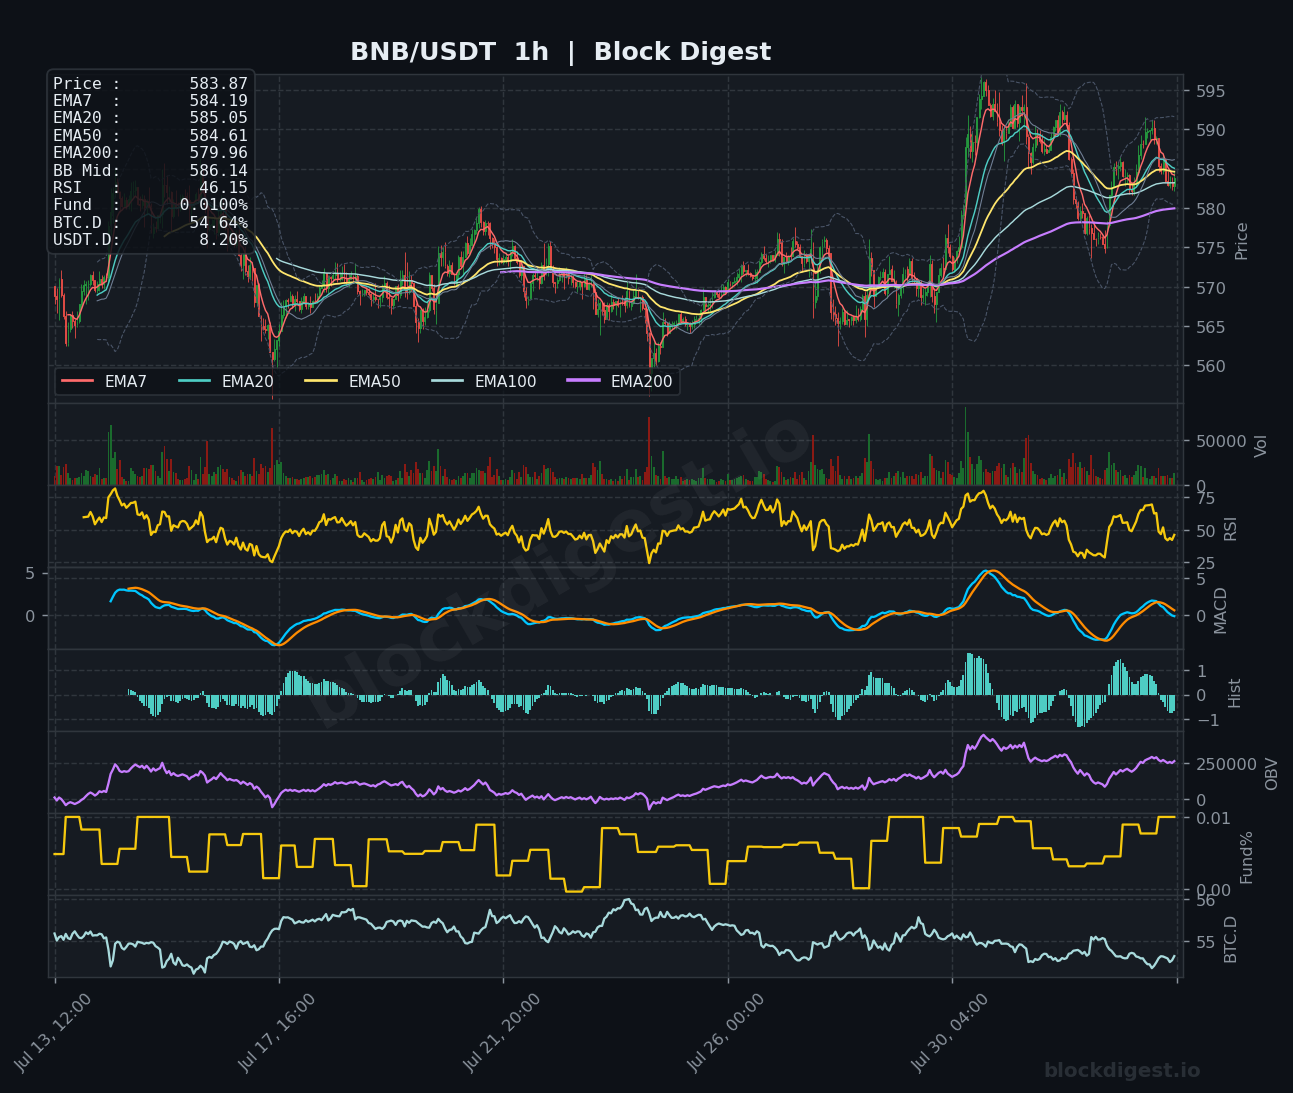
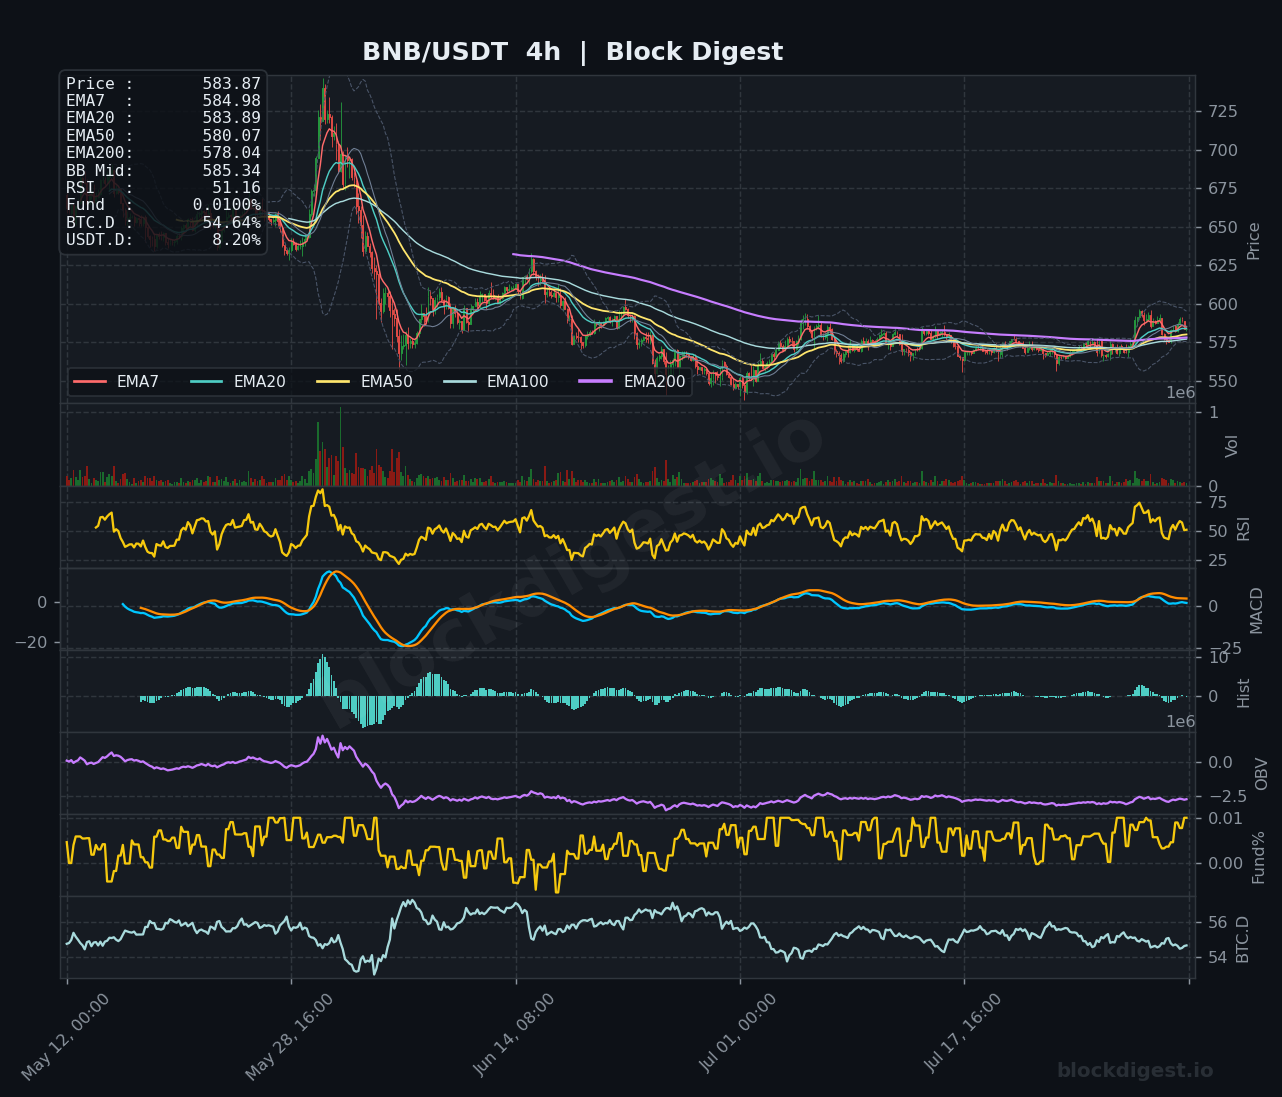
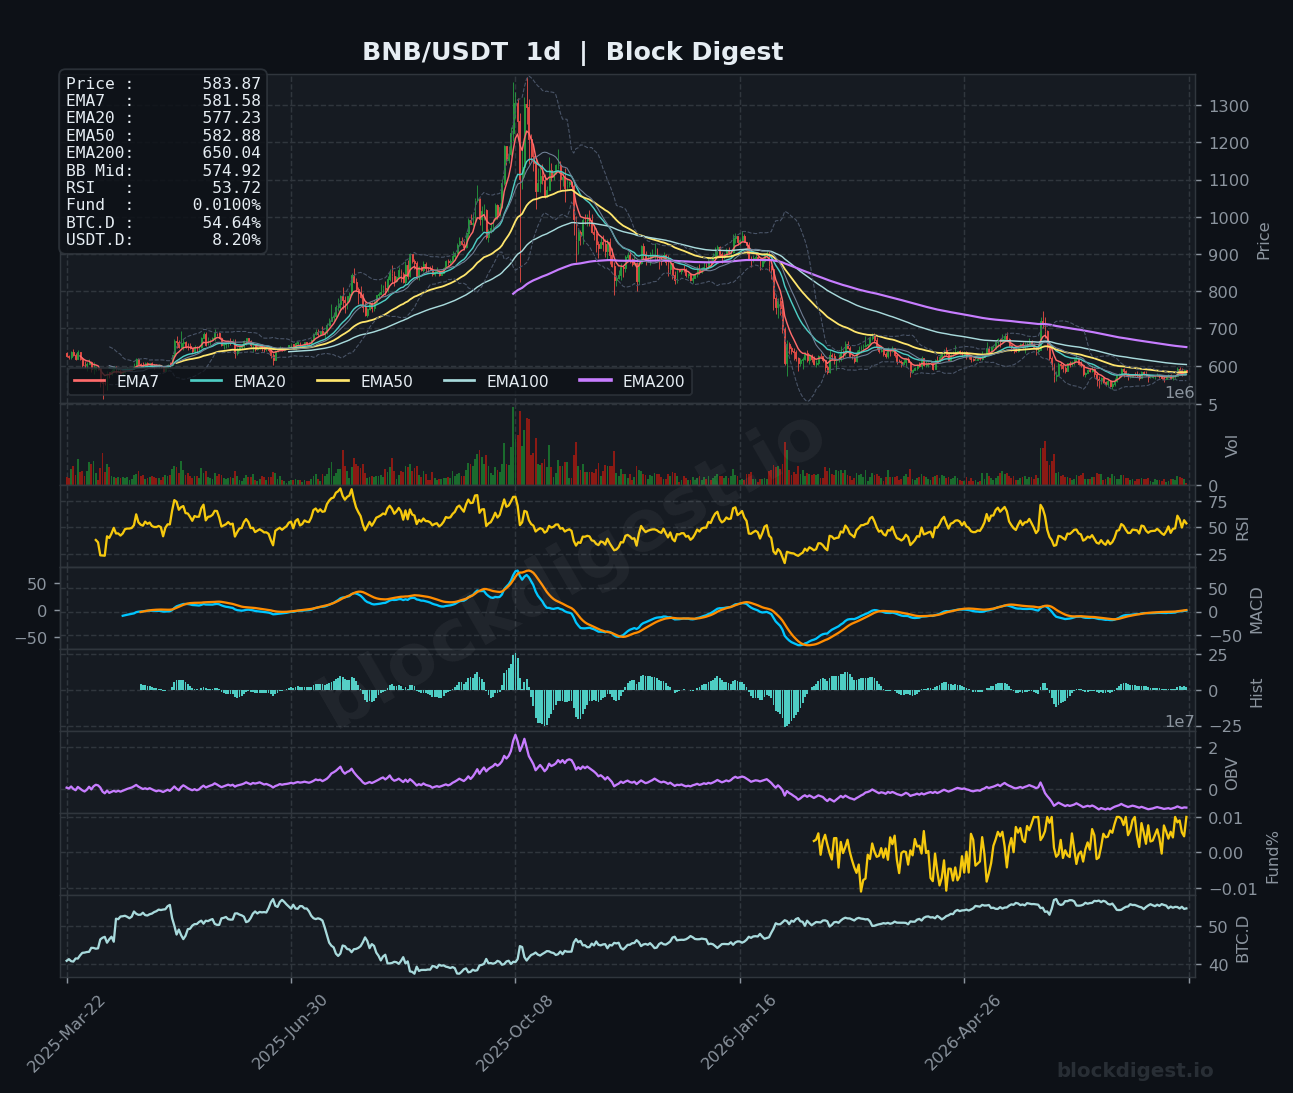
BNB at $583.87 is the relative standout among today’s cohort, with the daily RSI at 53.72 — the only coin in this group holding above the neutral 50 level — and price trading above both the EMA50 ($582.88) and EMA20 ($577.23) on the daily chart, a constructive structure. The 4h chart shows a recent sharp spike toward $595 followed by a pullback, with the MACD on the 4h now flattening near zero, suggesting the initial impulse energy from the recent 1.57M token burn and Nasdaq ETF debut news is fading. On the 1h, RSI has pulled back to 46.15 and EMAs are in a minor bearish cross, indicating short-term consolidation after the spike. The $578–$580 zone represents a key demand area to watch; holding here keeps the bullish daily structure intact, while a decisive break below $570 would shift the bias to neutral-bearish.
Dogecoin (DOGE)
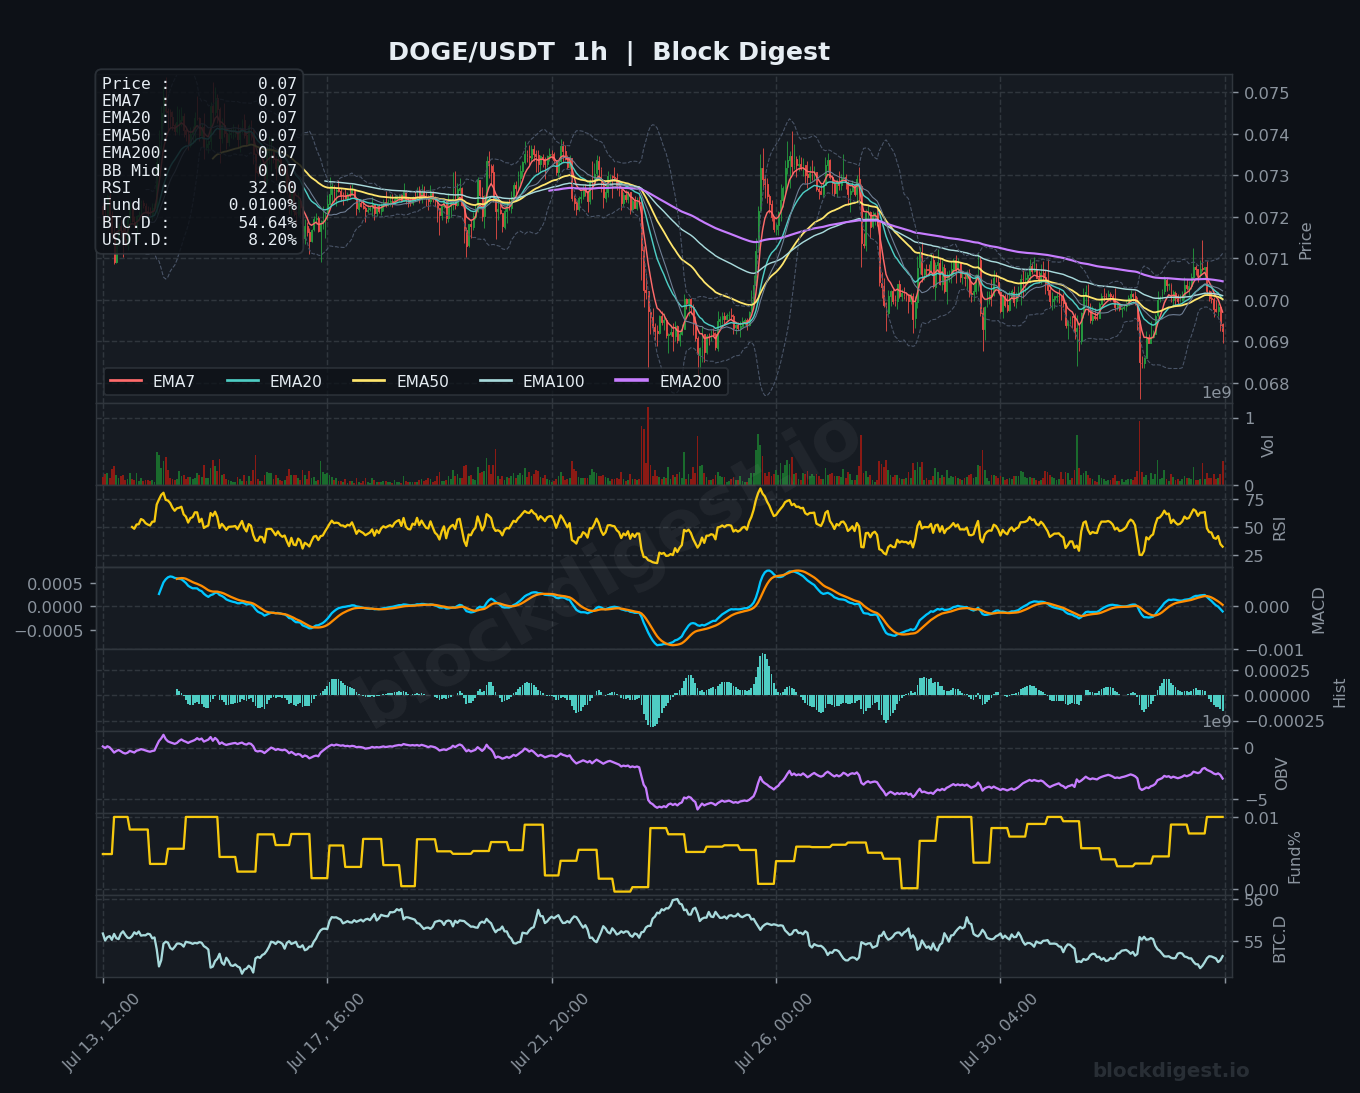
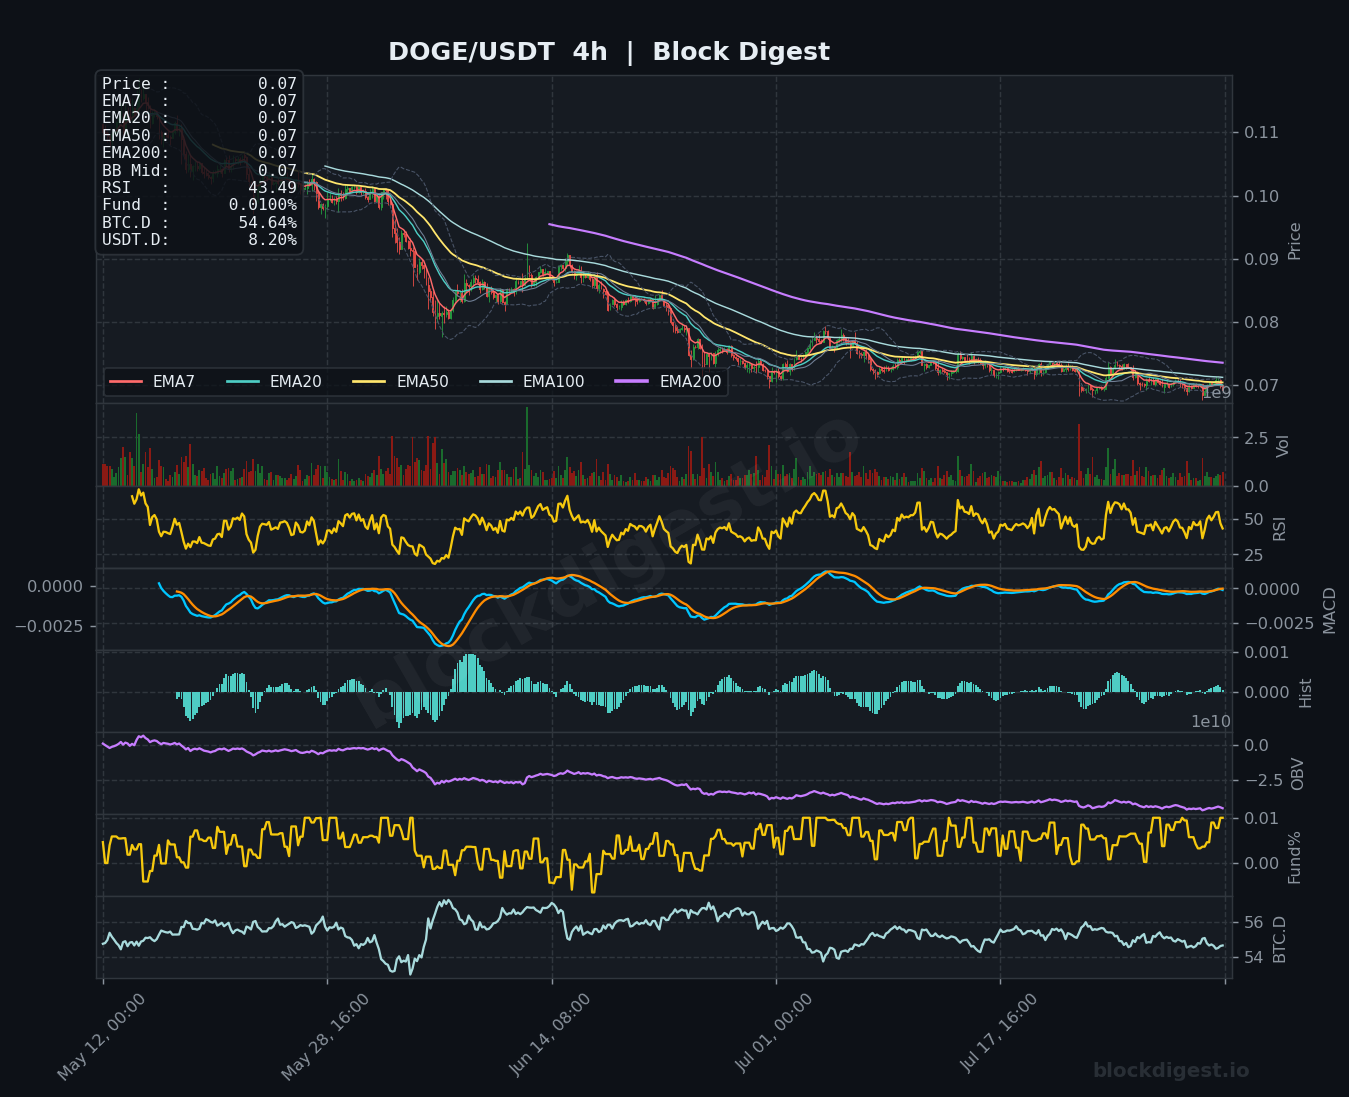
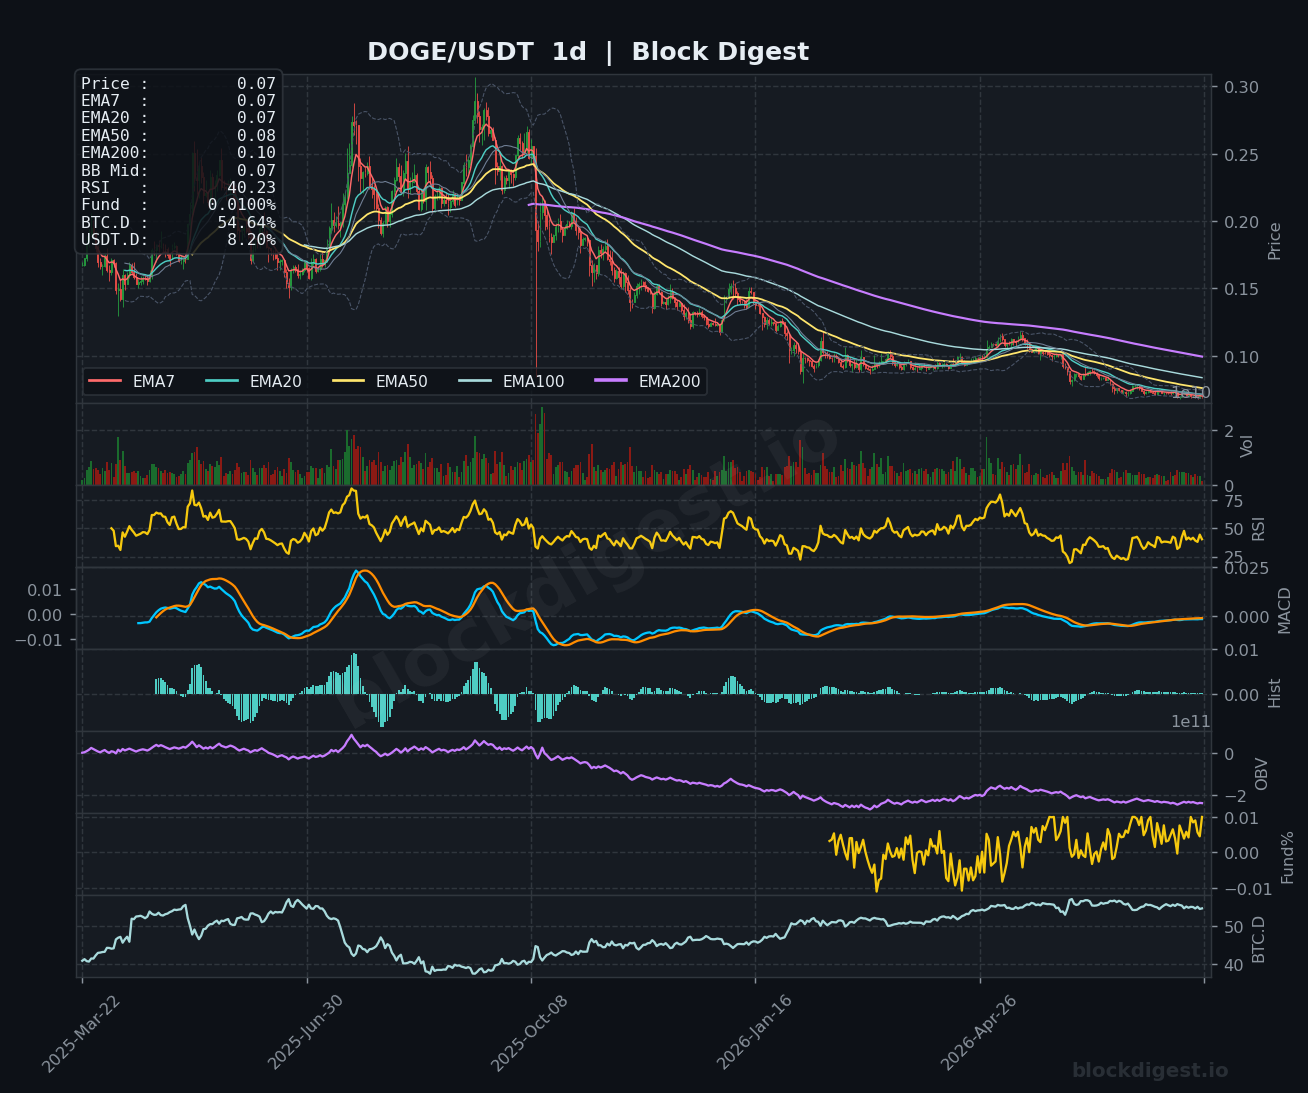
DOGE is trading at $0.07 across all chart timeframes, which diverges materially from the $0.2933 figure cited in the news context — technically, the charts show a market deep in a downtrend, with the daily EMA200 at $0.10 and the EMA50 at $0.08 both acting as distant overhead resistance. The 1h RSI at 32.60 and the daily RSI at 40.23 confirm weak momentum, with the 1h chart flirting with oversold conditions. The 4h OBV has been in a prolonged downtrend, undermining any near-term bullish narrative despite the reported 13% single-session pop and 60% volume surge in broader market data — the chart structure does not yet confirm a sustained reversal. Short-term bias is cautiously bearish; bulls need to see a close above the $0.072–$0.073 area to suggest a more durable bounce is forming.
Litecoin (LTC)
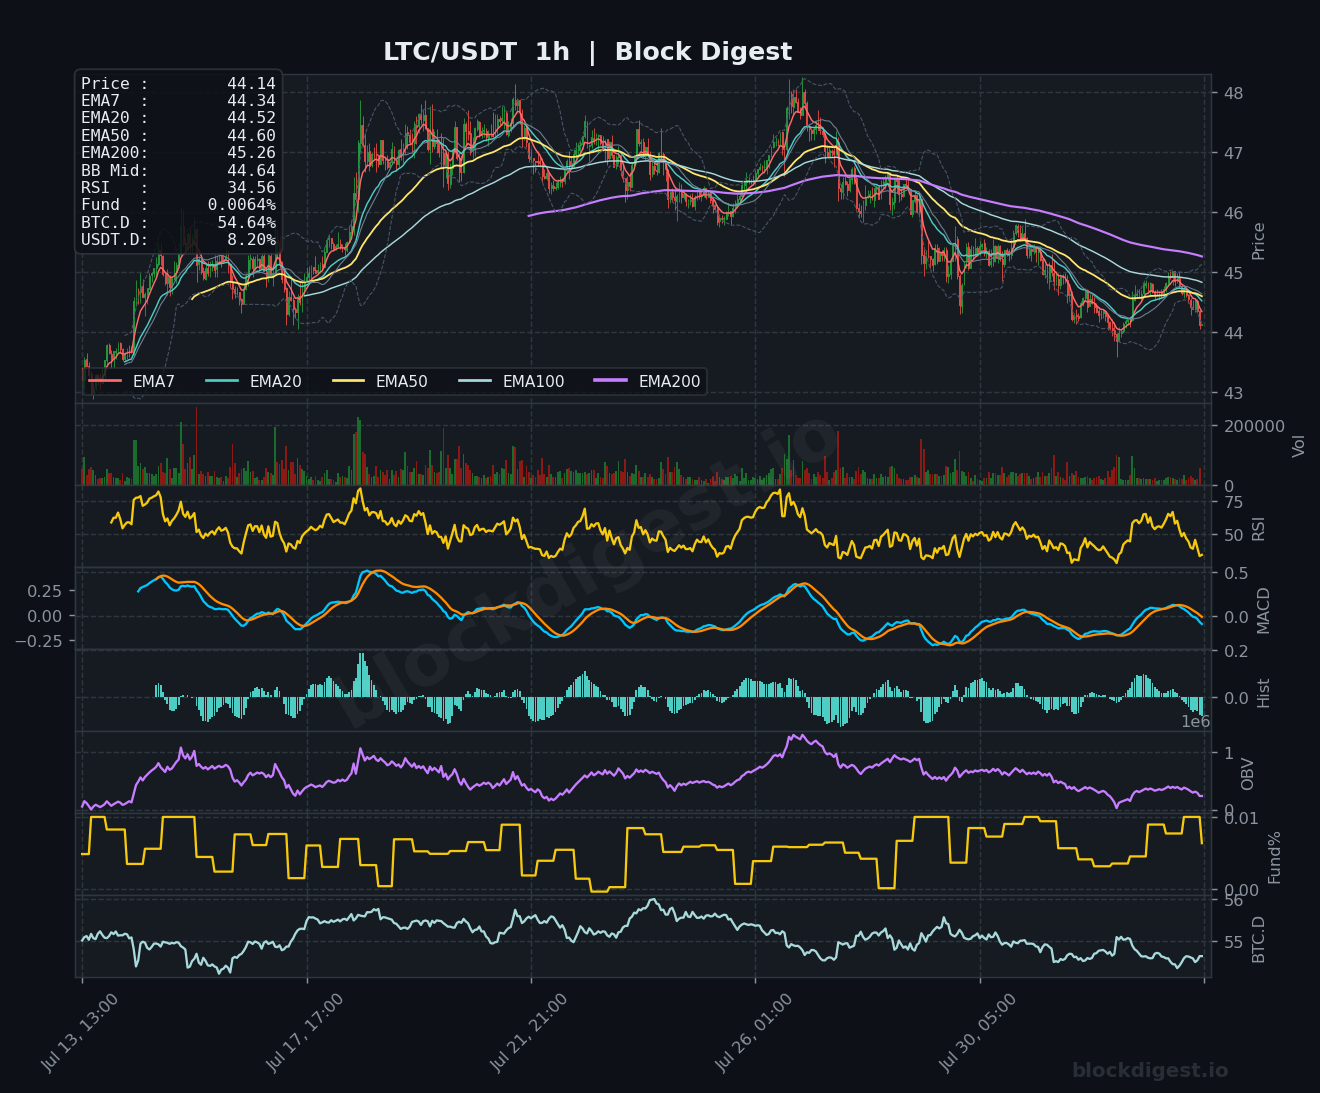
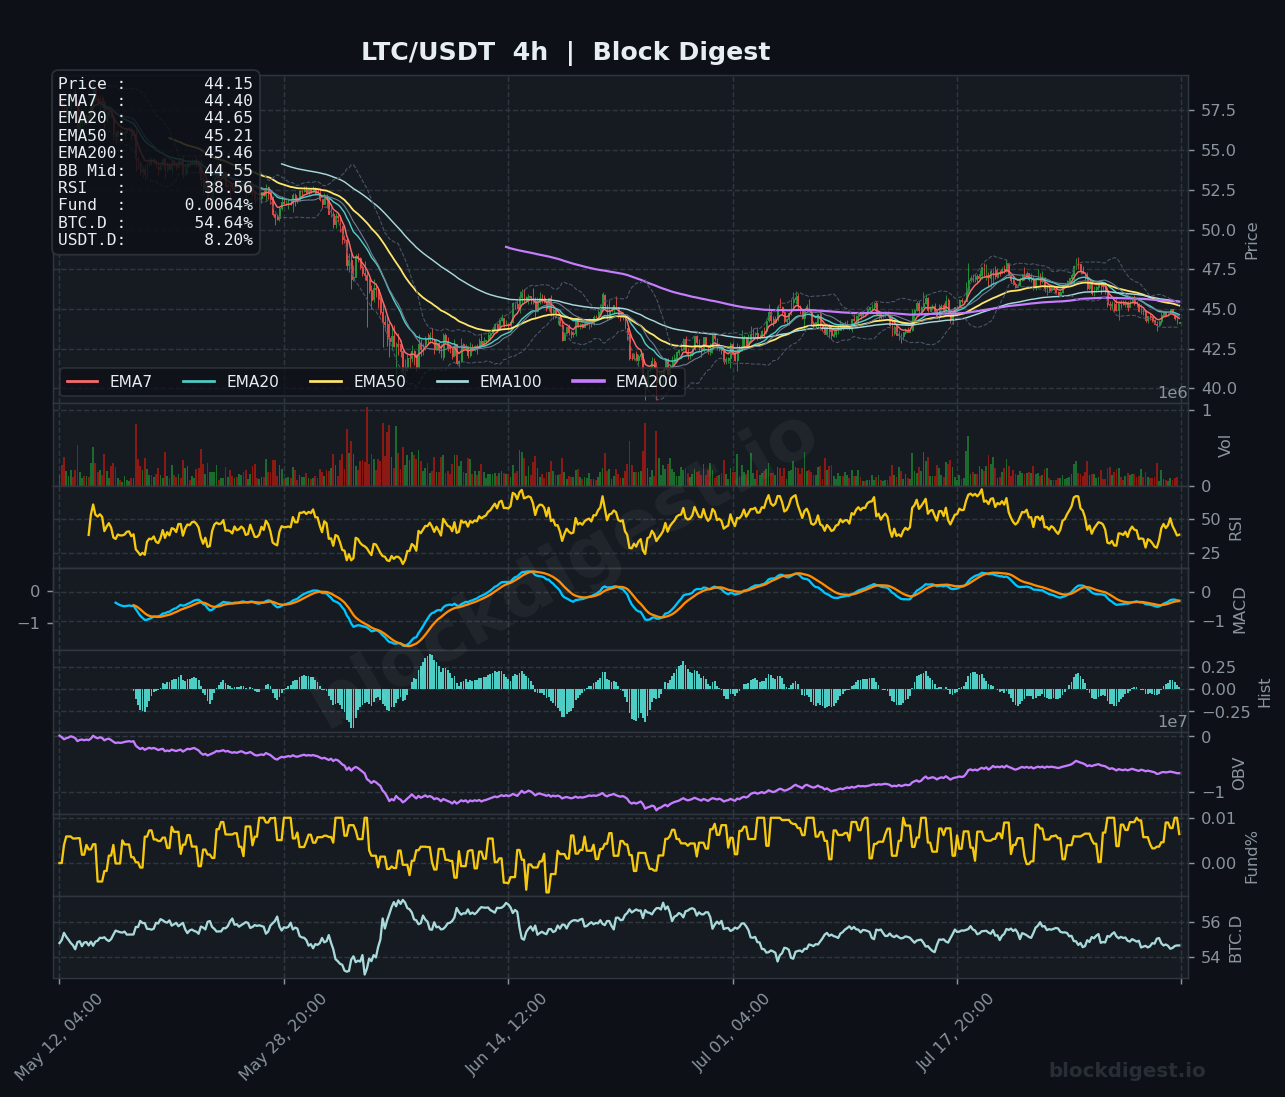
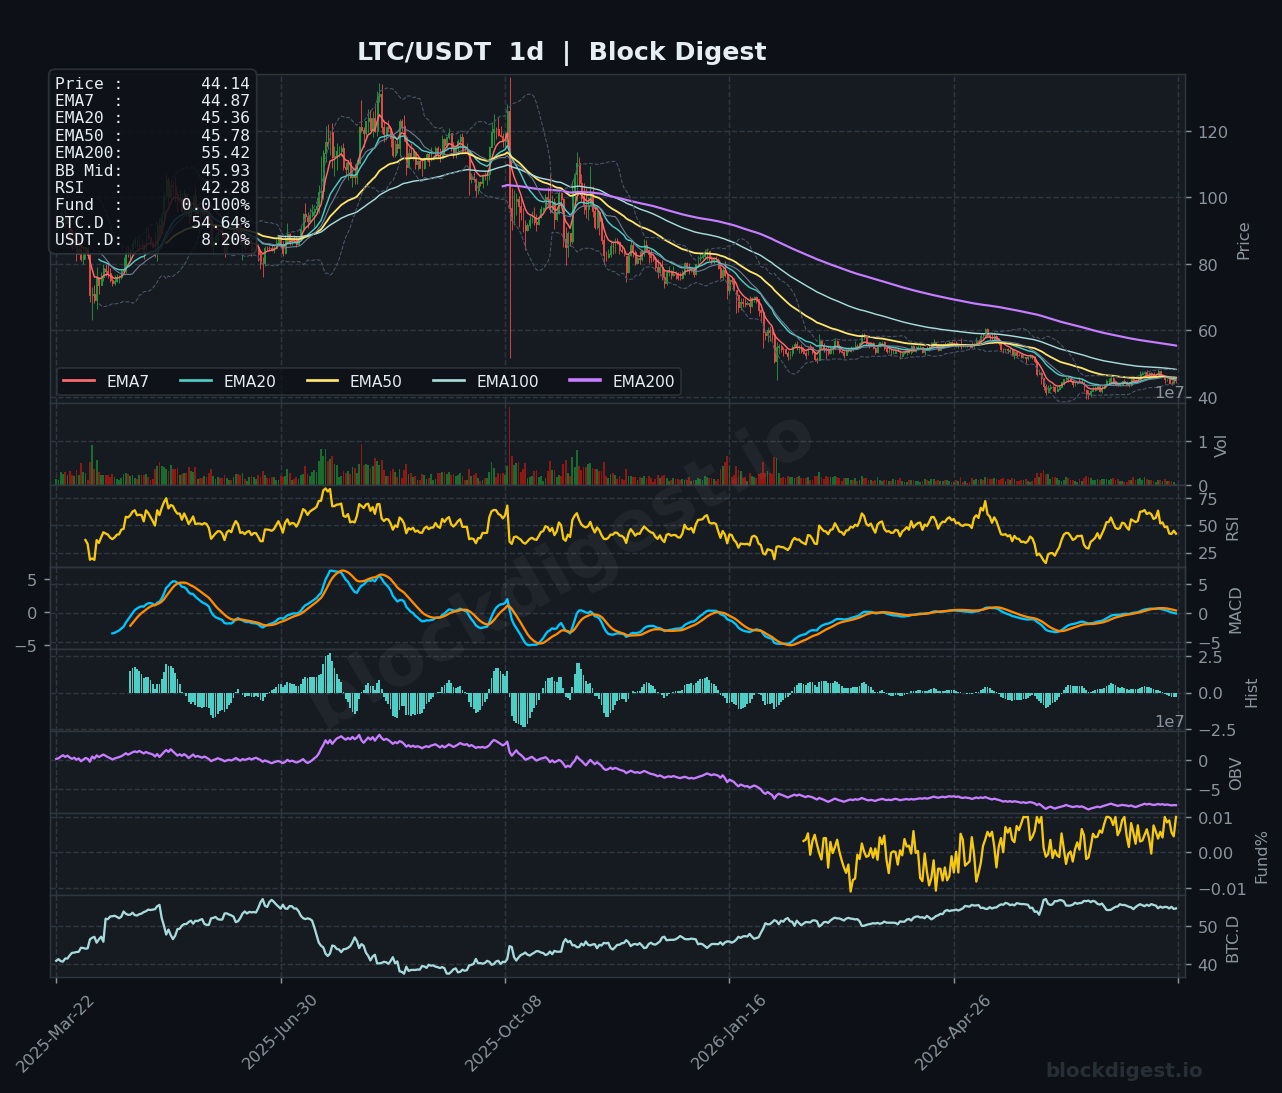
LTC is trading at $44.14, sitting below all major EMAs on both the 1h and 4h timeframes — the EMA7 at $44.34, EMA20 at $44.52, and EMA50 at $44.60 on the 1h are all in a bearish stack just overhead, creating immediate resistance up to the $45 area. The 1h RSI at 34.56 is approaching oversold territory, while the 4h RSI at 38.56 reinforces a weak but not yet exhausted momentum picture. The daily chart paints a grim longer-term backdrop: price has declined sharply from the $120 area and is now compressing near multi-year support in the $43–$45 range, with the daily RSI at 42.28 lacking any bullish divergence signal so far. A hold above $43 is critical for any near-term stabilization; a breakdown below that level could accelerate selling toward the $40 psychological floor.
TRON (TRX)
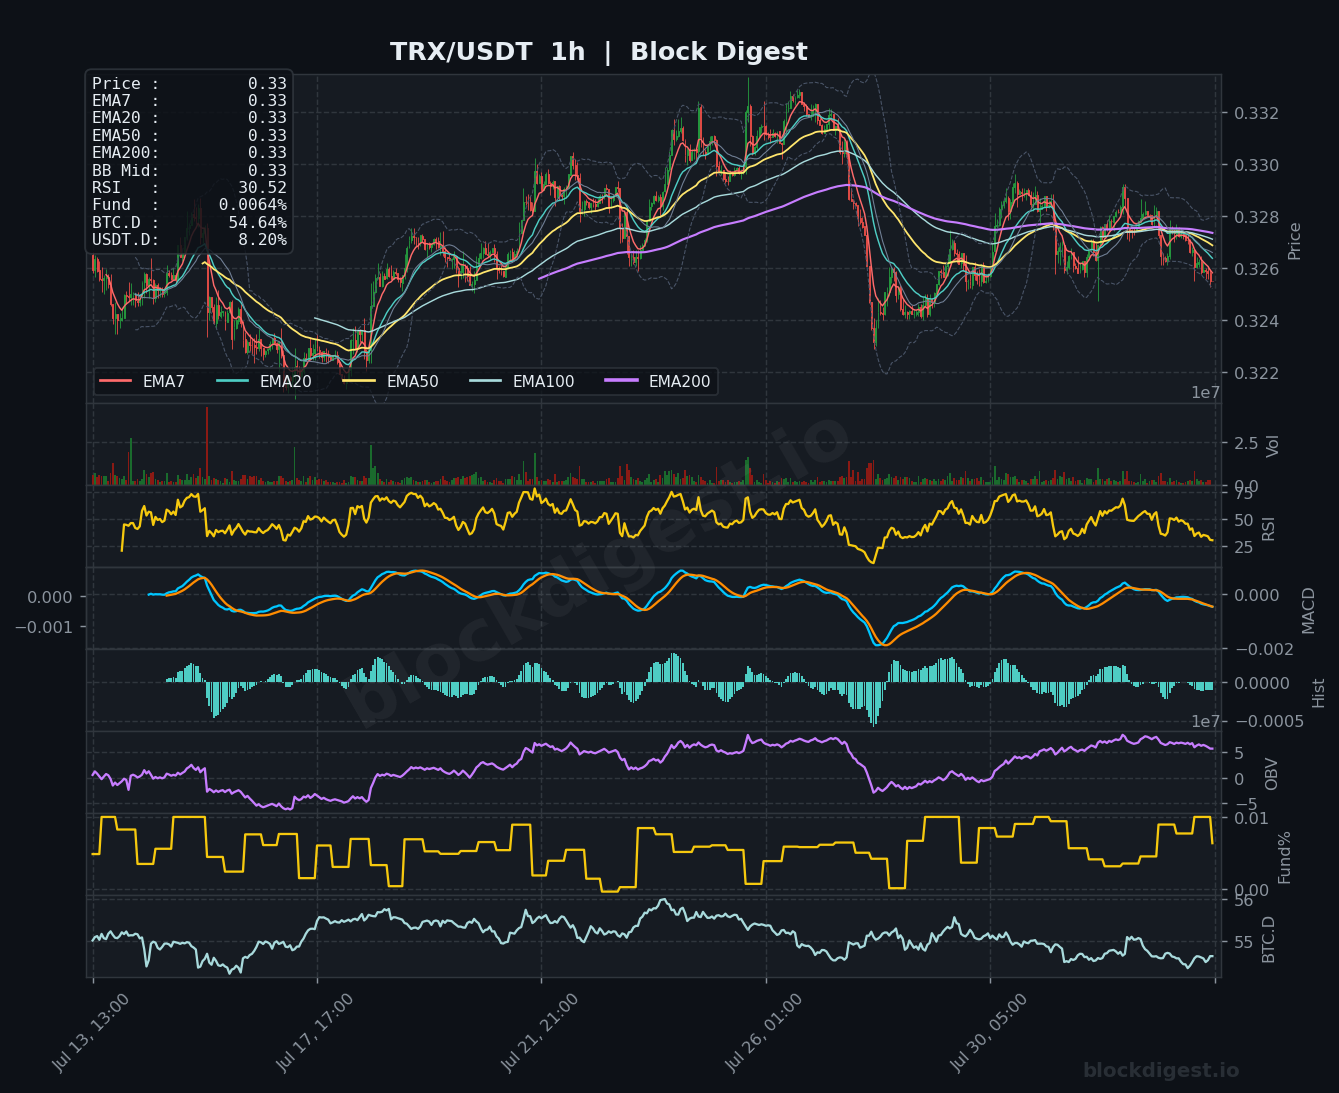
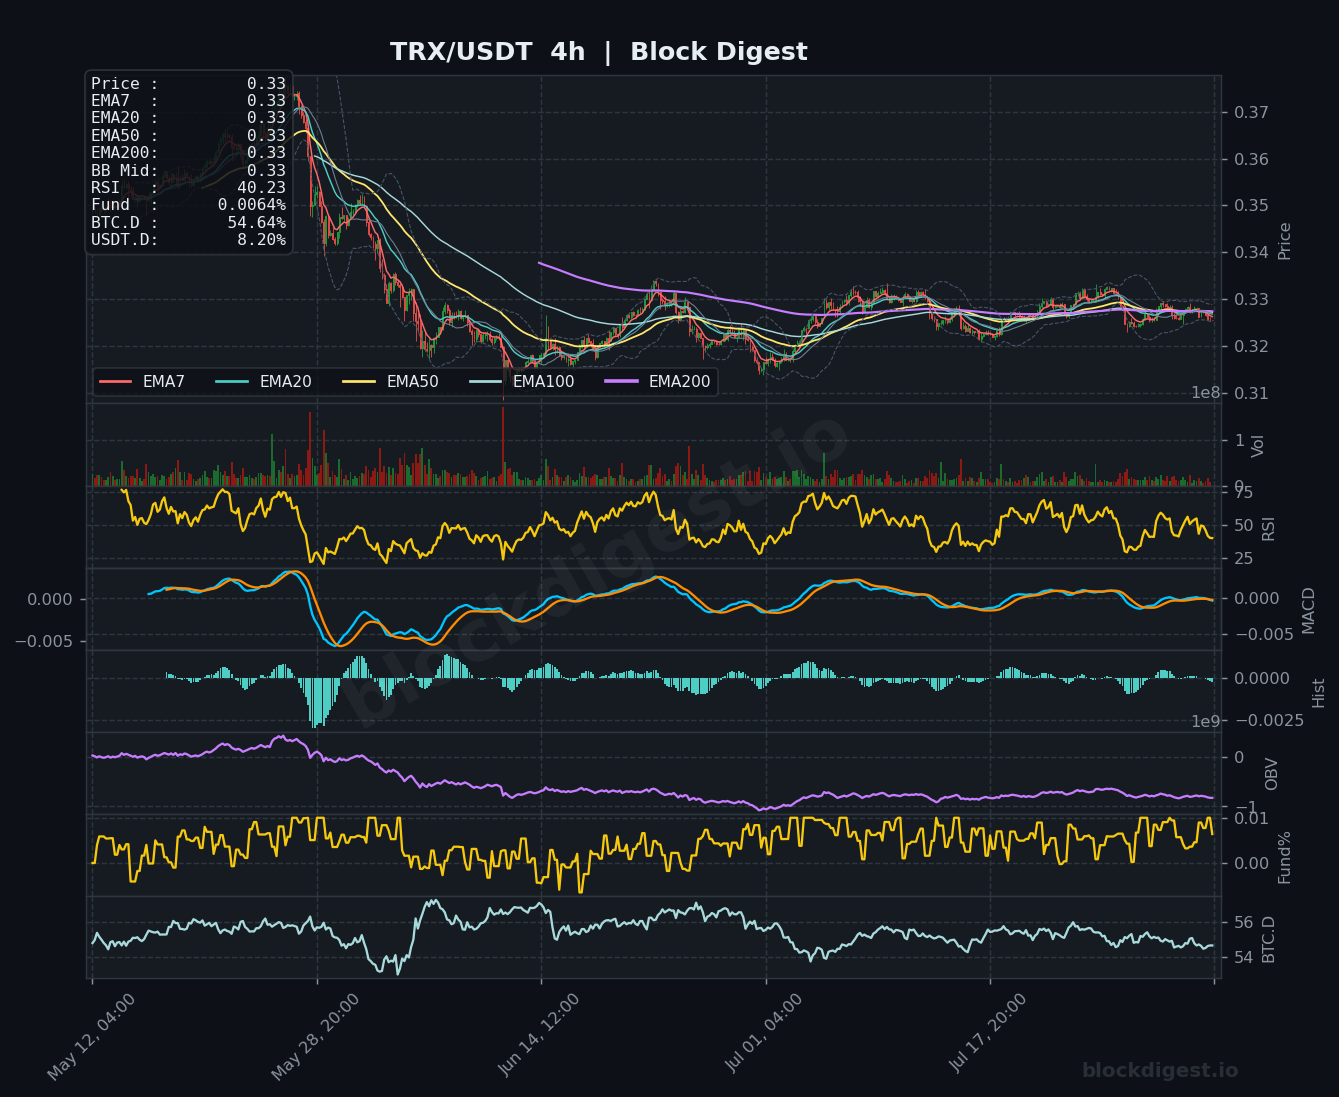
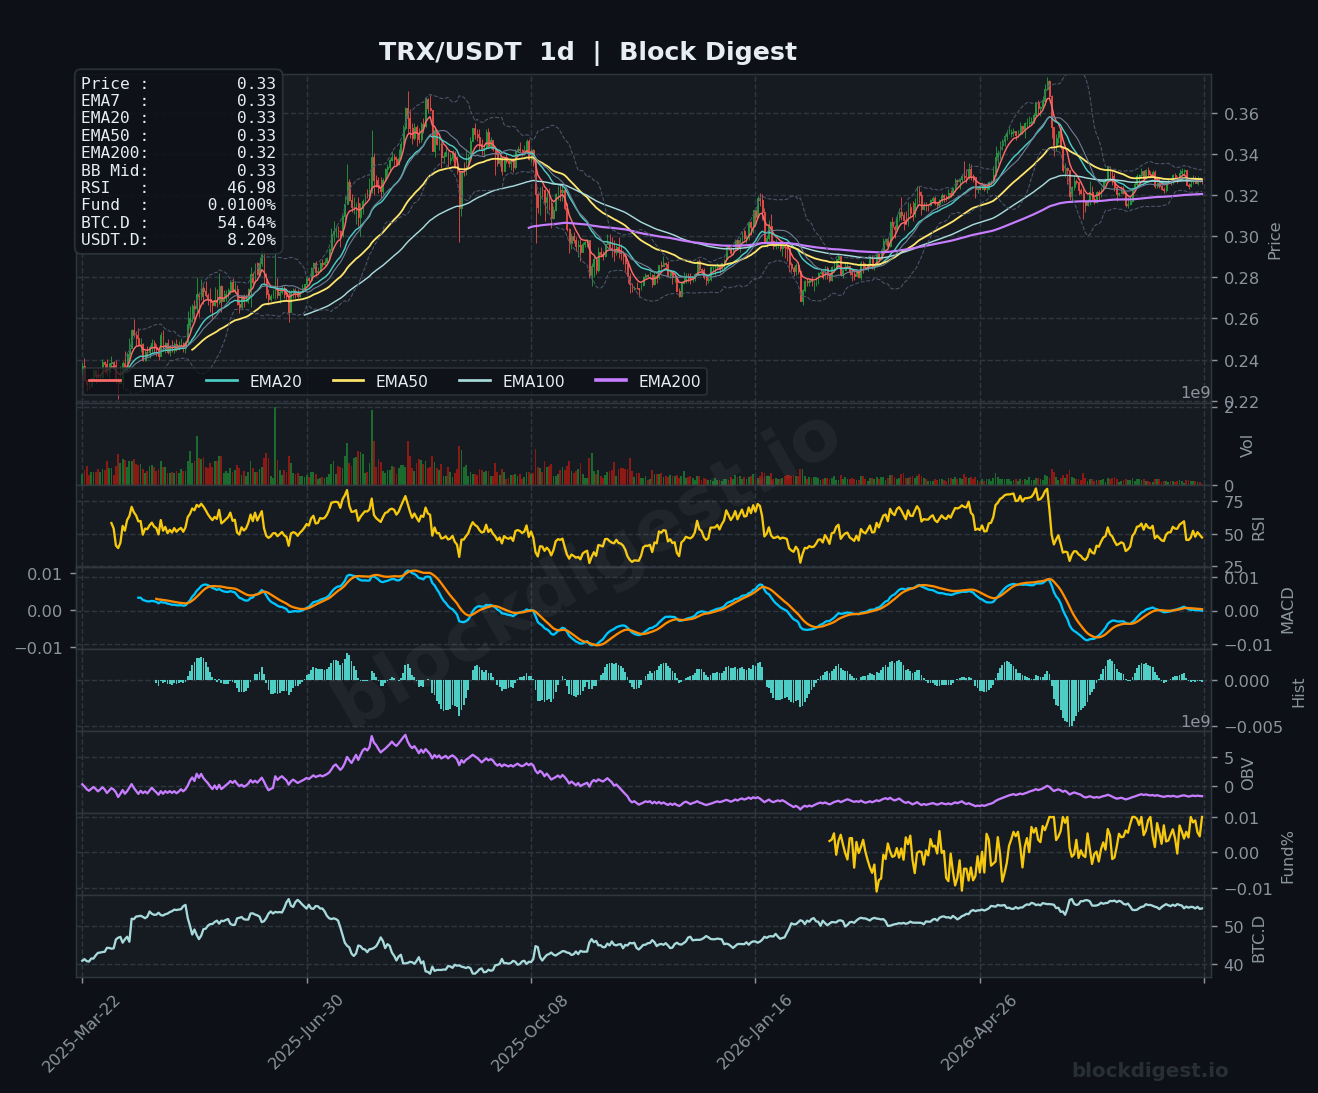
TRX at $0.33 is trading in a tight range, with all EMAs on the 1h chart converging at $0.33, reflecting an extended period of low-volatility consolidation. The 1h RSI at 30.52 is approaching oversold levels, and the MACD is showing a slight bearish lean with the histogram printing small negative bars — suggesting modest downside pressure without strong conviction. The daily chart offers a more nuanced picture: TRX has held up relatively better than peers on a structural basis, with the EMA200 at $0.32 providing underlying support and the daily RSI at 46.98 near neutral. The $0.326–$0.327 area is the key short-term support level; a bounce from here toward $0.332–$0.334 is plausible given the proximity to oversold conditions on the shorter timeframes, but the broader trend lacks momentum to support a strong directional move.
Altcoin Outlook
The overall altcoin picture for August 3, 2026 is one of broad weakness and consolidation, with the majority of coins trading below their key short-to-medium-term EMAs and RSIs hovering in the 30–50 range — consistent with the BD Pulse Score of 34/100 signaling a bearish market phase. BNB stands out as the only coin with a constructive daily structure, buoyed by fundamental catalysts including its recent token burn and ETF-related news, while SOL, DOGE, LTC, and TRX are all pressing against or near near-term support levels with limited technical evidence of a durable reversal. With BTC dominance entrenched above 54% and the Long/Short account ratio showing 67.1% longs — a potentially crowded positioning that creates downside risk if support levels crack — the risk of a further flush remains elevated. Traders should prioritize watching the $73 level in SOL, $1.05 in XRP, and $43 in LTC as critical support markers that will define whether this consolidation transitions into a deeper correction or sets the stage for recovery.
Disclaimer: This analysis is for informational purposes only and does not constitute financial advice. Cryptocurrency markets are highly volatile and unpredictable. All trading decisions should be made based on your own research and risk tolerance. Block Digest is not responsible for any financial losses incurred as a result of acting on this content.
Stay Ahead of the Market
Follow BlockDigest for crypto market intelligence, research and real-time updates.