
Market Overview
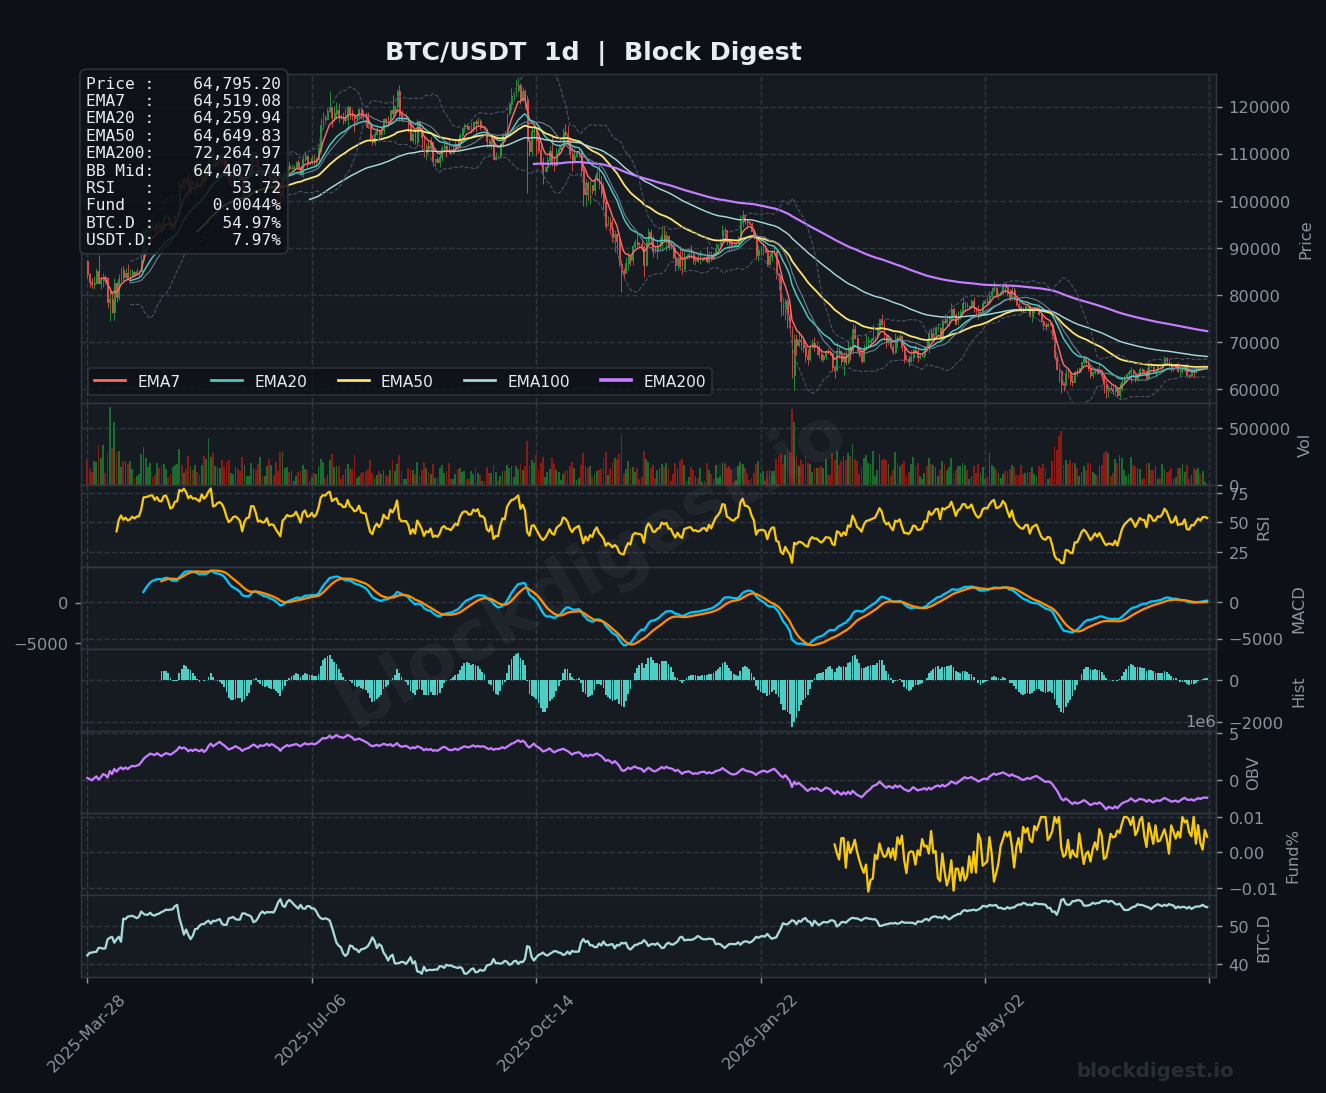
Bitcoin is currently trading around $64,795–$65,117, navigating a technically significant zone where the daily EMA cluster has converged tightly. On the daily timeframe, price sits just above the EMA7 ($64,519), EMA20 ($64,260), and EMA50 ($64,650), with all three compressed within a roughly $400 range — a setup that historically precedes a directional expansion. The Bollinger Band midline on the daily sits at $64,408, and price is pressing above it, suggesting a tentative lean toward the upper band. Notably, the EMA200 on the daily remains far overhead at $72,265, a persistent reminder that the macro trend is still recovering from a prolonged downtrend that dominated much of early 2026.
Multi-Timeframe Confluence
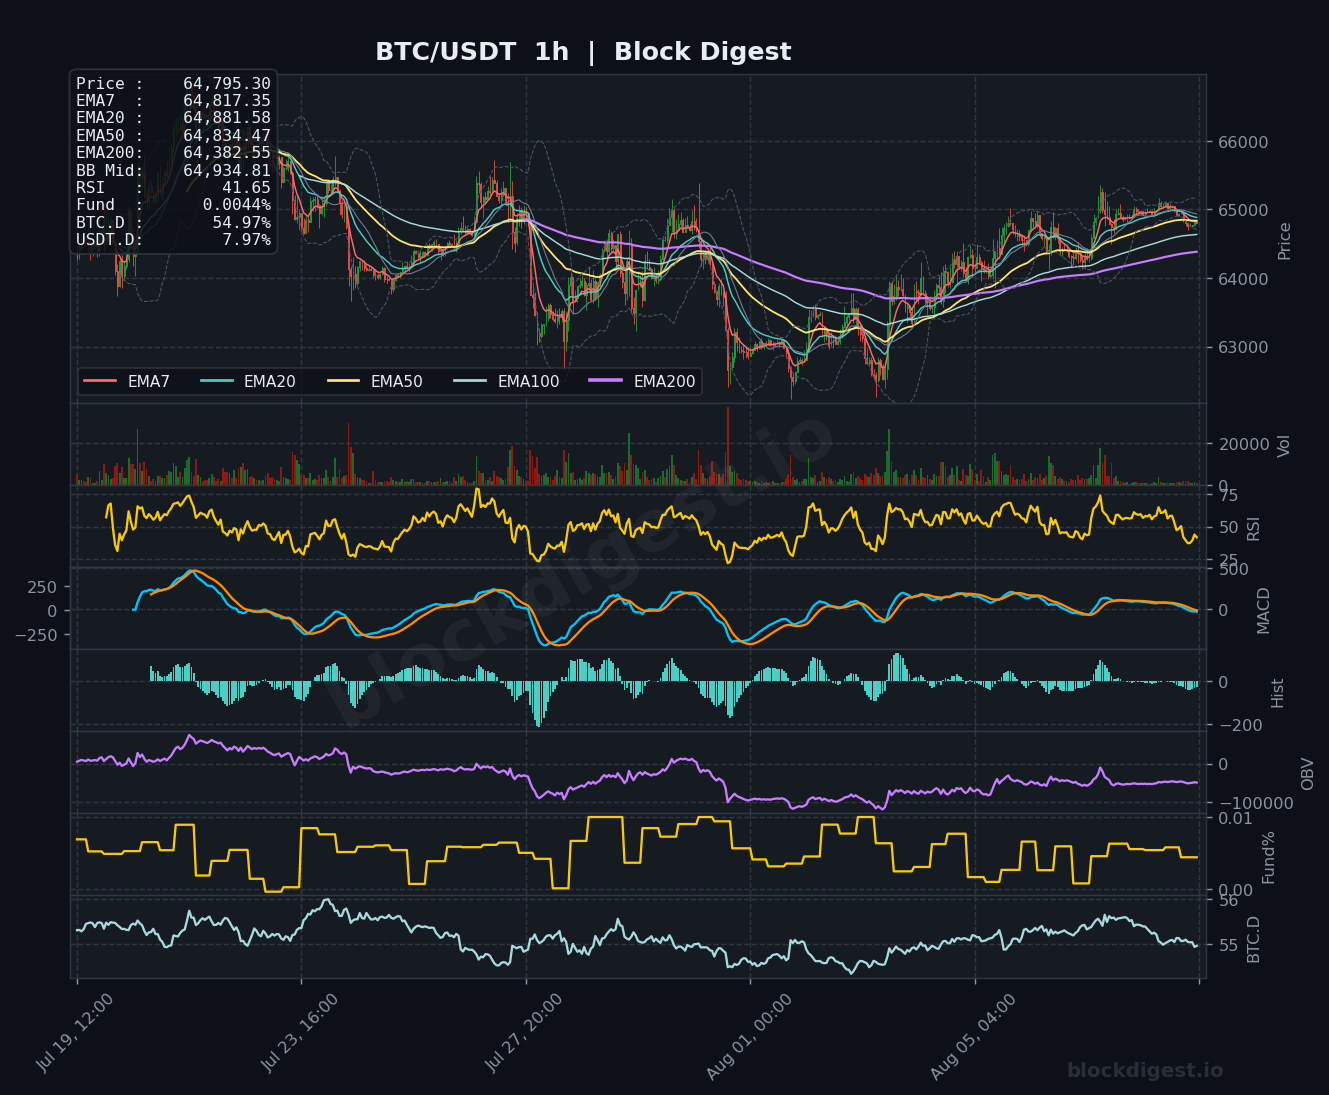
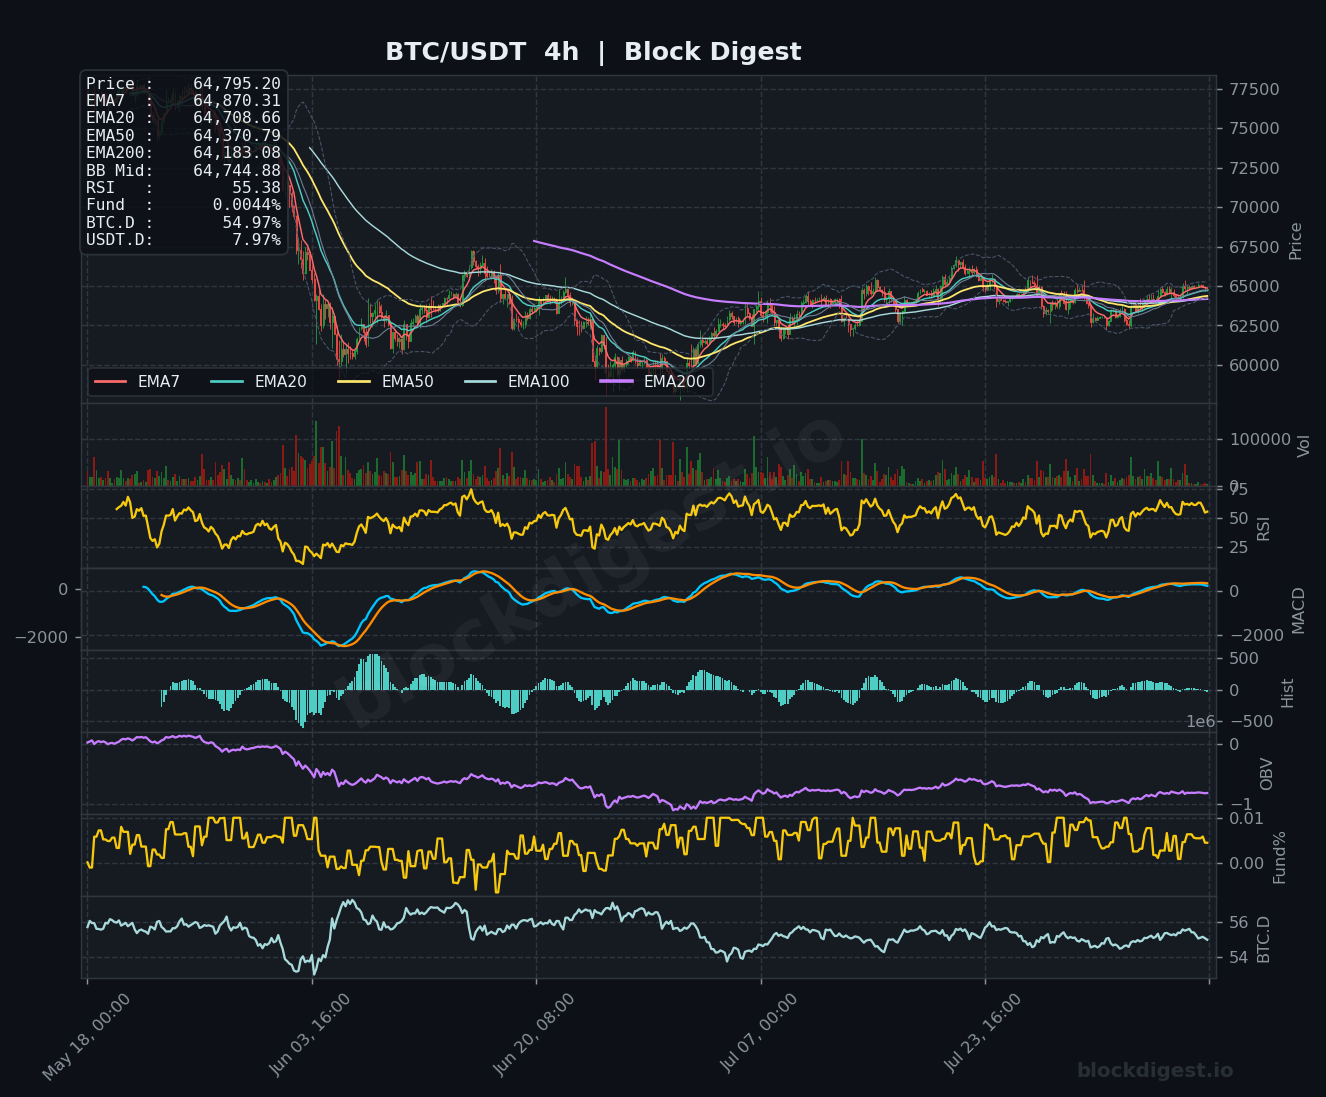
Across timeframes, the structure is cautiously constructive but lacks decisive confirmation. On the 4h chart, price is trading above all short-term EMAs (EMA7 at $64,870, EMA20 at $64,709, EMA50 at $64,371, EMA200 at $64,183), with the full EMA stack in a bullish alignment — a positive sign for near-term continuation. The 1h chart tells a slightly more conflicted story: price at $64,795 is trading below the EMA7 ($64,817), EMA20 ($64,882), and EMA50 ($64,834), suggesting short-term overhead pressure right at the EMA cluster. The daily and 4h timeframes broadly agree on a recovering structure, while the 1h signals the market is consolidating just under local resistance — a setup that could resolve either way depending on the next catalyst.
Key Levels to Watch
- Resistance: $65,313 — the 7-day high and nearest overhead ceiling where sellers have recently been active; $65,500–$65,600 — the upper Bollinger Band region on the daily, likely to cap initial breakout attempts; $67,000–$67,500 — a broader supply zone visible on the 4h chart from prior consolidation, and a logical target should the current range resolve upward.
- Support: $64,183–$64,260 — the 4h EMA200 and daily EMA20 act as a layered confluence support; $63,500 — a mid-range structural floor that contained selling pressure during the most recent rebound; $62,270 — the 7-day low and a critical demand zone whose breach would signal a more significant shift in short-term sentiment.
Momentum & On-Chain Signals
The daily RSI at 53.72 sits comfortably in neutral territory, consistent with a market that has recovered from oversold extremes but has not yet built sufficient momentum to claim overbought status — leaving room for upside without an immediate mean-reversion risk. Block Digest’s proprietary BD Pulse Score reinforces this view at 65/100 (Bullish), though the BD Extreme Index at +1.00σ flags that price is approaching overbought conditions on a shorter-term basis, warranting some caution on aggressive long entries here. The 4h MACD lines are converging near zero with a flattening histogram, indicating waning short-term momentum, while the 1h MACD histogram has turned marginally negative — consistent with the current price stall just below the hourly EMA cluster. OBV on the daily has been in a gradual downtrend since the 2025 highs, suggesting that volume-weighted accumulation has not yet fully confirmed the current price recovery.
BTC Dominance & Market Sentiment
BTC dominance is holding at 54.97–54.98%, a level that has been relatively stable in recent weeks after declining from highs above 56% earlier in the year. This sustained dominance suggests the market has not yet entered a broad altcoin rotation phase, keeping capital relatively concentrated in Bitcoin. USDT dominance at 7.97% reflects a meaningful sidelined cash position, which could serve as dry powder for a breakout if sentiment shifts decisively bullish — but also signals lingering risk aversion that is keeping a ceiling on enthusiasm.
Risk Scenarios
- Bullish case: A clean hourly close above $65,313 with expanding volume would confirm a breakout from the current consolidation range, opening a path toward the $65,500–$65,600 upper Bollinger Band, with a more ambitious target near $67,000 on the 4h timeframe if momentum builds.
- Bearish case: Failure to hold the $64,183–$64,260 confluence support zone on a 4h close would expose BTC to a retest of $63,500, and a breach of the $62,270 weekly low would represent a more serious structural deterioration, potentially targeting sub-$61,000 levels.
Outlook
The overall setup on August 9, 2026 is cautiously bullish on a 24–48 hour horizon, with the 4h EMA alignment and BD Pulse Score of 65 providing a mild tailwind, but the convergence of short-term resistance at the 1h EMA cluster and the BD Extreme Index nudging overbought territory (~+1.00σ) calls for measured positioning rather than aggressive momentum chasing. The next 24 hours hinge on whether BTC can reclaim and hold above the $65,000–$65,313 zone on a meaningful close, which would shift the balance of probabilities toward the upper Bollinger Band. A failure to do so keeps the range-bound thesis alive between $62,270 and $65,313. Traders should watch the 4h EMA200 at $64,183 as the pivotal bull/bear line in the sand — its loss would materially weaken the current recovery narrative.
—
Disclaimer: This analysis is for informational purposes only and does not constitute financial advice. Cryptocurrency markets are highly volatile and unpredictable. All trading decisions should be made based on your own research and risk tolerance. Block Digest is not responsible for any financial losses incurred as a result of acting on this content.
Stay Ahead of the Market
Follow BlockDigest for crypto market intelligence, research and real-time updates.


