BTC Daily Analysis — May 11, 2026
BTC Daily Analysis – May 11, 2026
Market Overview
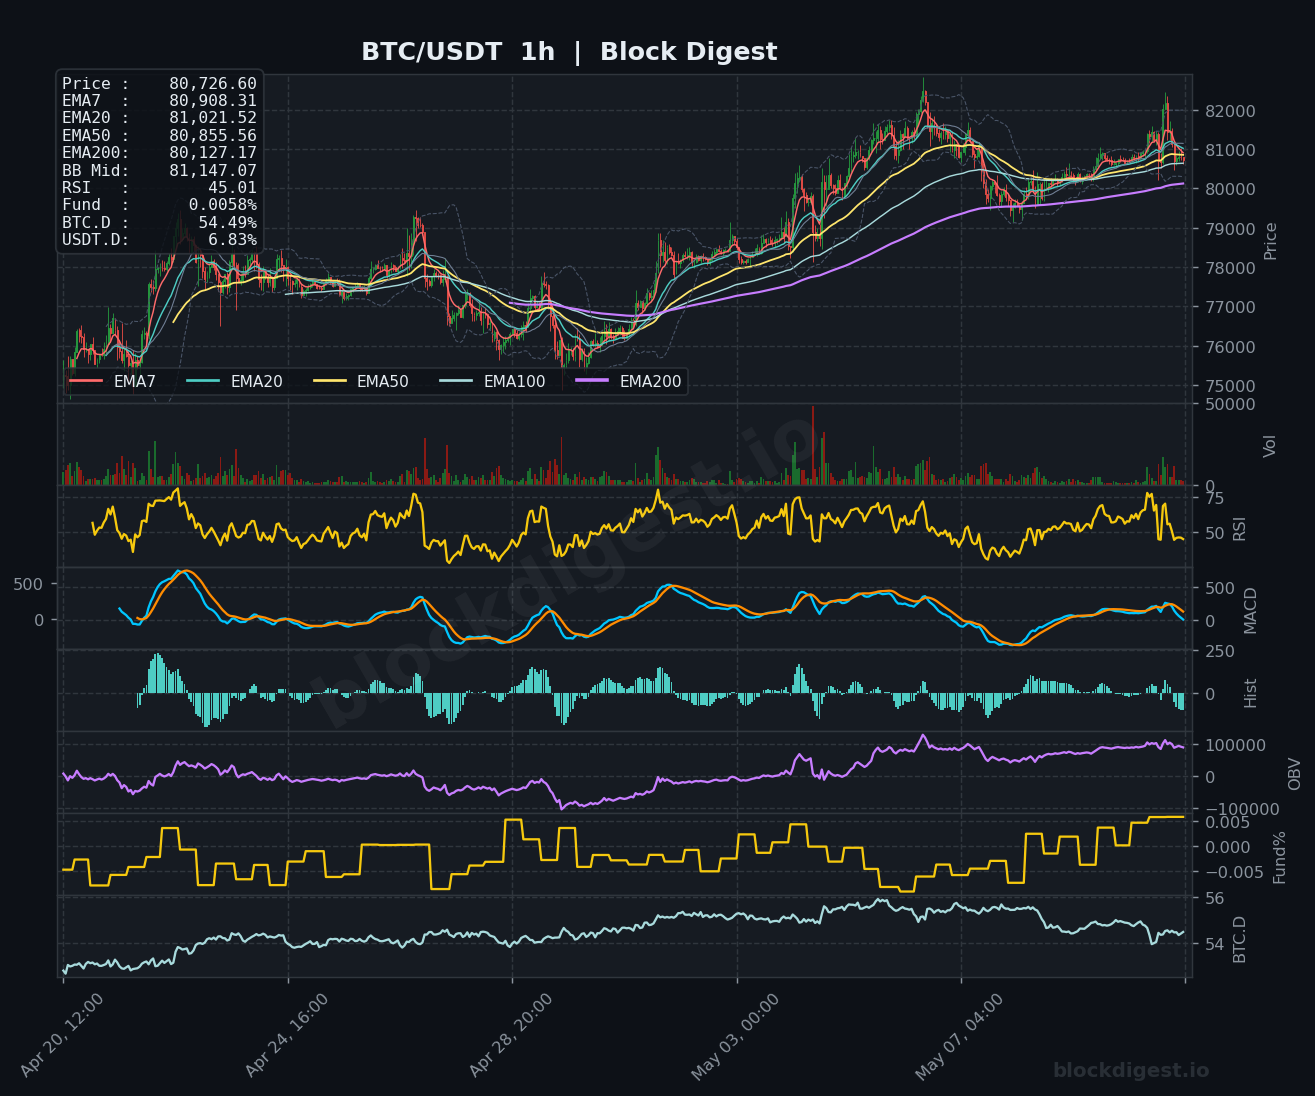
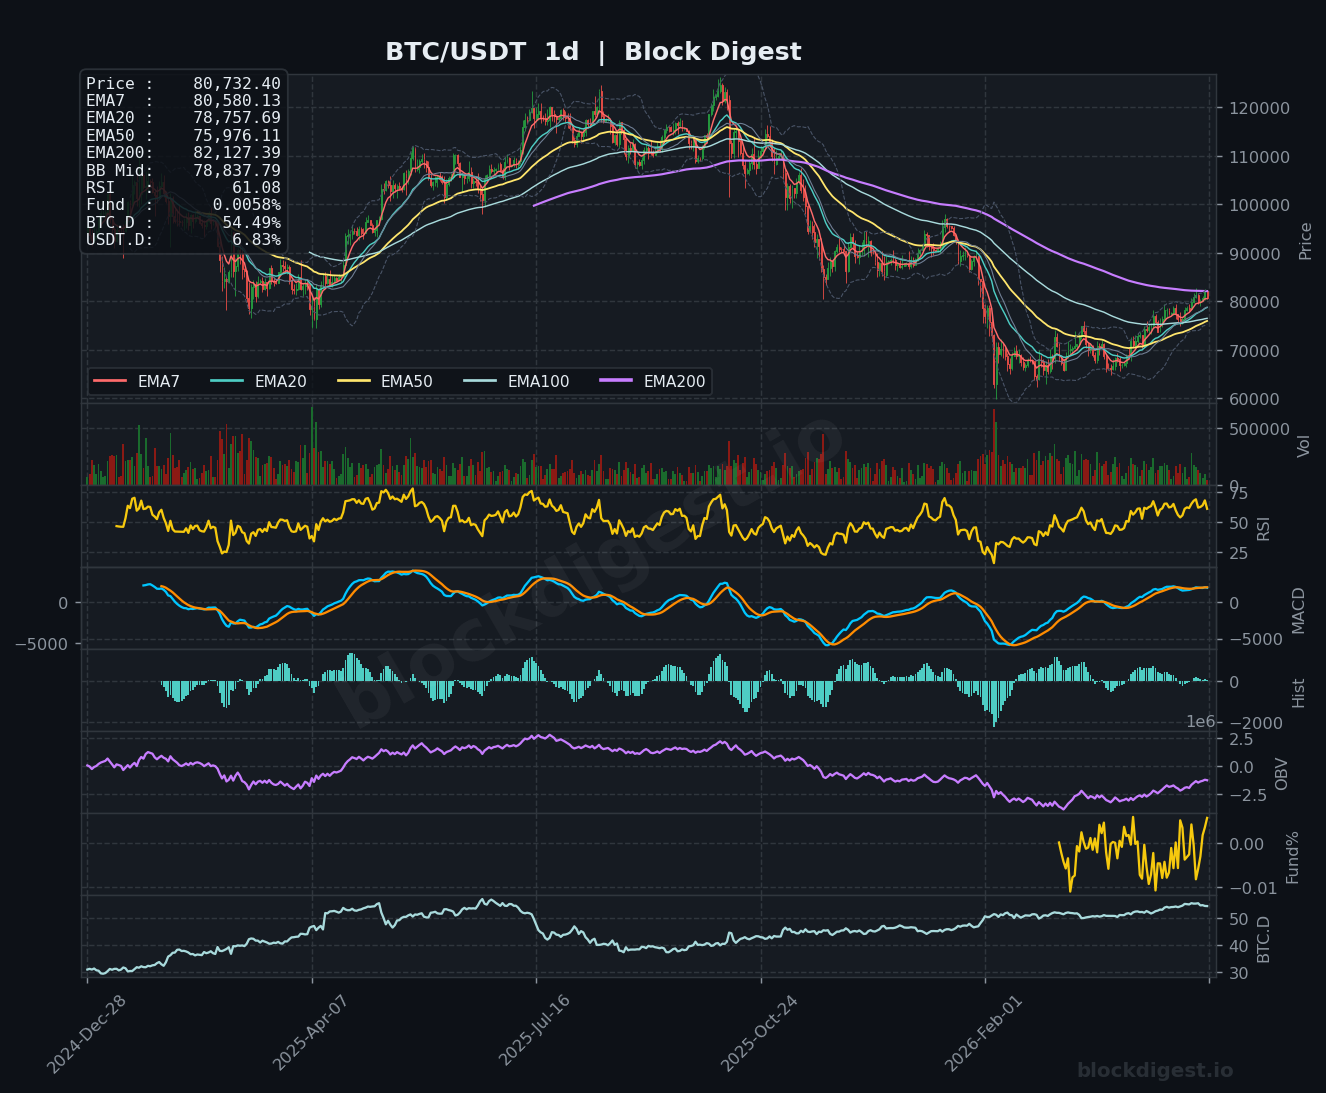
Bitcoin is currently trading at $80,726, positioned in a critical consolidation zone just below the Bollinger Band midline at $81,147 across the 1-hour timeframe. Price action remains tightly compressed above the short-term EMAs (7, 20, 50) which are converging near $80,855-$81,021, suggesting imminent directional resolution. On the daily timeframe, BTC has established a clear recovery structure after bottoming near $65,000, with price now testing the EMA50 at $75,976 from above, though still trading below the EMA200 at $82,127—a key resistance that defines the long-term bearish trend. The daily chart shows a constructive higher-low pattern forming, but confirmation of trend reversal requires a decisive break and hold above $82,000.
Multi-Timeframe Confluence
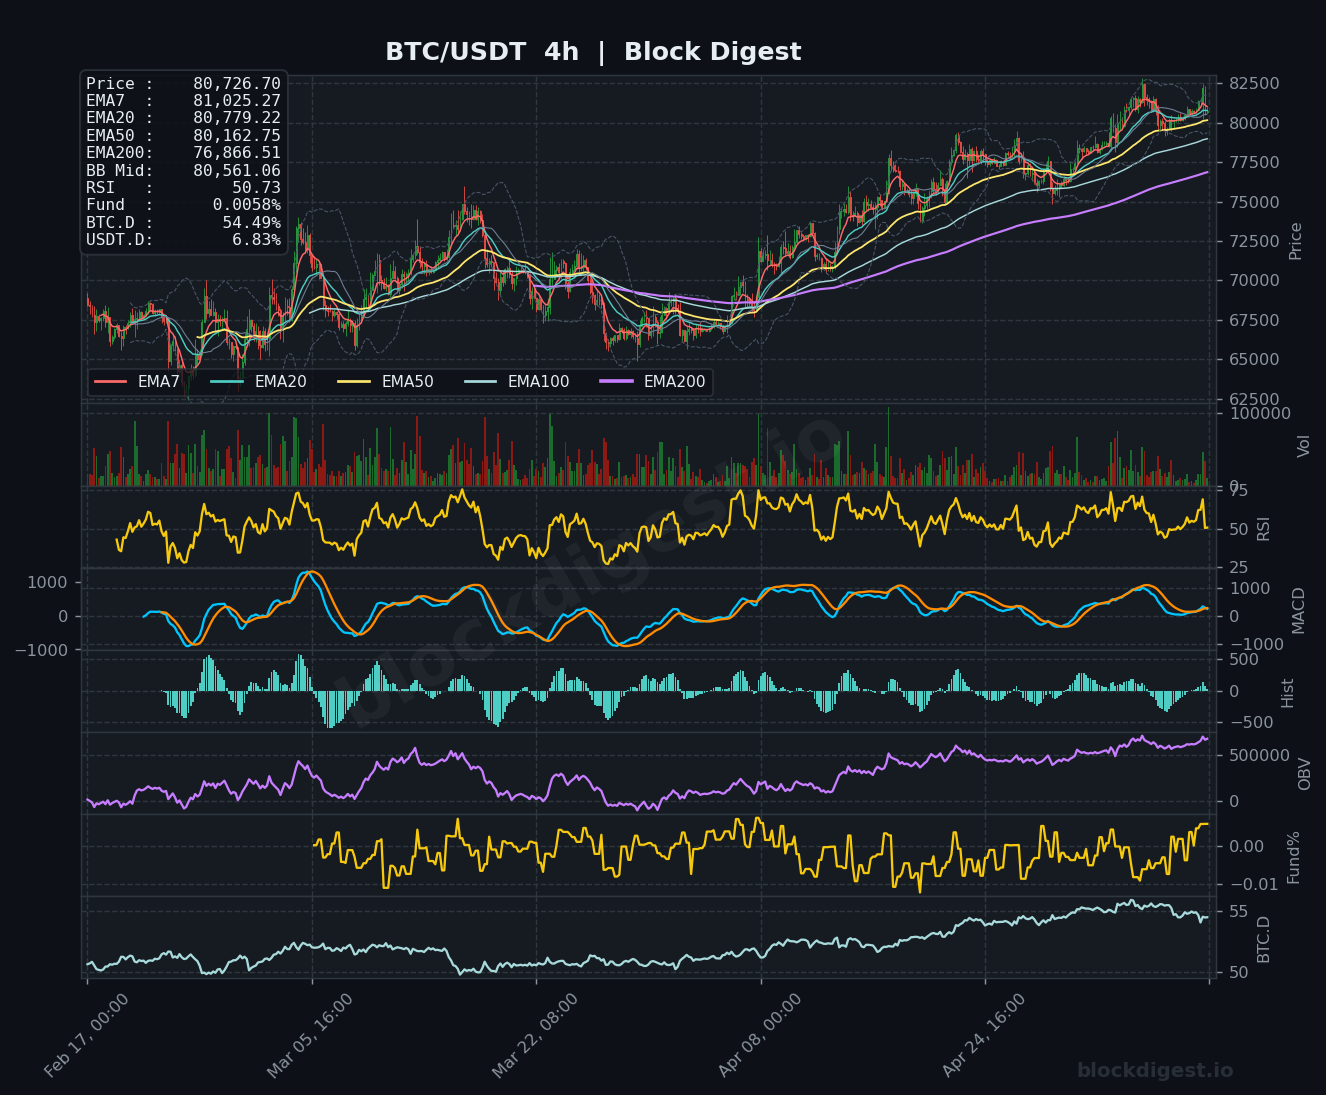
Multiple timeframes reveal tentative bullish alignment with notable divergences that warrant caution. The 1-hour chart shows price consolidating in a tight range between $80,500-$81,200 with all short-term EMAs flattening, indicating indecision after recent upward momentum. The 4-hour timeframe provides stronger bullish support, with price trading above the EMA7 ($81,025), EMA20 ($80,779), and EMA50 ($80,162) in proper bullish sequence, while the EMA200 at $76,866 offers substantial long-term support. However, the daily timeframe presents a more complex picture: while the EMA7 ($80,580) and EMA20 ($78,757) have turned upward, price remains capped below the critical EMA200 resistance at $82,127. The $80,000-$80,500 zone represents confluent support across all three timeframes, making it the crucial area that must hold to maintain the current recovery structure.
Key Levels to Watch
Resistance:
- $81,147 – Bollinger Band midline on 1h chart and immediate overhead resistance; break above signals renewed short-term momentum
- $82,127 – Daily EMA200 and major psychological resistance; decisive reclaim would mark first step toward trend reversal confirmation
- $82,500-$83,000 – Previous consolidation zone and volume shelf visible on daily chart; represents next significant supply area if momentum extends
Support:
- $80,162 – 4-hour EMA50 and current base of consolidation range; immediate defense level for intraday bulls
- $78,837 – Daily Bollinger Band midline and EMA20 confluence; critical support zone that underpins the entire recovery structure
- $76,866 – 4-hour EMA200 and substantial volume support node; loss of this level would invalidate near-term bullish thesis and target retest of $75,000
Momentum & On-Chain Signals
RSI readings show moderate bullish momentum without overbought extremes: 45.01 on the 1-hour, 50.73 on the 4-hour, and 61.08 on the daily timeframe. The daily RSI holding above 60 is constructive, suggesting underlying strength, while lower timeframes remain neutral with room for expansion in either direction. MACD on the 4-hour chart shows positive histogram values with lines converging near the zero line, indicating weakening bearish pressure but no confirmed bullish crossover yet—the 1-hour MACD similarly hovers near equilibrium. On-Balance Volume (OBV) across all timeframes shows gradual accumulation with the daily OBV making higher lows during recent price consolidation, a positive divergence suggesting institutional accumulation during dips. The Funding Rate at 0.0058% remains modestly positive but well below excessive levels, indicating balanced derivatives positioning without overheated speculation. The absence of extreme funding suggests room for further upside before encountering significant leverage-induced resistance.
BTC Dominance & Market Sentiment
Bitcoin dominance currently stands at 54.49%, maintaining elevated levels that indicate continued capital concentration in BTC rather than altcoin rotation. This defensive positioning typically emerges during uncertain market conditions when investors favor crypto’s blue-chip asset over higher-risk alternatives. USDT dominance at 6.83% remains relatively stable and elevated, suggesting market participants are keeping considerable dry powder on the sidelines rather than committing fully to risk-on positioning. The combination of high BTC.D and elevated USDT.D reflects a cautious market stance where Bitcoin is attracting incremental capital, but broad-based crypto enthusiasm remains subdued—this environment typically favors BTC outperformance but limits explosive upside moves until broader market confidence returns.
Risk Scenarios
Bullish case: A decisive 4-hour candle close above $82,127 (daily EMA200) with accompanying volume expansion would confirm breakout conditions and likely trigger momentum acceleration toward $83,000-$84,000. Sustained hold above this level, particularly if the daily EMA50 crosses above the EMA200 in coming sessions, would validate trend reversal and target the $87,000-$90,000 range where significant prior consolidation occurred.
Bearish case: Failure to reclaim $82,000 followed by breakdown below $78,837 (daily BB mid and EMA20) would invalidate the recovery structure and expose the $75,976 daily EMA50, with continuation breakdown targeting $73,000-$74,000. Loss of $76,866 (4h EMA200) would signal bearish control reestablished and open path toward retesting the $70,000 psychological support and potentially the $65,000-$67,000 structural low established earlier this year.
Outlook
Bitcoin remains structurally positioned at a critical inflection point, with the immediate trajectory dependent on the ability to reclaim and hold above the $82,000-$82,127 resistance zone. The technical setup suggests coiling price action with compressed volatility, typically preceding significant directional moves. In the next 24-48 hours, watch for expansion above $81,147 (1h BB mid) on rising volume as the first signal of bullish resolution, while breakdown below $80,162 would indicate failed breakout and reversion toward $78,837 support. The combination of improving daily momentum (RSI >60), positive OBV divergence, and proper 4-hour EMA sequencing favors eventual upside resolution, but confirmation requires breaking the critical $82,127 barrier. Until then, range-bound trading between $79,000-$82,000 remains the path of least resistance, with the true directional commitment likely emerging only after definitive breakout or breakdown of this consolidation structure.
Disclaimer: This analysis is for informational purposes only and does not constitute financial advice. Cryptocurrency markets are highly volatile and unpredictable. All trading decisions should be made based on your own research and risk tolerance. Block Digest is not responsible for any financial losses incurred as a result of acting on this content.