Altcoin Daily Analysis — April 27, 2026
# Altcoin Daily Roundup – April 27, 2026
## Market Context
The altcoin market is showing mixed signals as we close out the weekend trading session, with Bitcoin dominance at 54.46% and USDT dominance at 7.10% suggesting moderate risk appetite across the crypto space. Most major altcoins are trading near their short-term moving averages with subdued momentum indicators, reflecting a consolidation phase following recent volatility. The overall environment appears cautiously neutral, with traders awaiting clearer directional catalysts before committing to stronger positions.
## Solana (SOL)
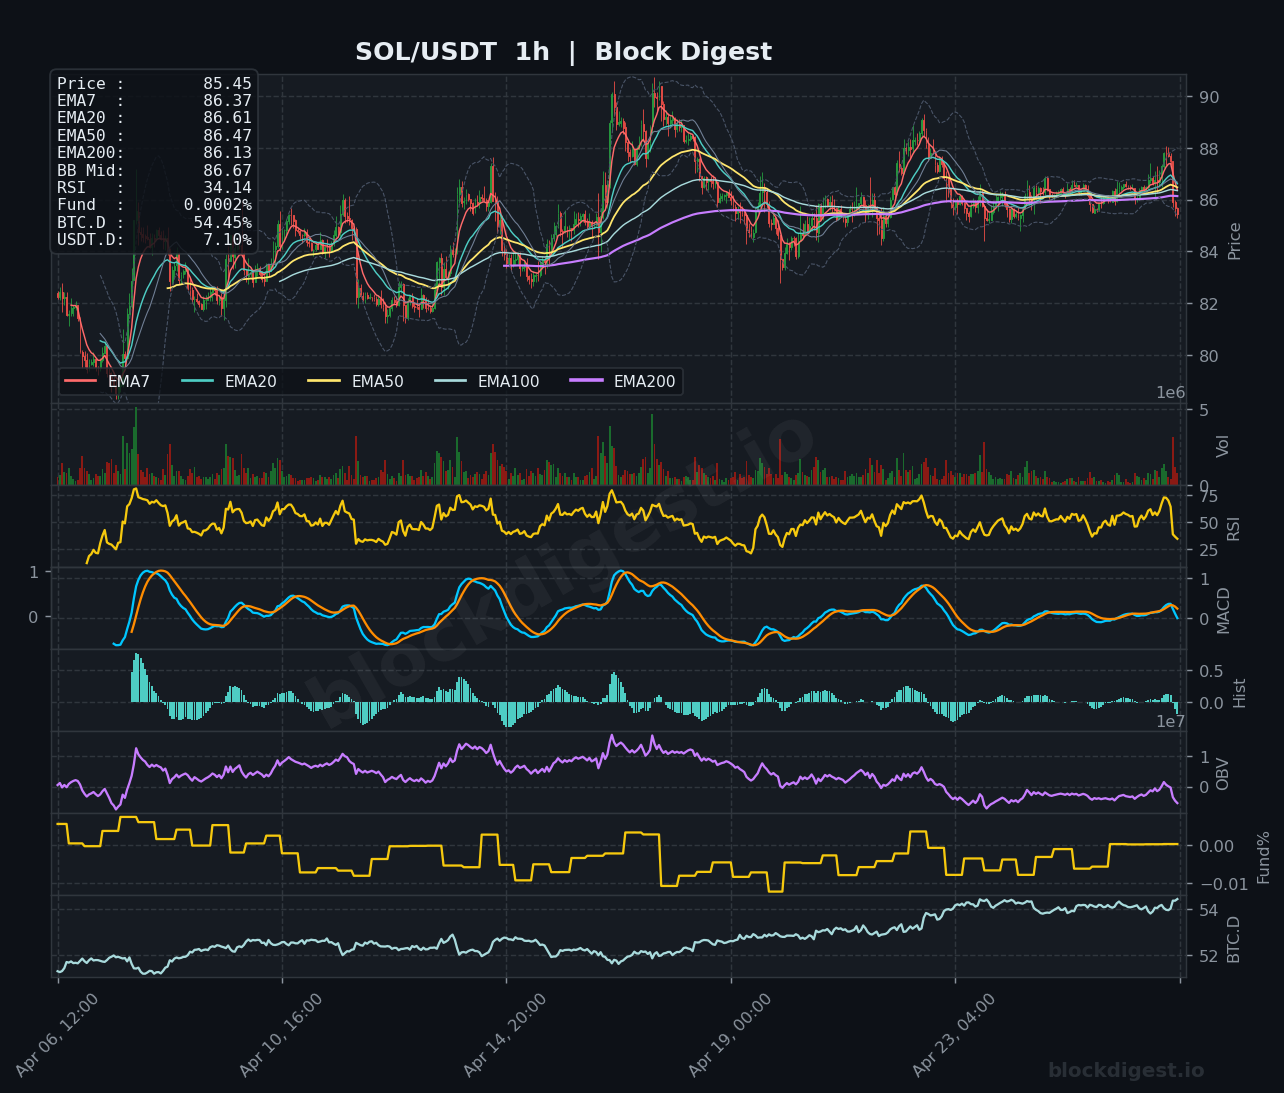
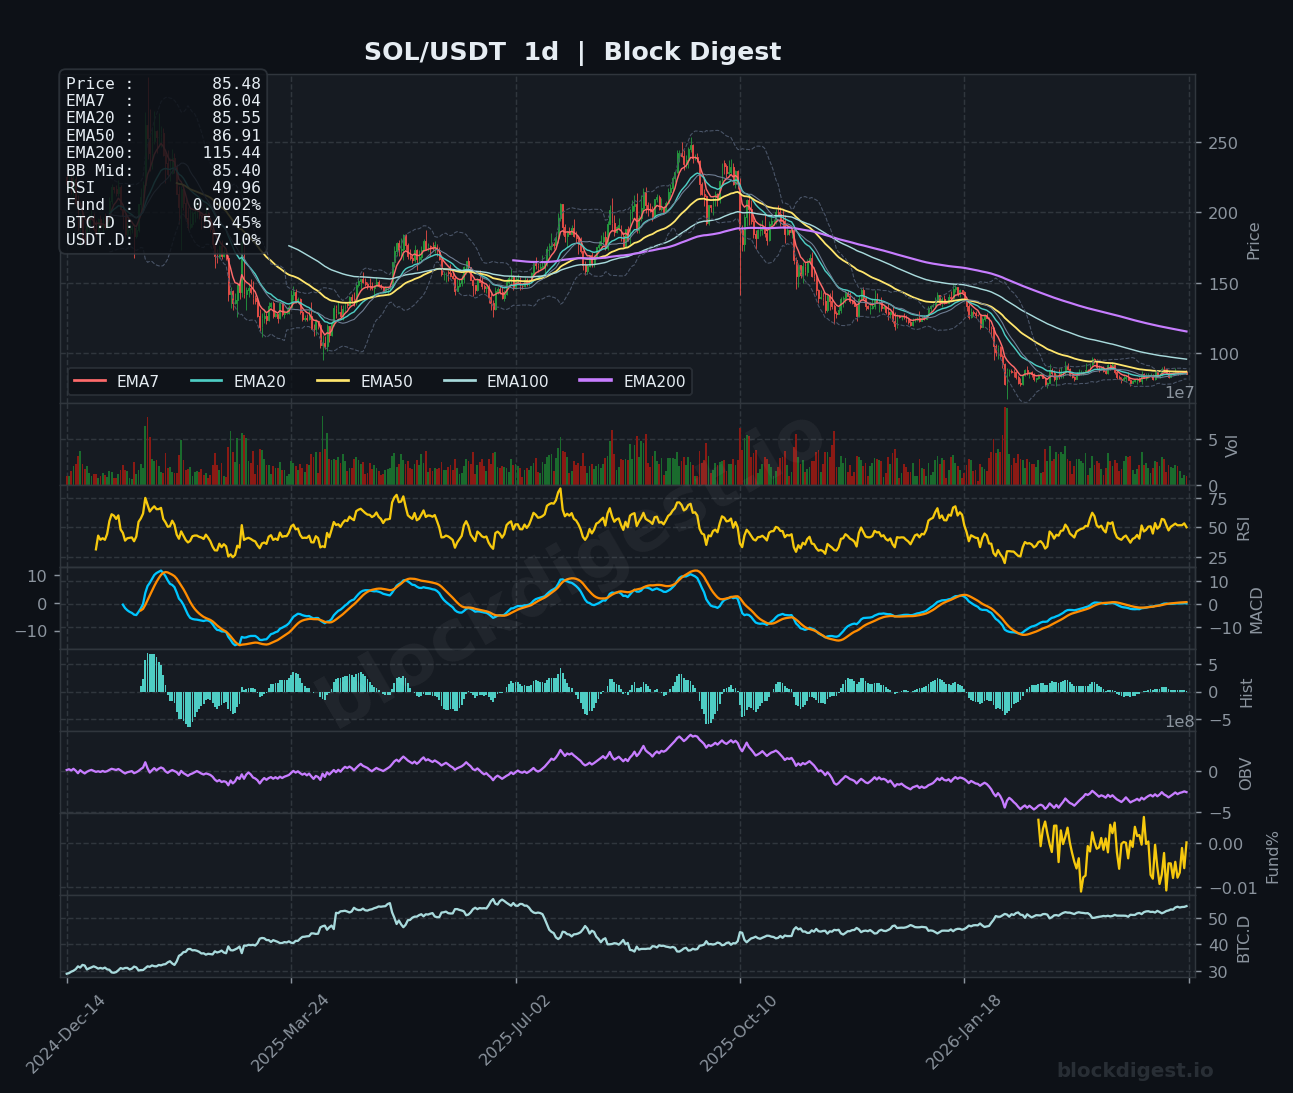
Solana is trading at $85.45, positioned just below its EMA7 at $86.37 and showing signs of consolidation near critical support levels. The price has been rejected from the $88 area multiple times in recent sessions, forming a minor resistance zone, while support appears to be holding around $85.00. The RSI sits at 34.14, indicating neither oversold nor overbought conditions but suggesting weakening momentum, while the MACD remains slightly negative with minimal divergence. On higher timeframes, SOL appears trapped between the EMA50 at $86.47 and the EMA200 at $86.13, creating a compressed volatility environment that could precede a larger move. The daily chart shows price has declined significantly from previous highs around $250, with current levels representing a substantial retracement where buyers may eventually step in for longer-term positioning.
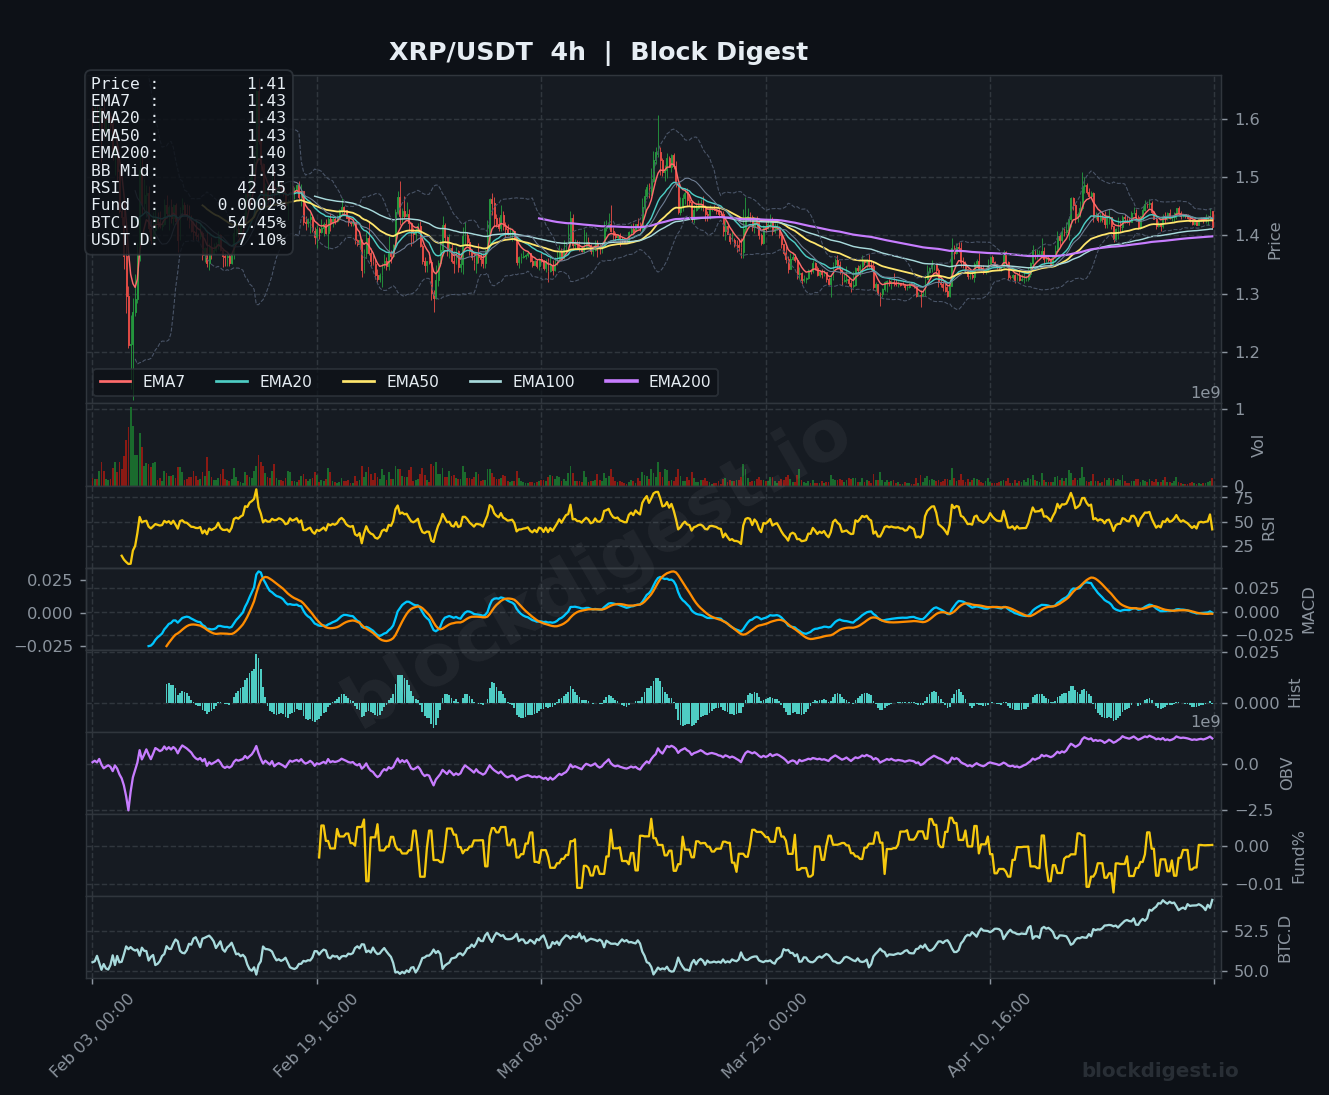
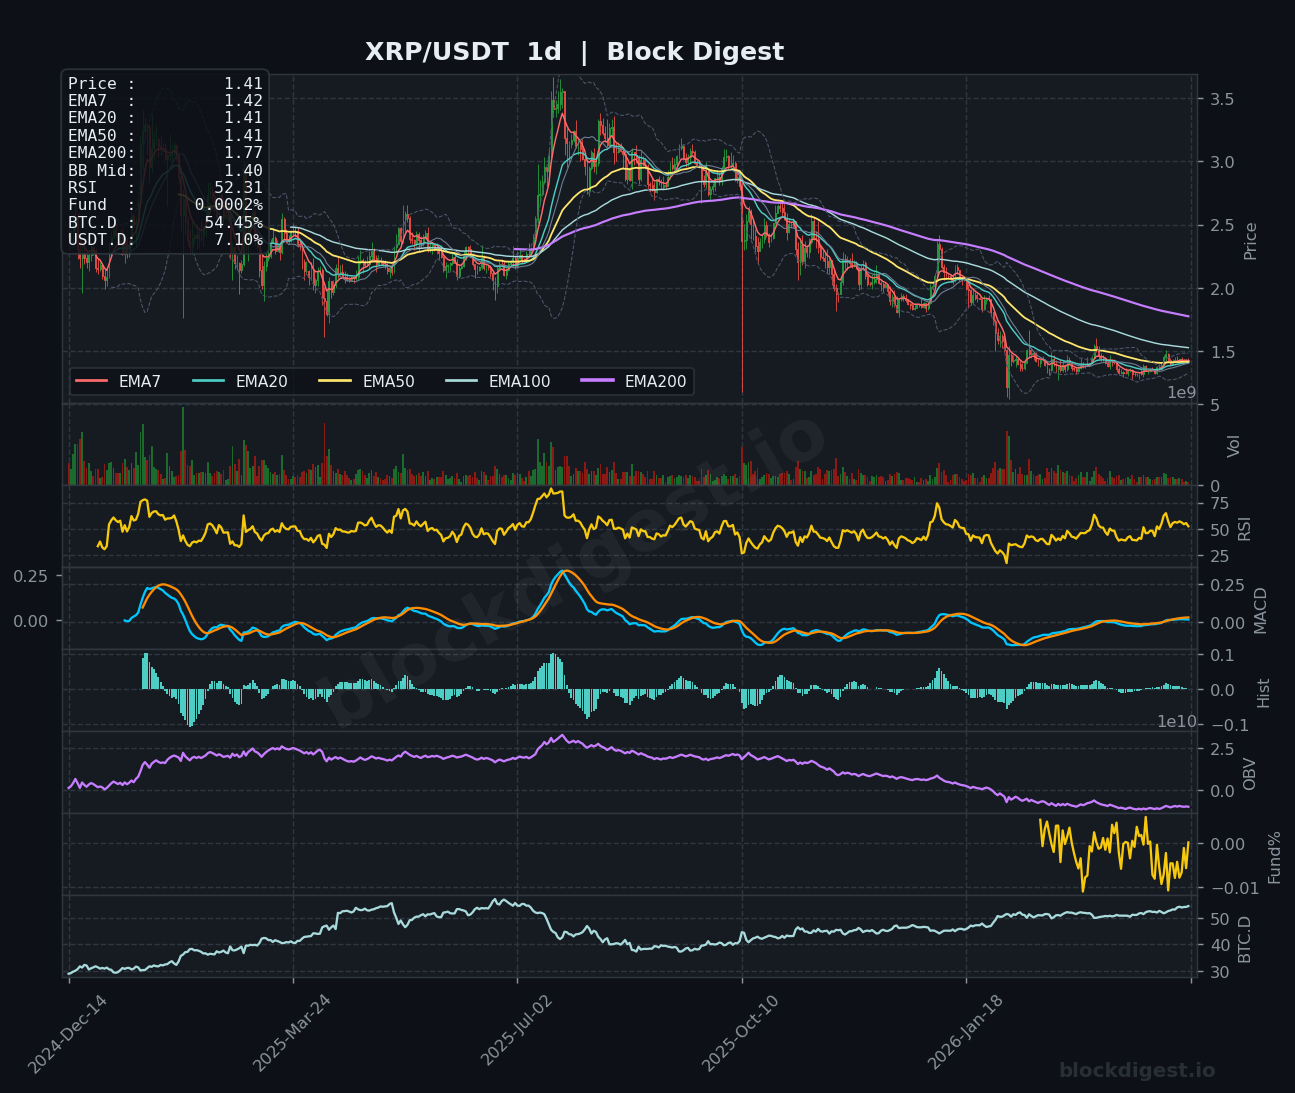
## XRP (XRP)
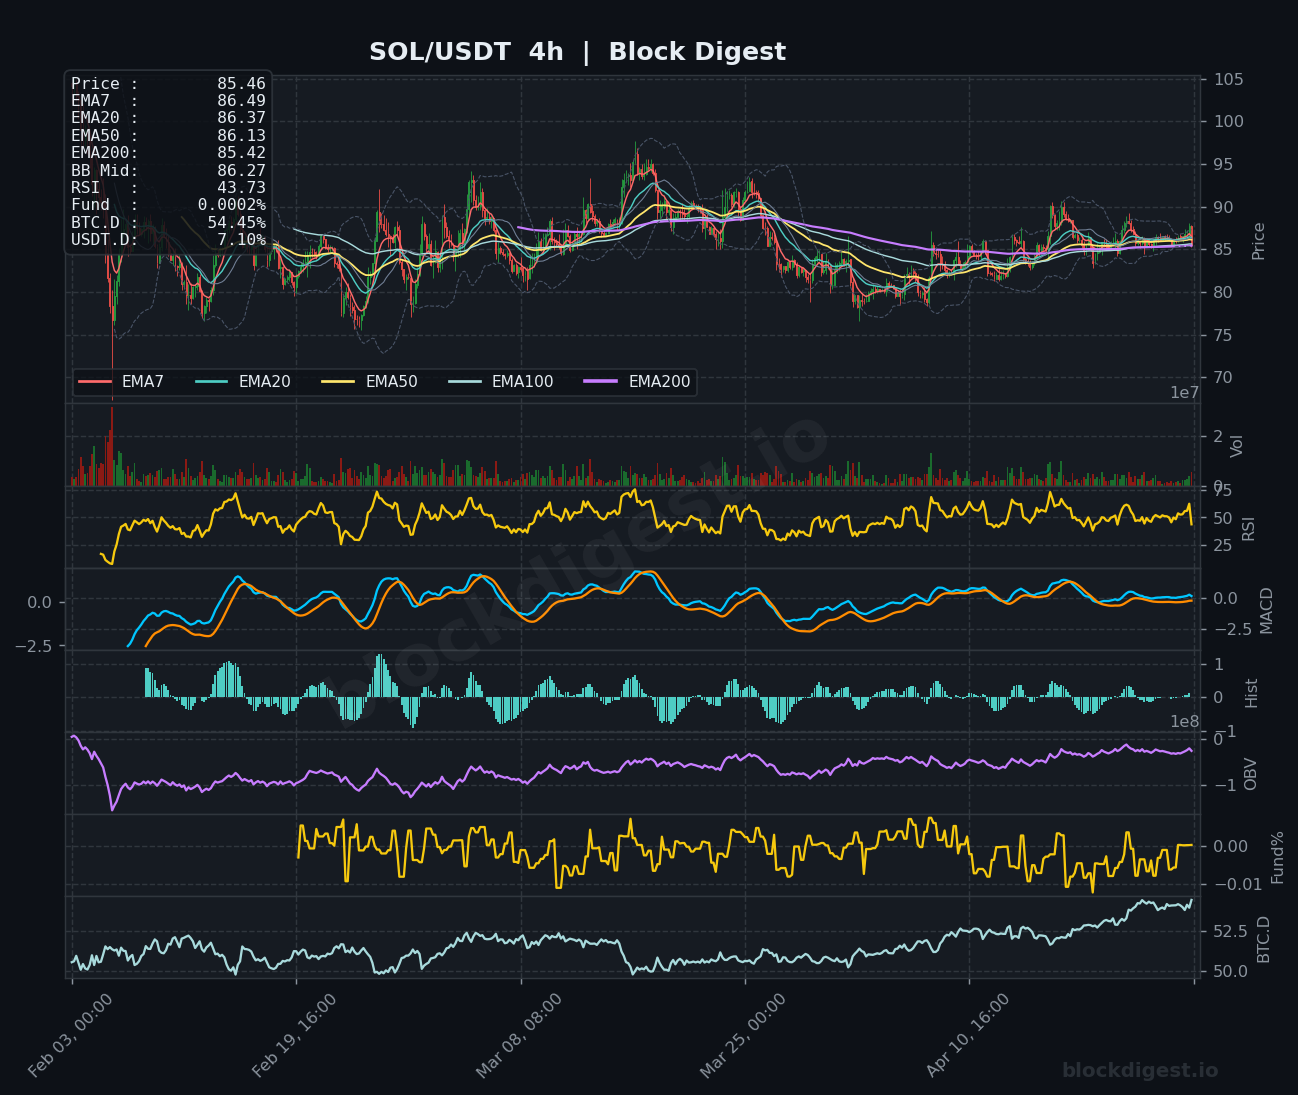
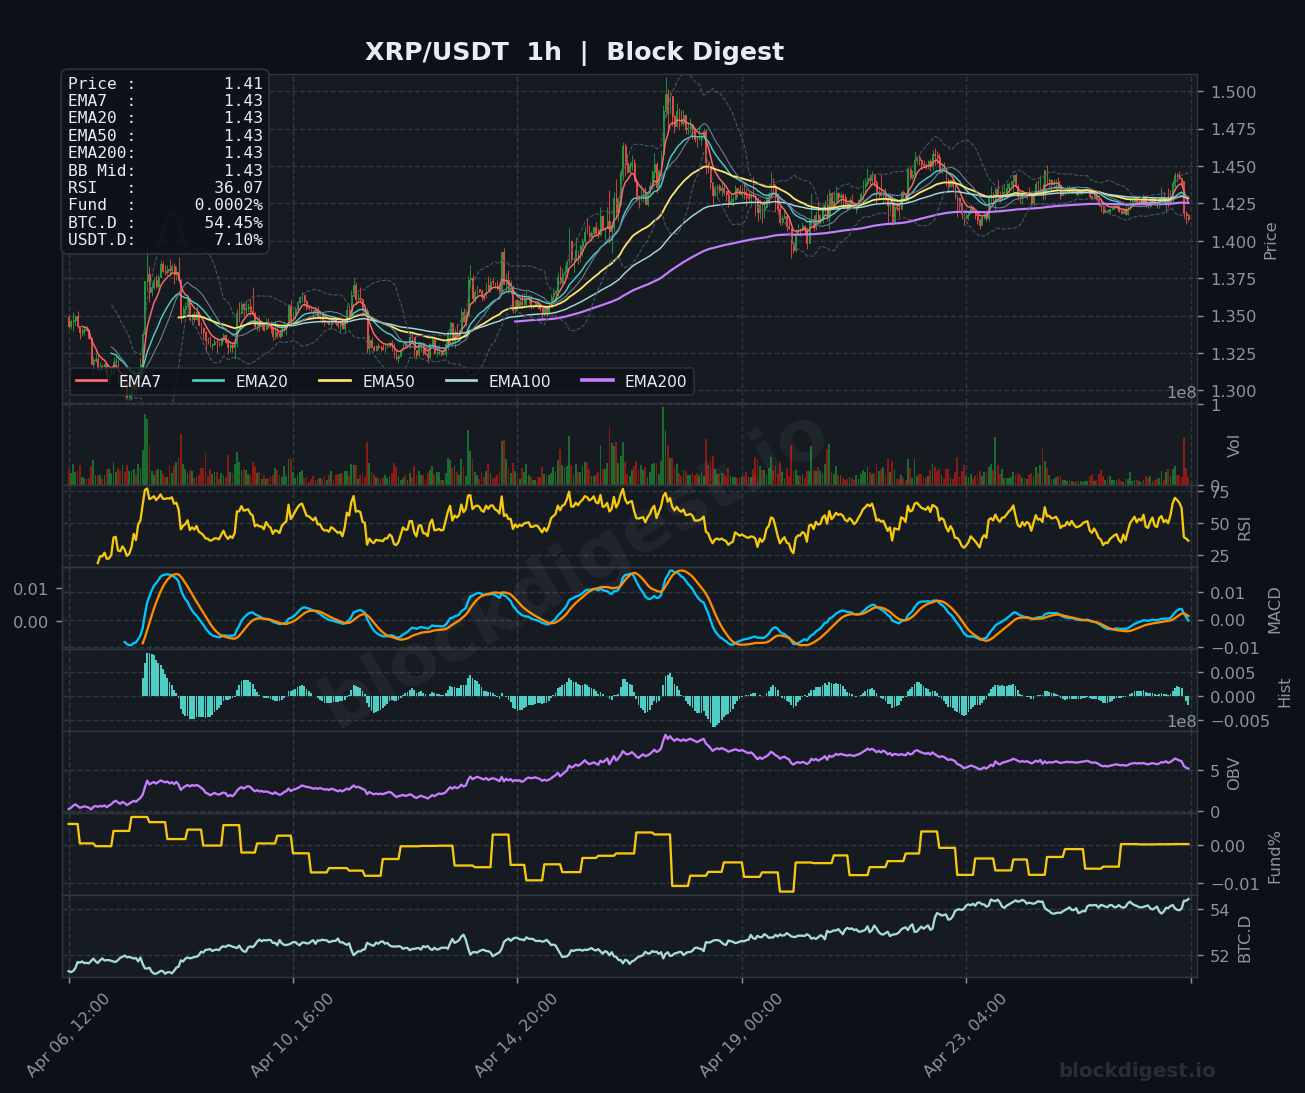
XRP is currently priced at $1.41, trading in a tight range with all major EMAs converging around the $1.43 level, creating a coiled spring setup. The 1-hour chart shows price recently testing below support at $1.40 before recovering slightly, while the RSI at 36.07 suggests neutral momentum with room for movement in either direction. The MACD histogram is near the zero line with both lines converging, indicating a potential inflection point approaching. On the 4-hour timeframe, XRP has been consolidating in a narrowing range between $1.35-$1.50 for several weeks, with decreasing volume suggesting indecision among market participants. The daily chart reveals a longer-term downtrend from highs above $3.50, but the recent stabilization around current levels and the convergence of multiple EMAs suggests a potential accumulation zone forming.
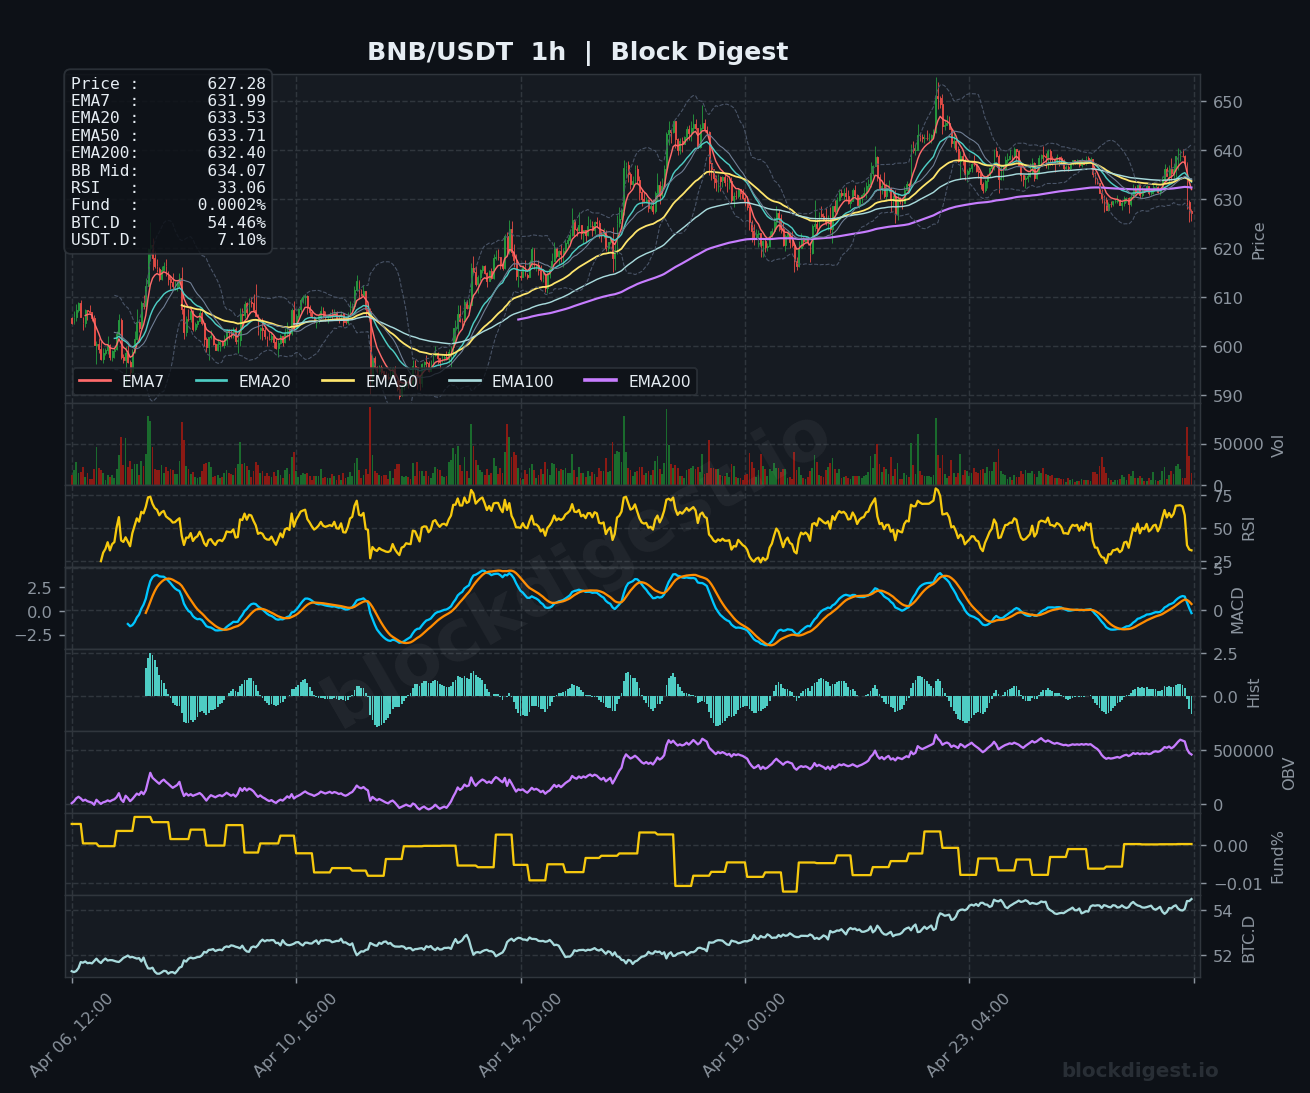
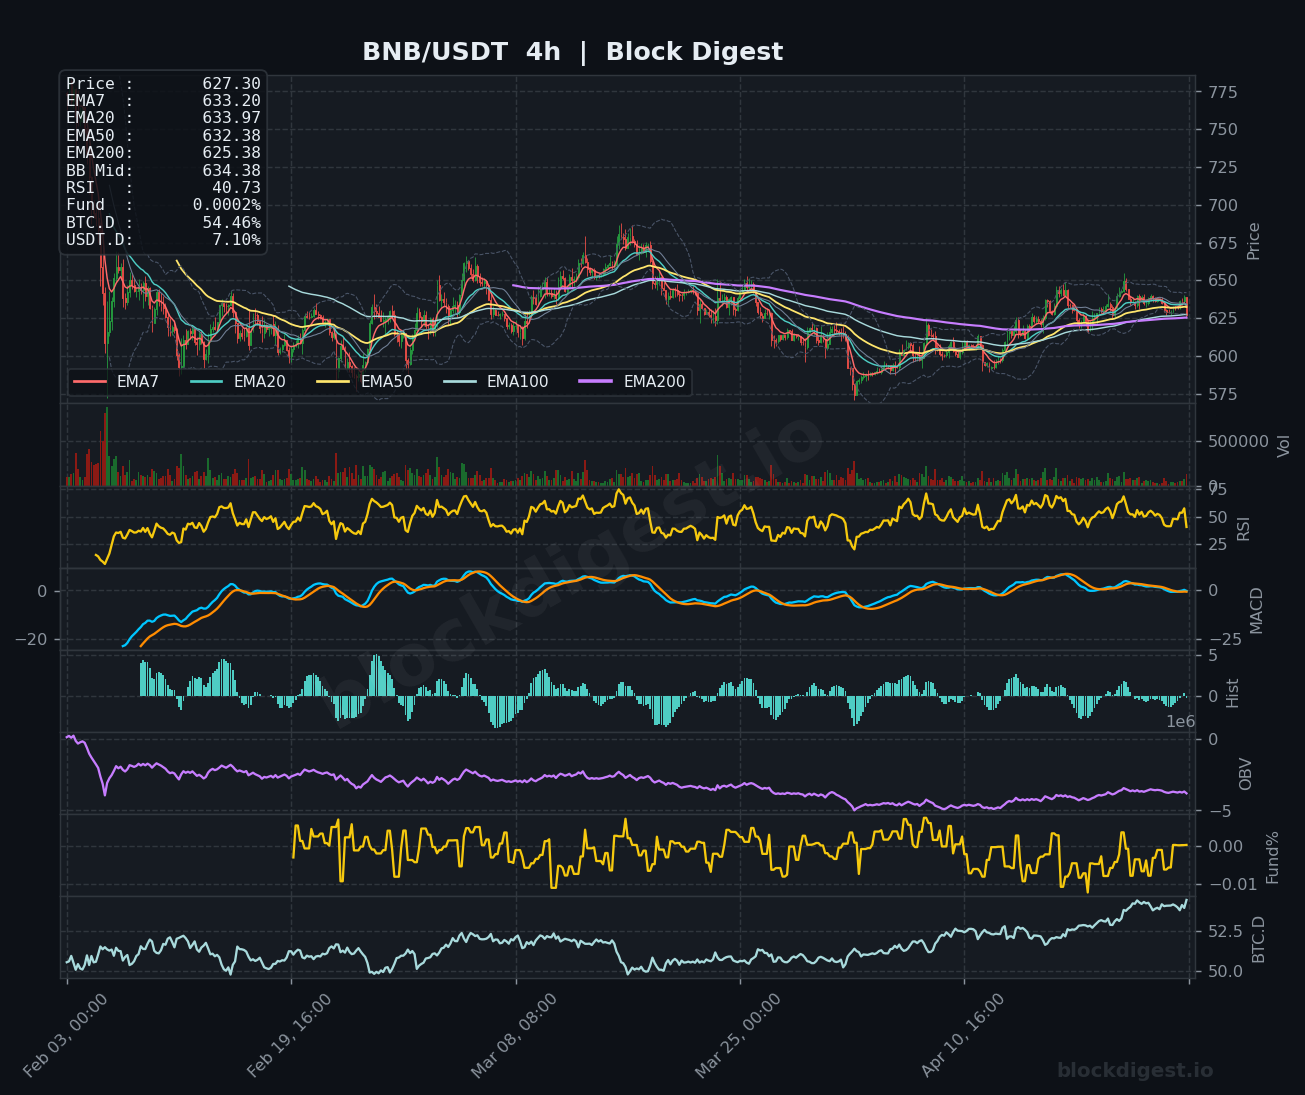
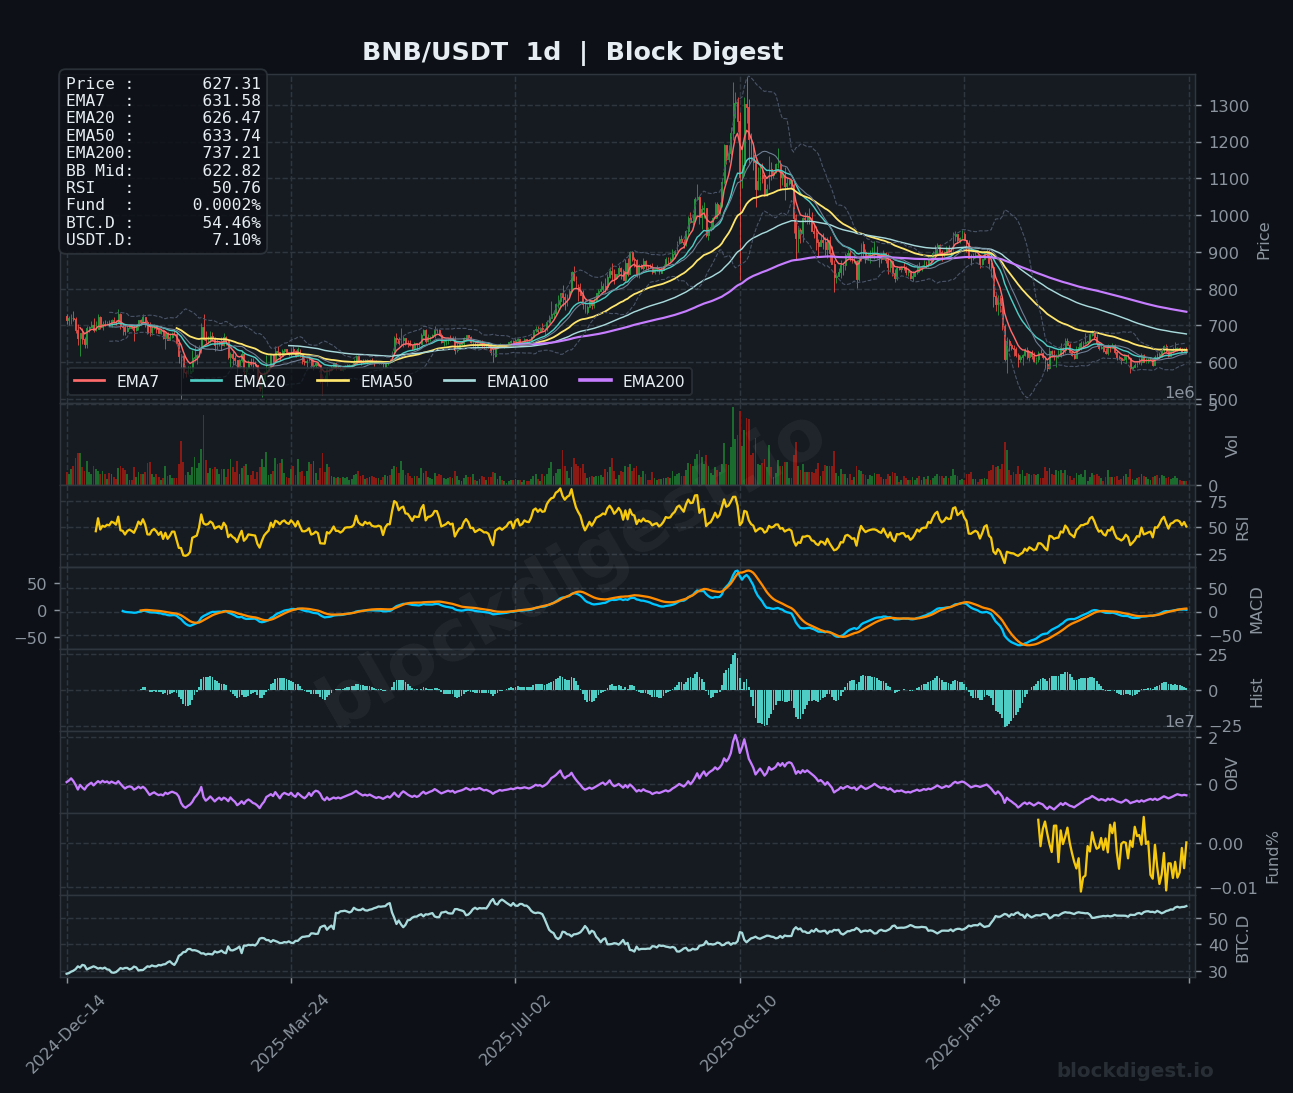
## BNB (BNB)
BNB is trading at $627.28, slightly below its short-term moving averages with the EMA7 at $631.99 and EMA20 at $633.53, indicating mild short-term weakness. The asset has been oscillating within a defined range between $620-$650 over recent days, with multiple tests of both boundaries failing to produce sustained breakouts. The RSI reading of 33.06 suggests neutral-to-bearish momentum without reaching oversold territory, while the MACD shows minimal separation between signal lines, reflecting the current indecisive market structure. On the 4-hour chart, BNB has formed a series of lower highs since early April, creating a subtle descending triangle pattern with support around $625. The daily timeframe perspective shows BNB in a broader downtrend from its peak above $1,300, though the current consolidation around $625-635 may represent an intermediate support zone where the selling pressure could eventually exhaust.
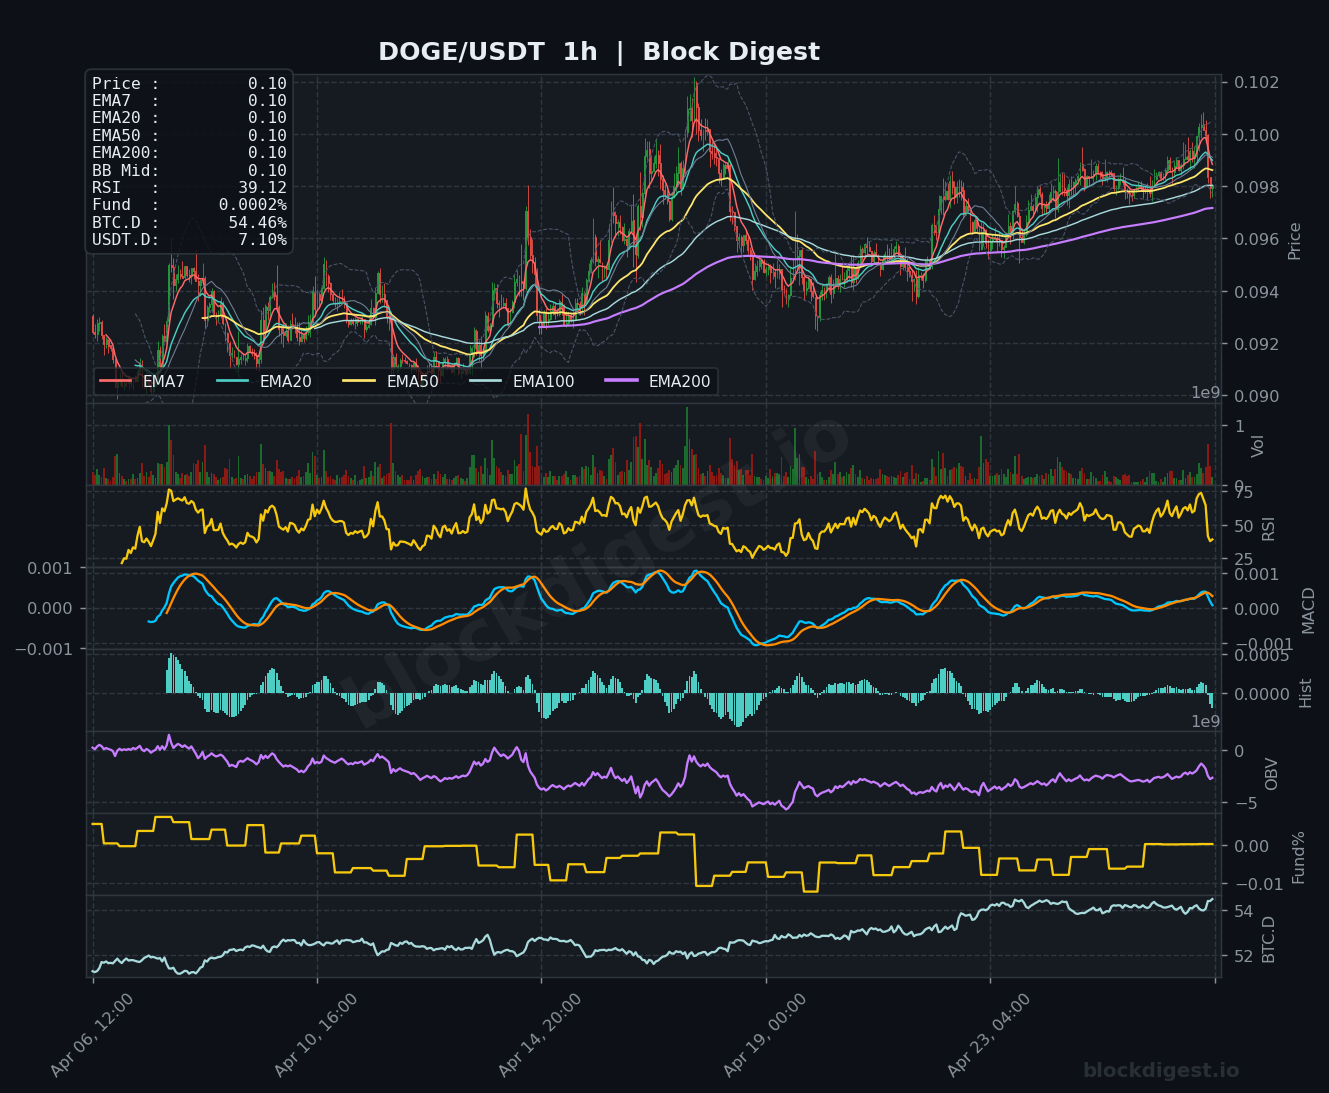
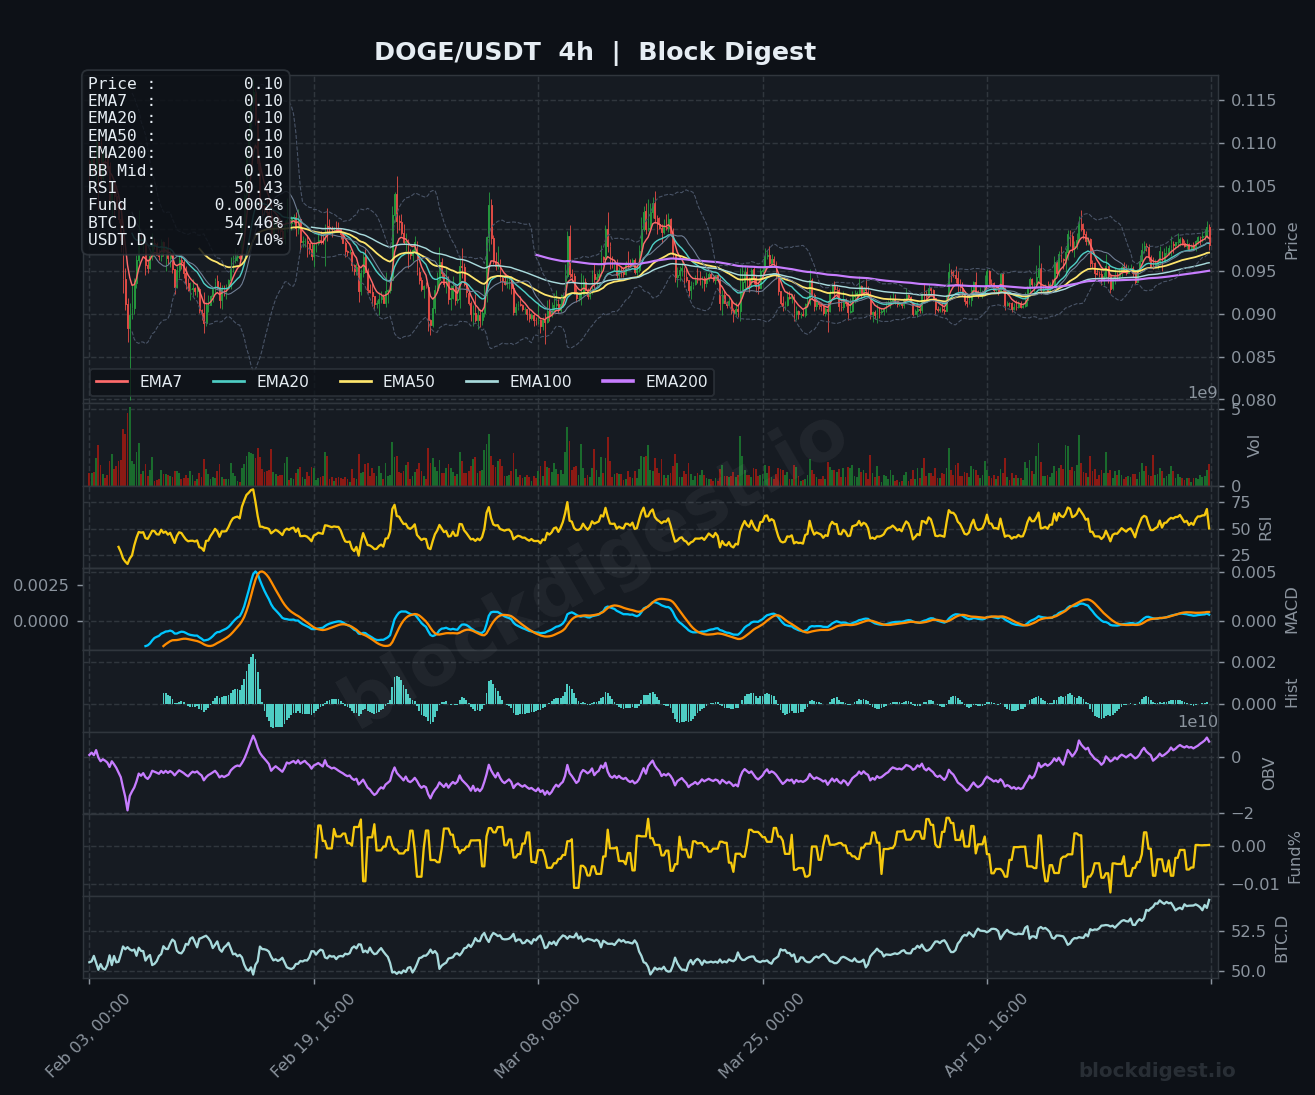
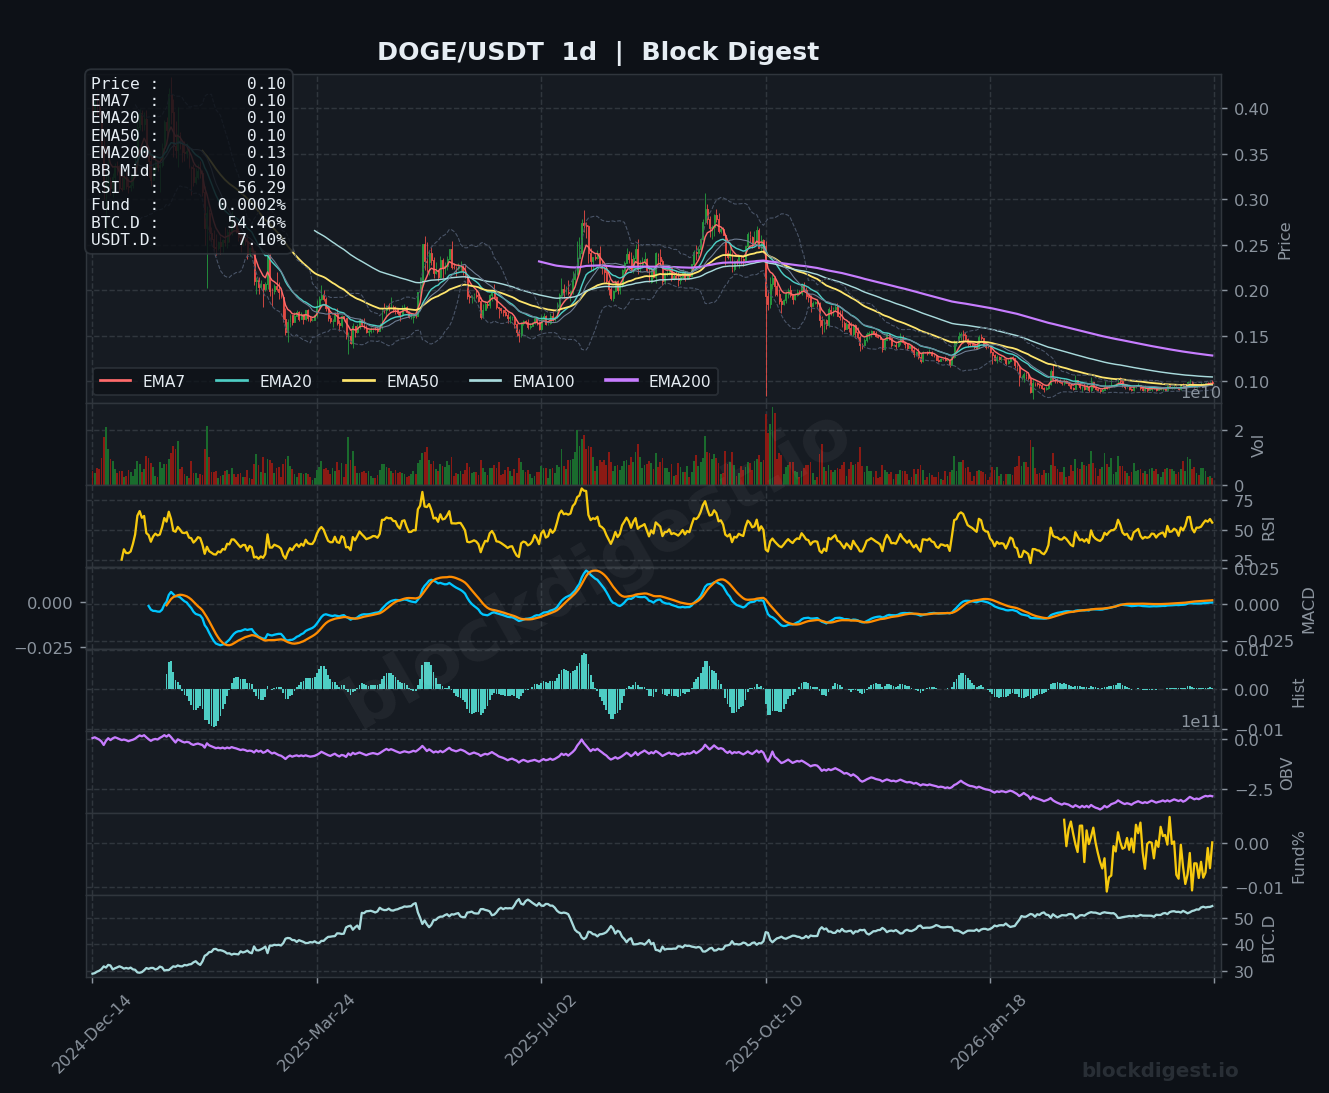
## Dogecoin (DOGE)
Dogecoin is currently trading at $0.10, with all short-term EMAs clustered tightly around this psychological price level, creating significant technical compression. The 1-hour chart shows DOGE oscillating within a narrow $0.095-$0.102 range with diminishing volatility, as evidenced by the RSI at 39.12—well within neutral territory. The MACD indicators are flatlining near zero, suggesting a lack of strong directional conviction from either bulls or bears at current levels. On the 4-hour timeframe, the price has been respecting a gradually ascending support line while simultaneously being capped by the EMA200 at $0.10, creating a wedge formation that typically precedes increased volatility. The daily chart illustrates a substantial decline from highs around $0.30 earlier in the cycle, with current levels potentially representing a demand zone where speculative interest could re-emerge if broader market conditions improve.
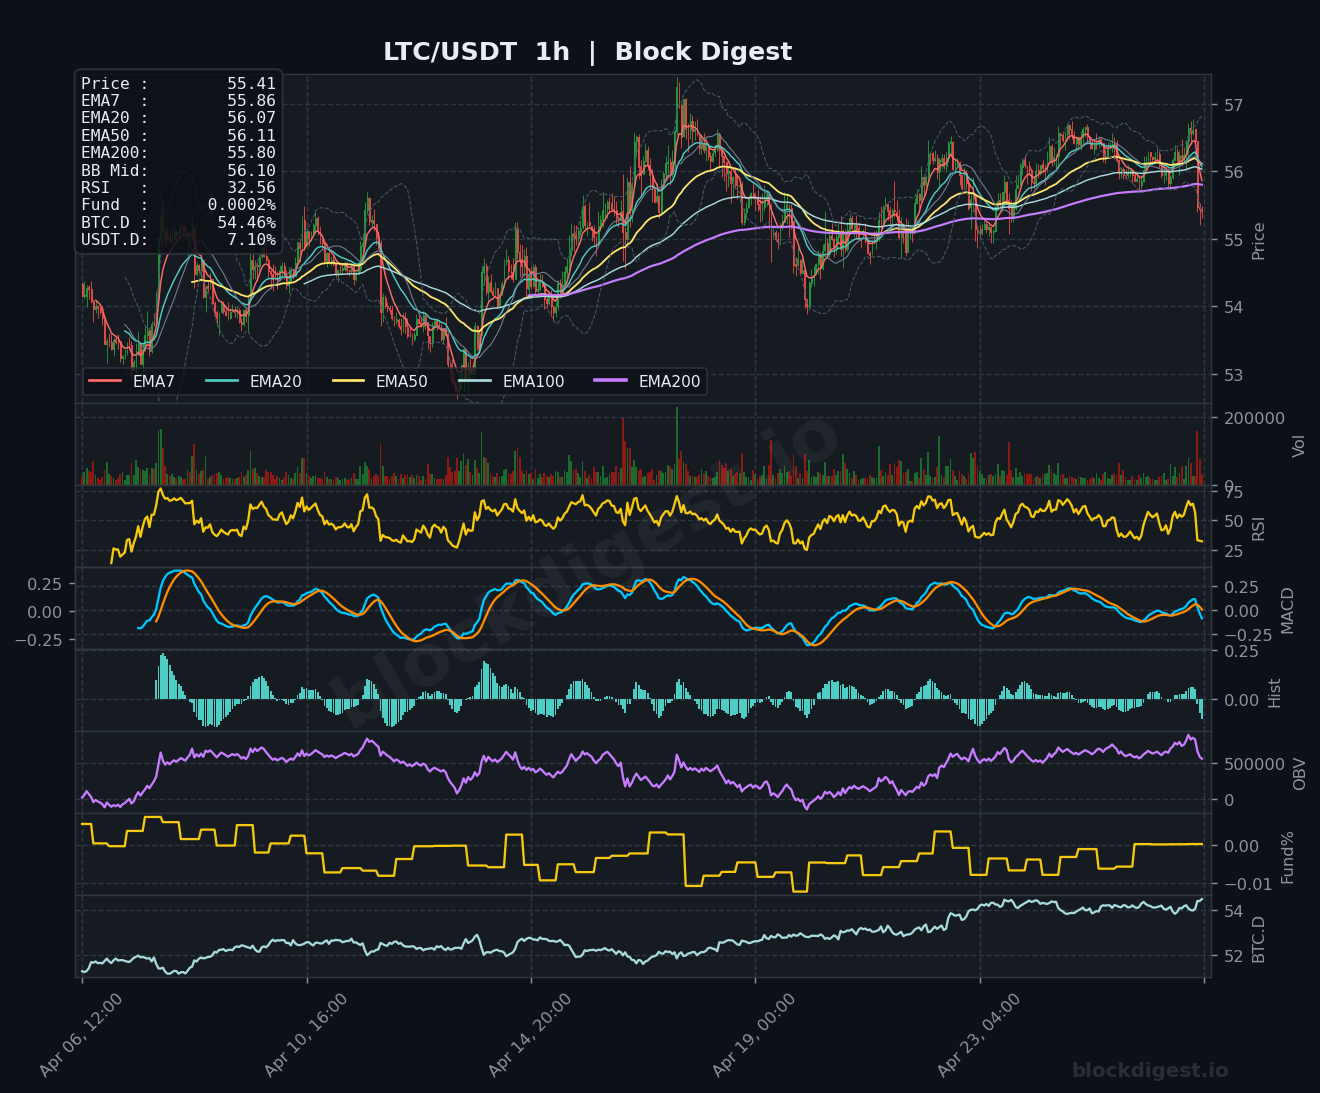
## Litecoin (LTC)
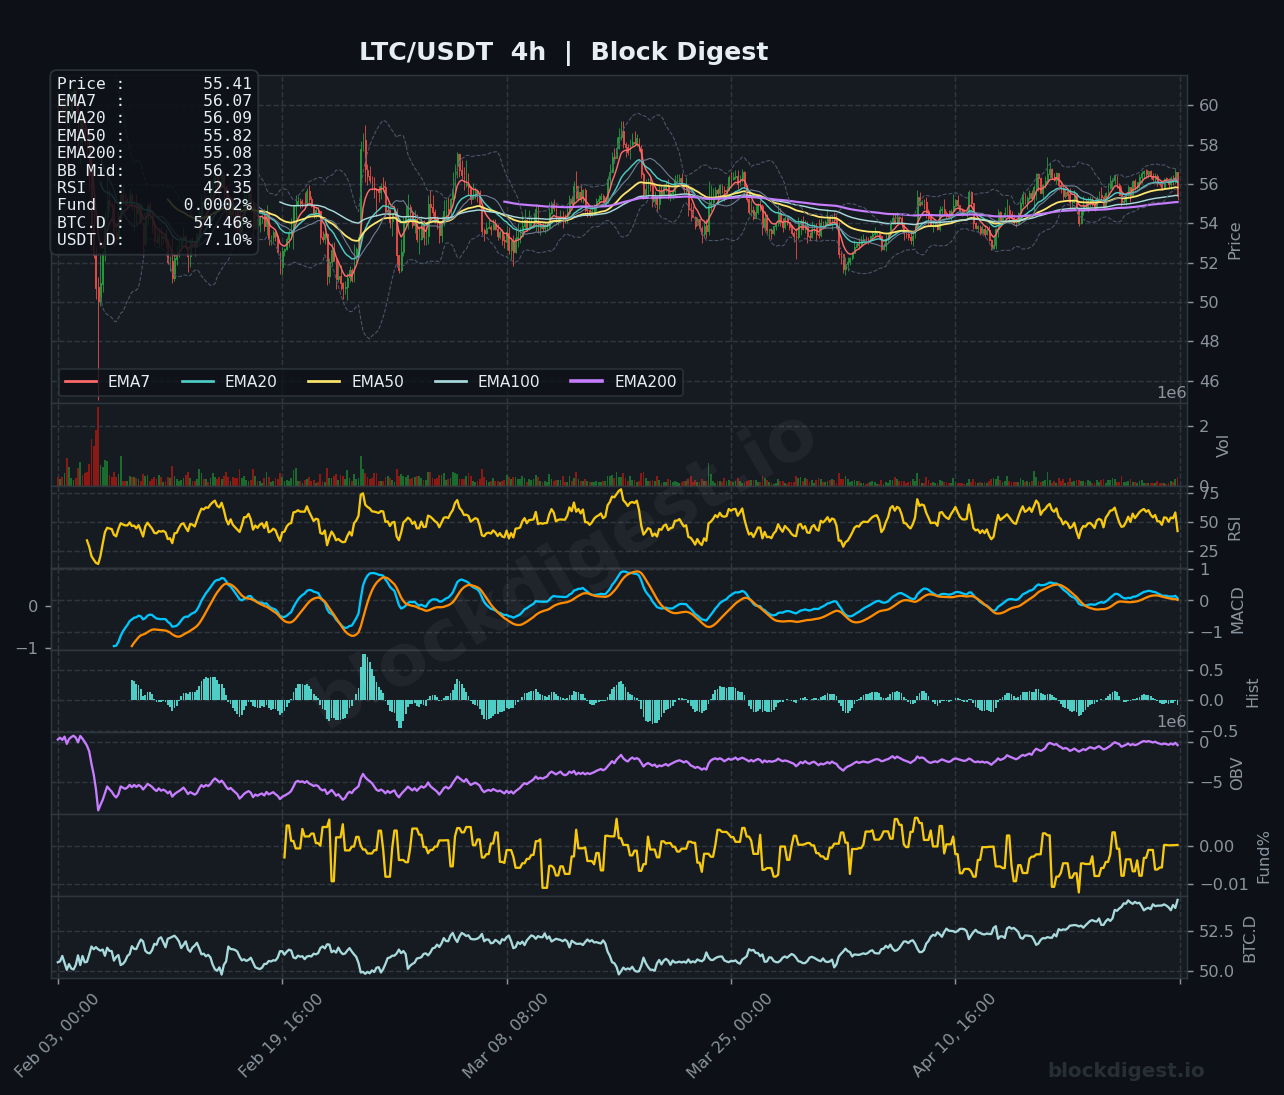
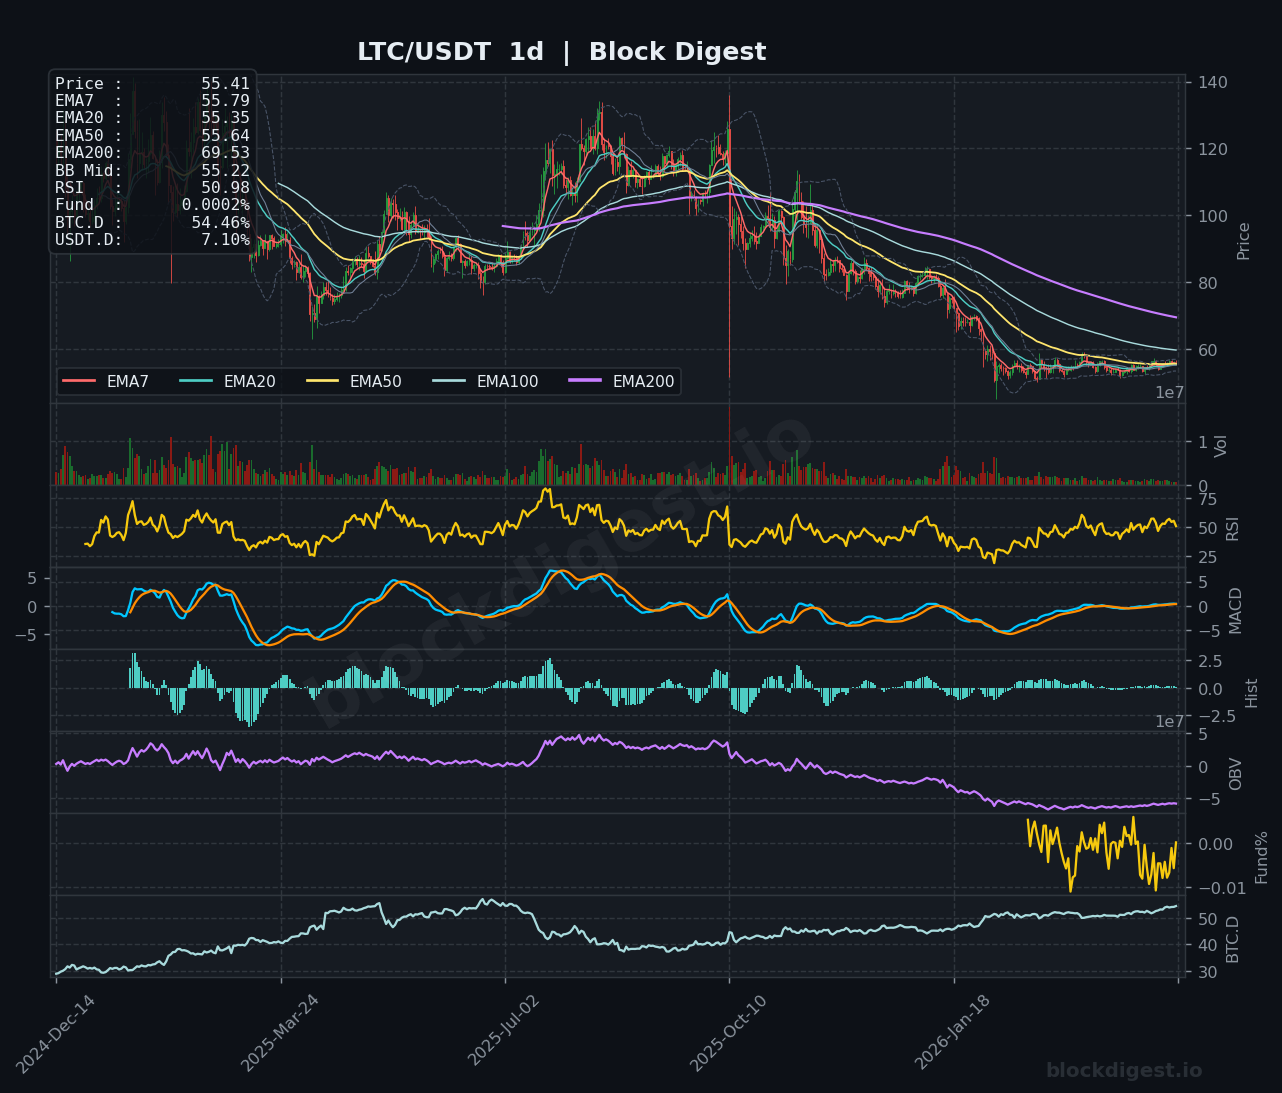
Litecoin is positioned at $55.41, trading just below its EMA7 at $55.86 and showing signs of consolidation after recent weakness from levels above $57. The cryptocurrency has been respecting a narrow trading range between $54-$57 with decreasing volume, suggesting accumulation or distribution occurring at these levels. The RSI at 32.56 indicates neutral momentum with a slight bearish lean, while the MACD shows minimal histogram activity, reflecting the current lack of strong trending behavior. On the 4-hour chart, LTC appears to be forming a symmetrical triangle pattern with converging trendlines, which could resolve in either direction depending on broader market catalysts. The daily perspective reveals a longer-term downtrend from peaks above $140, but the current consolidation around $55-56 aligns with previous support zones from 2024, suggesting potential historical significance that could attract buyers looking for value.
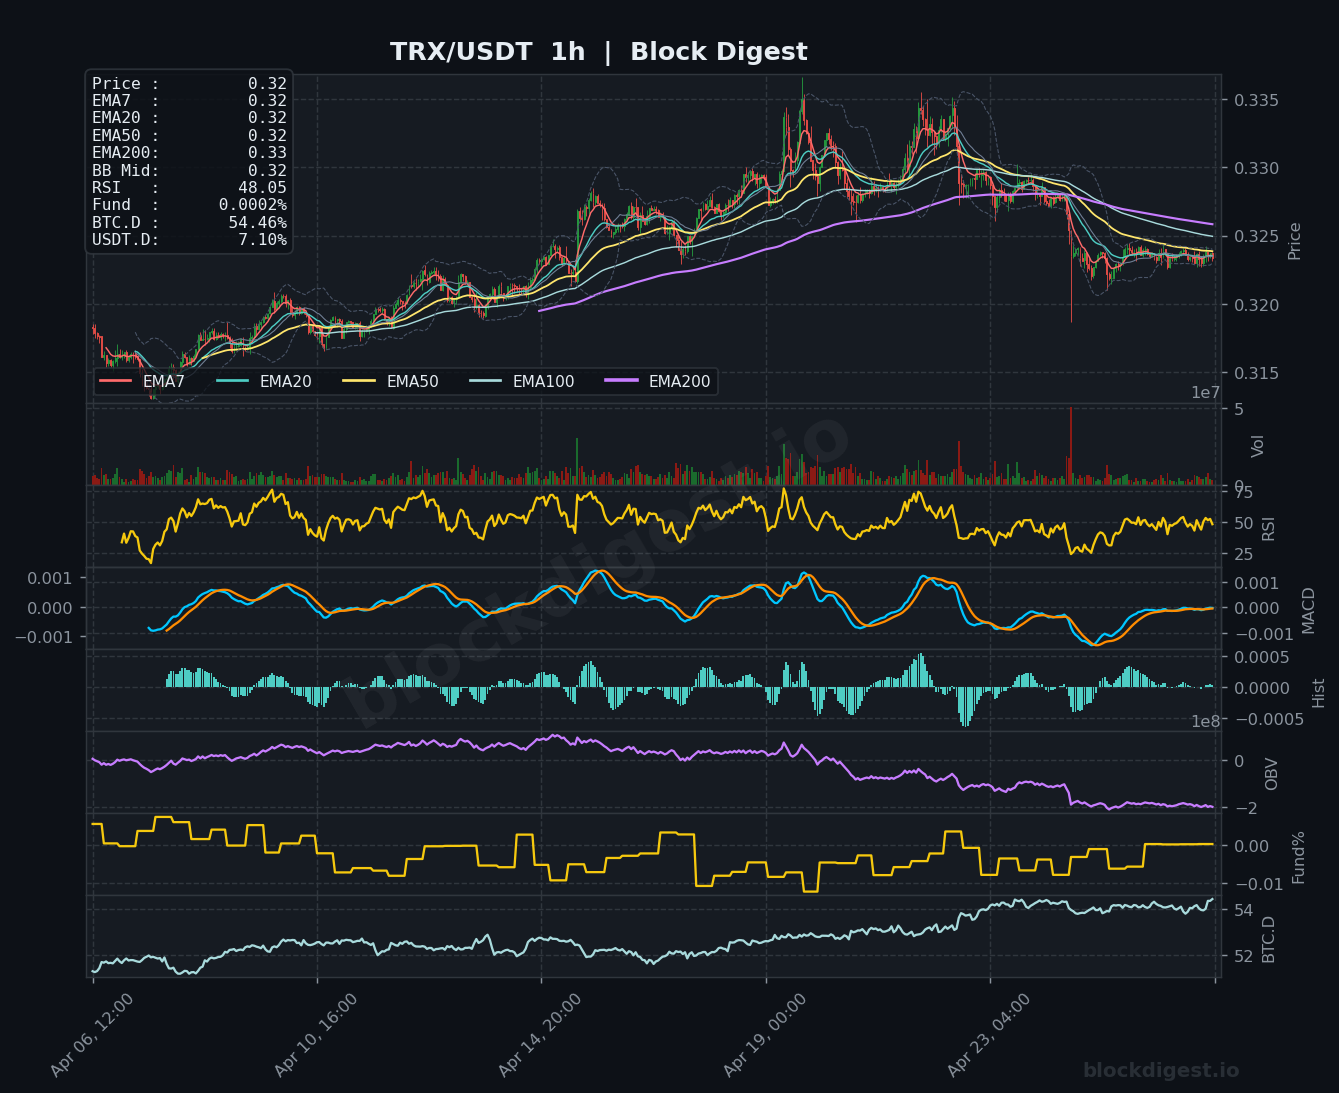
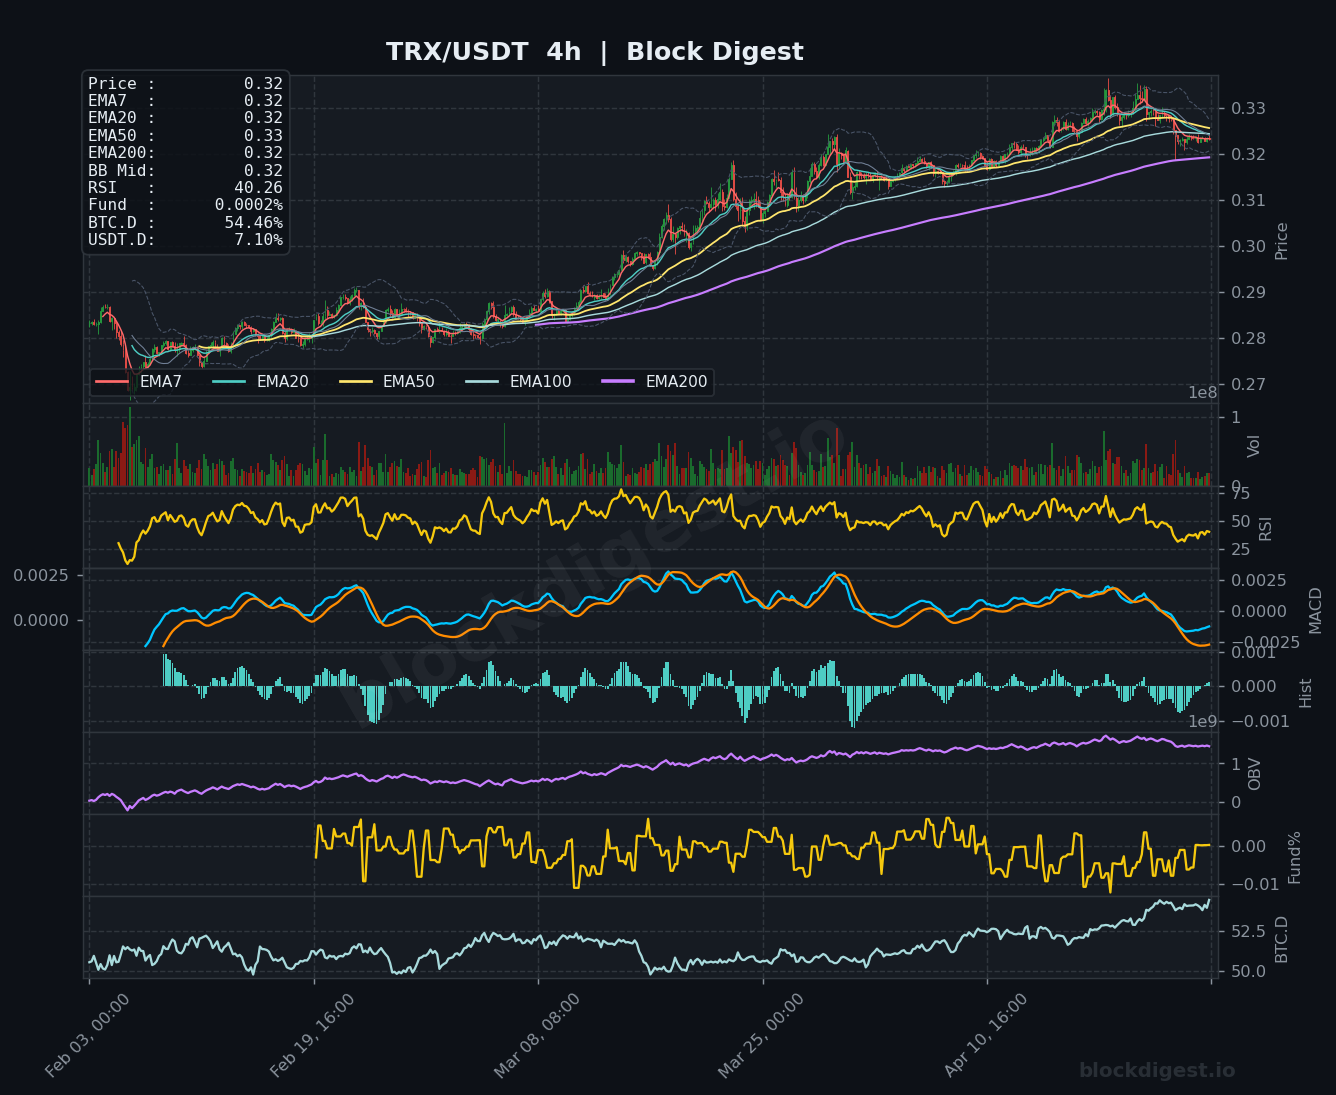
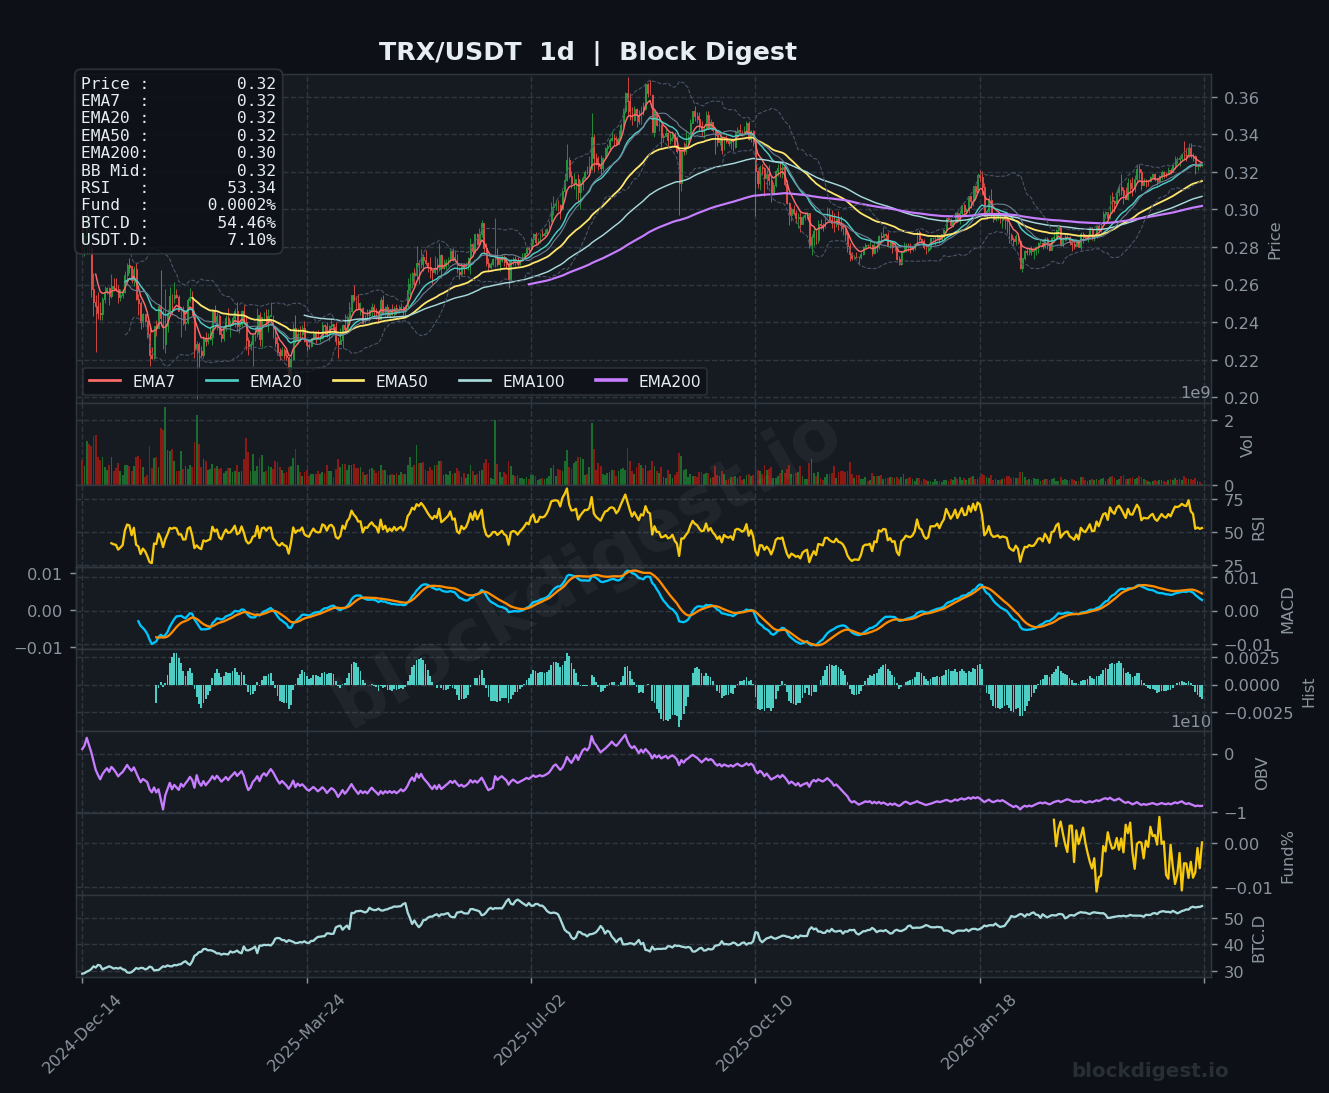
## TRON (TRX)
TRON is trading at $0.32, positioned just below its short-term EMAs with the EMA7 at $0.32 and showing remarkably tight consolidation. The 1-hour chart displays minimal volatility with price oscillating in an extremely narrow range, while the RSI at 48.05 sits almost perfectly neutral, indicating balanced buying and selling pressure. The MACD is hovering near the zero line with both signal lines nearly flat, suggesting a market in equilibrium awaiting a catalyst. On the 4-hour timeframe, TRX has been gradually ascending within a rising channel pattern, maintaining support around $0.32 while previous resistance at $0.33 has been tested multiple times without a decisive break. The daily chart shows TRX in a longer-term uptrend from lows around $0.24, with the current consolidation potentially representing a bullish continuation pattern where buyers digest recent gains before attempting higher levels toward the $0.34-0.36 range.
## Altcoin Outlook
The altcoin market is currently in a consolidation phase characterized by tight ranges, converging moving averages, and neutral momentum indicators across most major assets. Among the analyzed coins, TRX displays the strongest technical setup with its ascending channel and maintained uptrend structure, while SOL and LTC show more concerning patterns with sustained weakness from higher levels. The key conditions to watch include a potential Bitcoin directional move that could either confirm this consolidation as accumulation or trigger another leg lower, along with USDT dominance movements that would signal shifting risk appetite. A break above resistance levels in multiple altcoins simultaneously would confirm renewed strength, while failure to hold current support zones could lead to accelerated downside toward the next major demand areas.
Charts