Altcoin Daily Analysis: BTC Dominance 56.7% Signals Risk-Off Rotation
Market Context
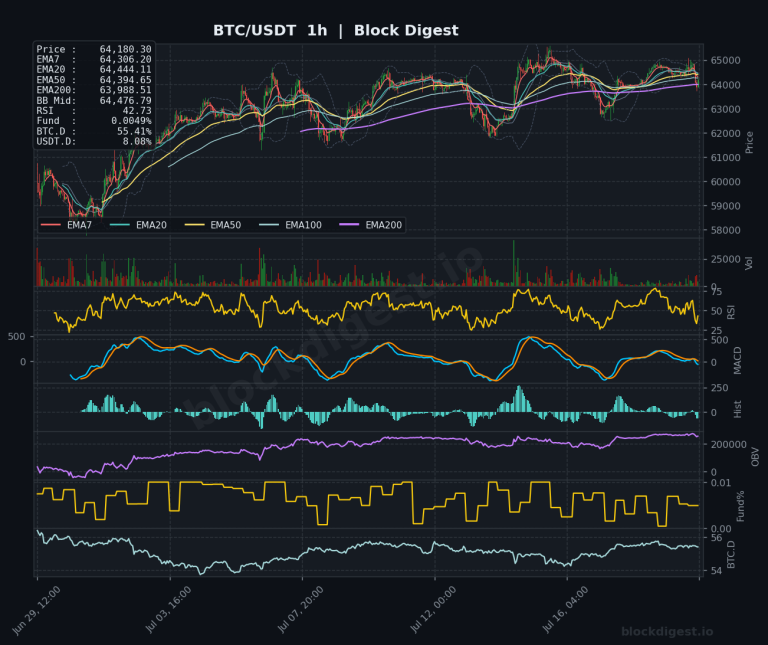
The broader altcoin market is under sustained selling pressure, with BTC dominance sitting at 56.69%–56.72% across all charts — a reading that confirms capital continues to rotate defensively toward Bitcoin at the expense of altcoins. USDT dominance at 8.51% reflects elevated cash positioning and a distinctly risk-off environment, consistent with the reported $390 billion weekly market cap erasure. Until BTC.D shows signs of rolling over, altcoins face structural headwinds that make any sustained recovery difficult to maintain.
Solana (SOL)
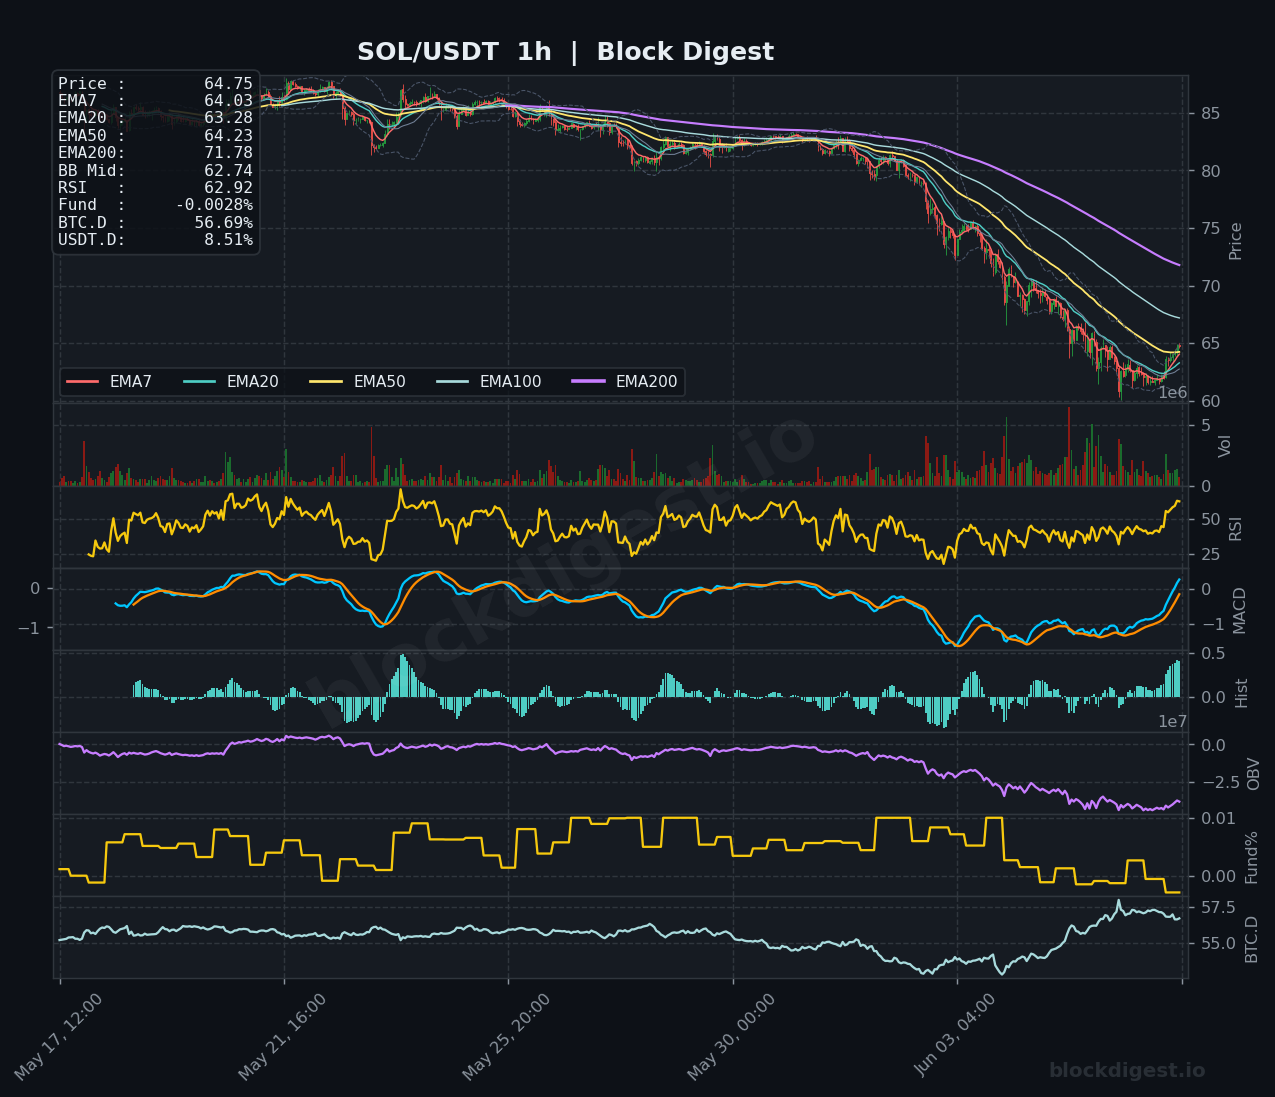
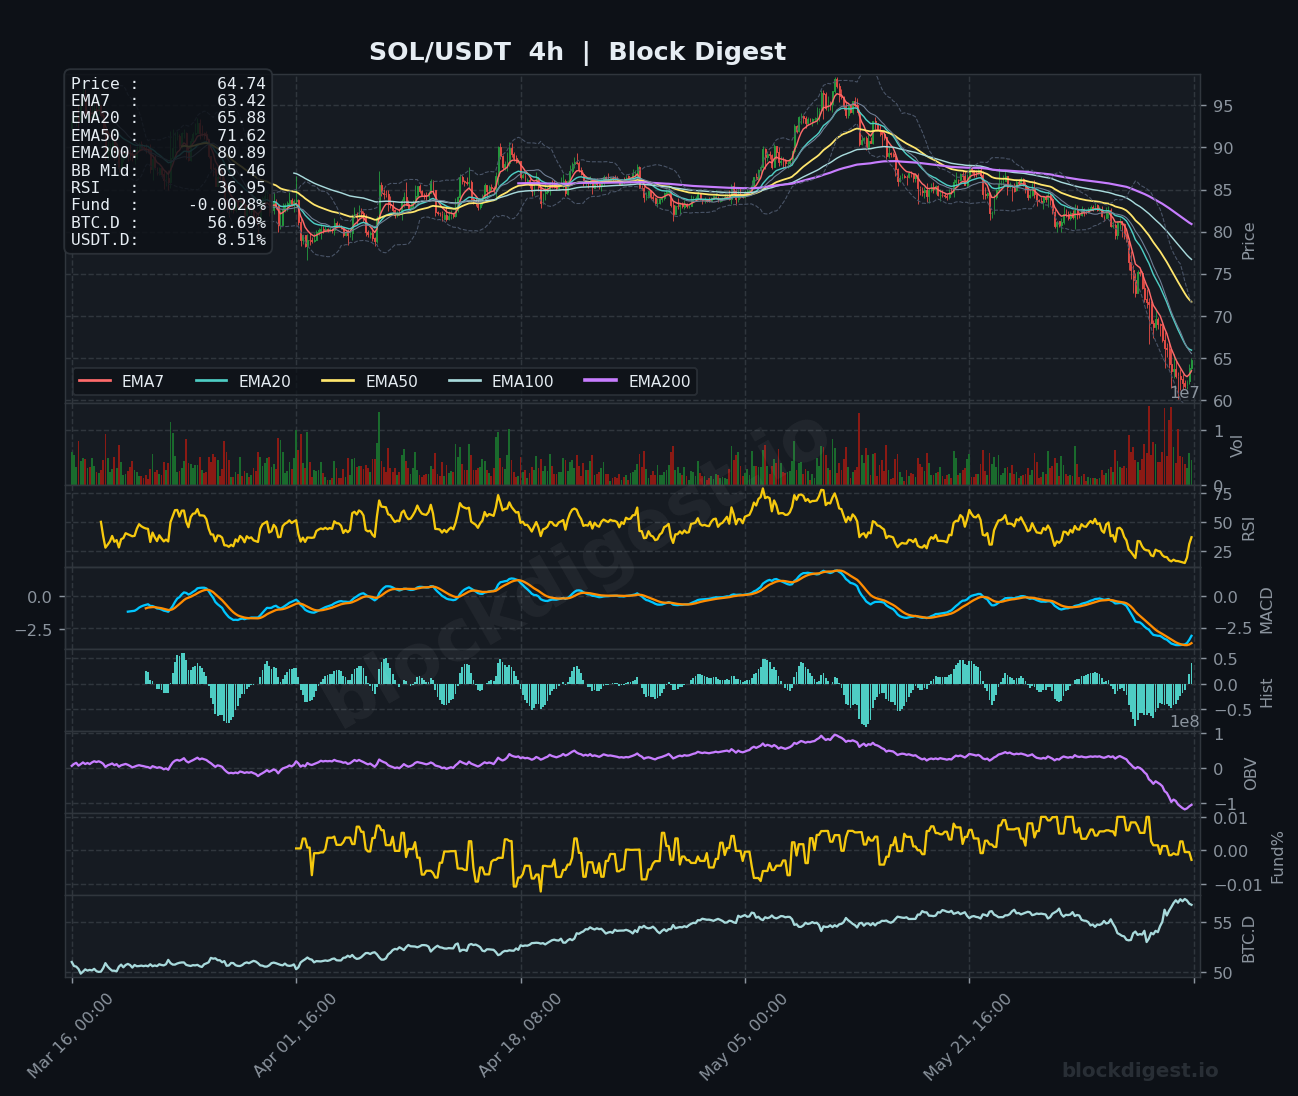
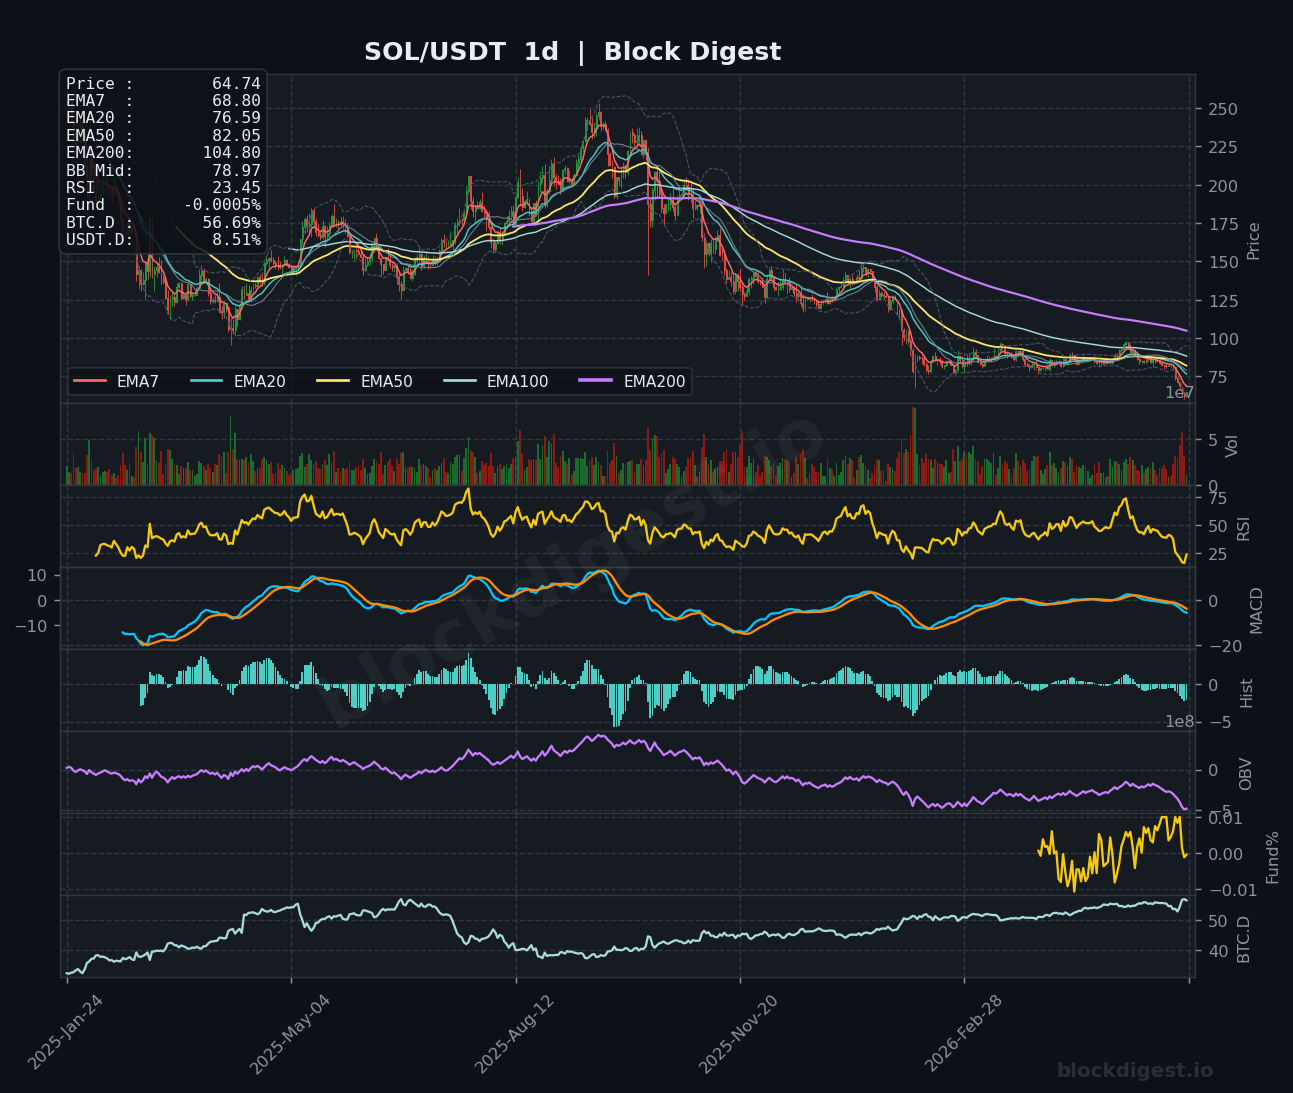
SOL is trading at $64.74, firmly below all major EMAs on every timeframe — the 1h EMA200 sits at $71.78, the 4h EMA200 at $80.89, and the daily EMA200 at $104.80 — illustrating the depth of the current downtrend. The daily RSI has collapsed to an extreme 23.45, approaching deeply oversold territory not seen since prior cycle lows, while the 4h RSI sits at 36.95 and the MACD remains in steep bearish divergence with no sign of a cross. OBV on both the 4h and daily frames continues to decline, confirming that selling volume is dominant and no meaningful accumulation has emerged. The $53 level represents the next key structural support, and while the daily RSI argues for a near-term bounce, the bias remains firmly bearish until SOL can reclaim at least the $70 region.
XRP (XRP)
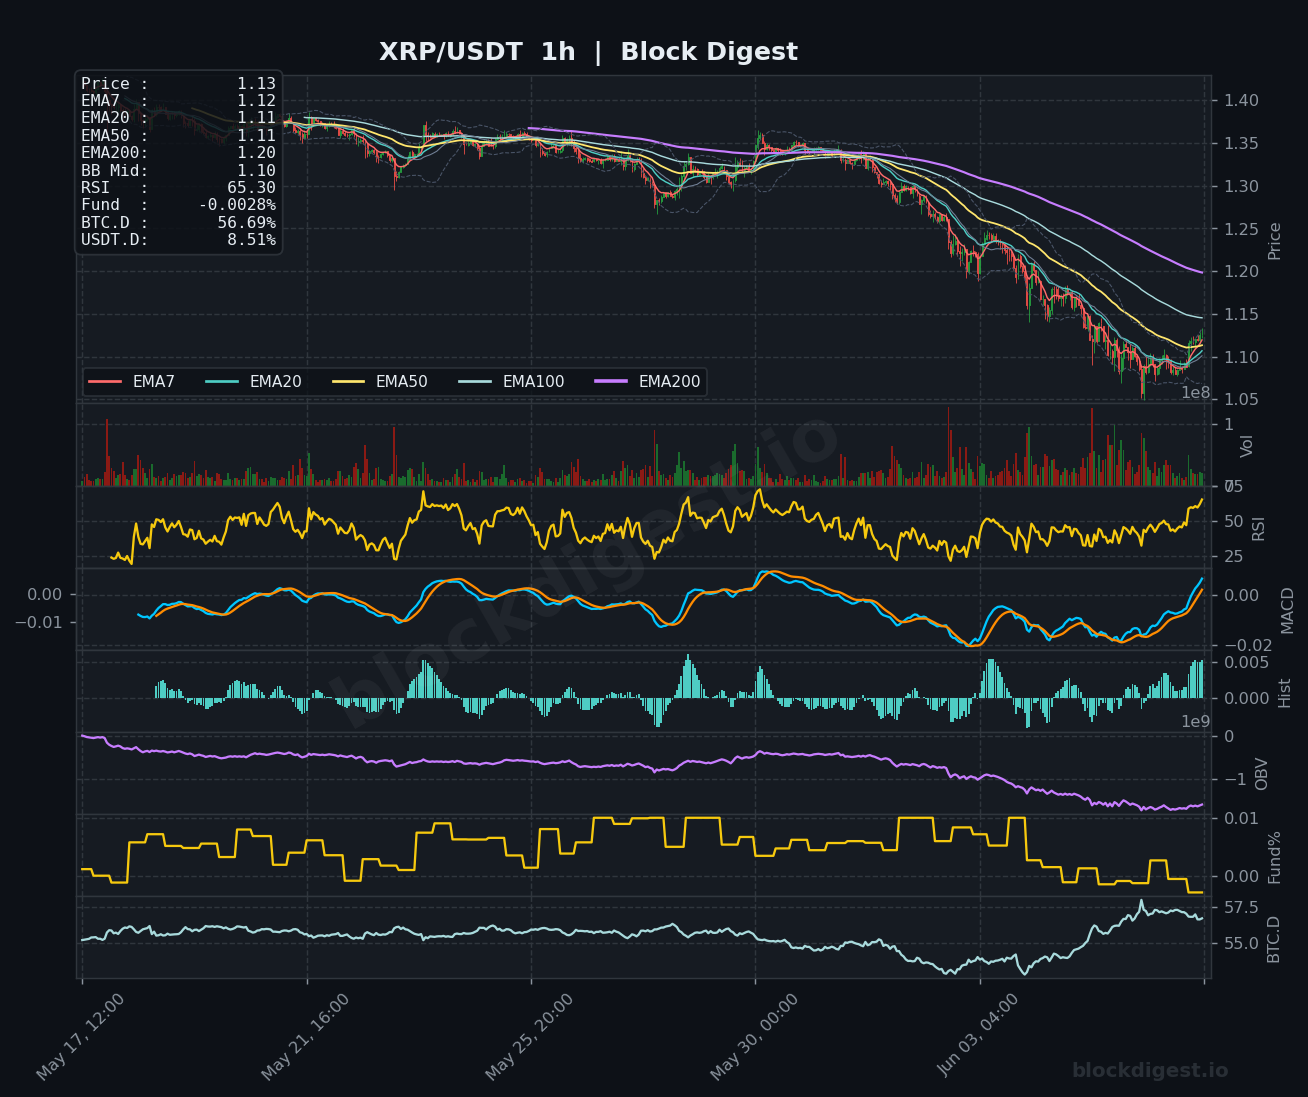
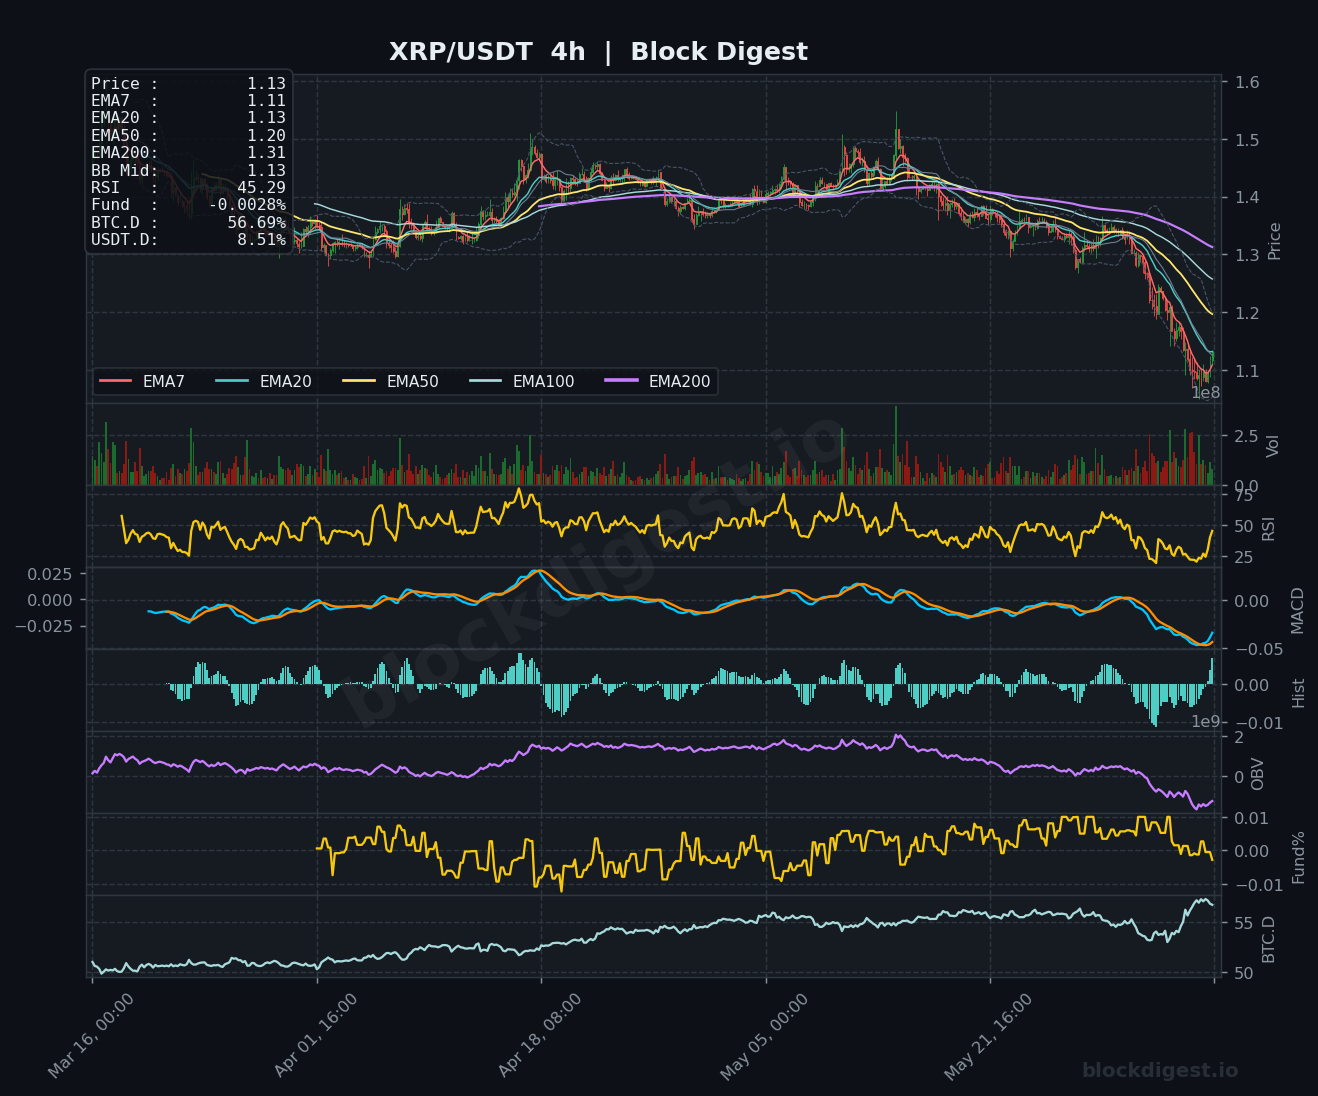
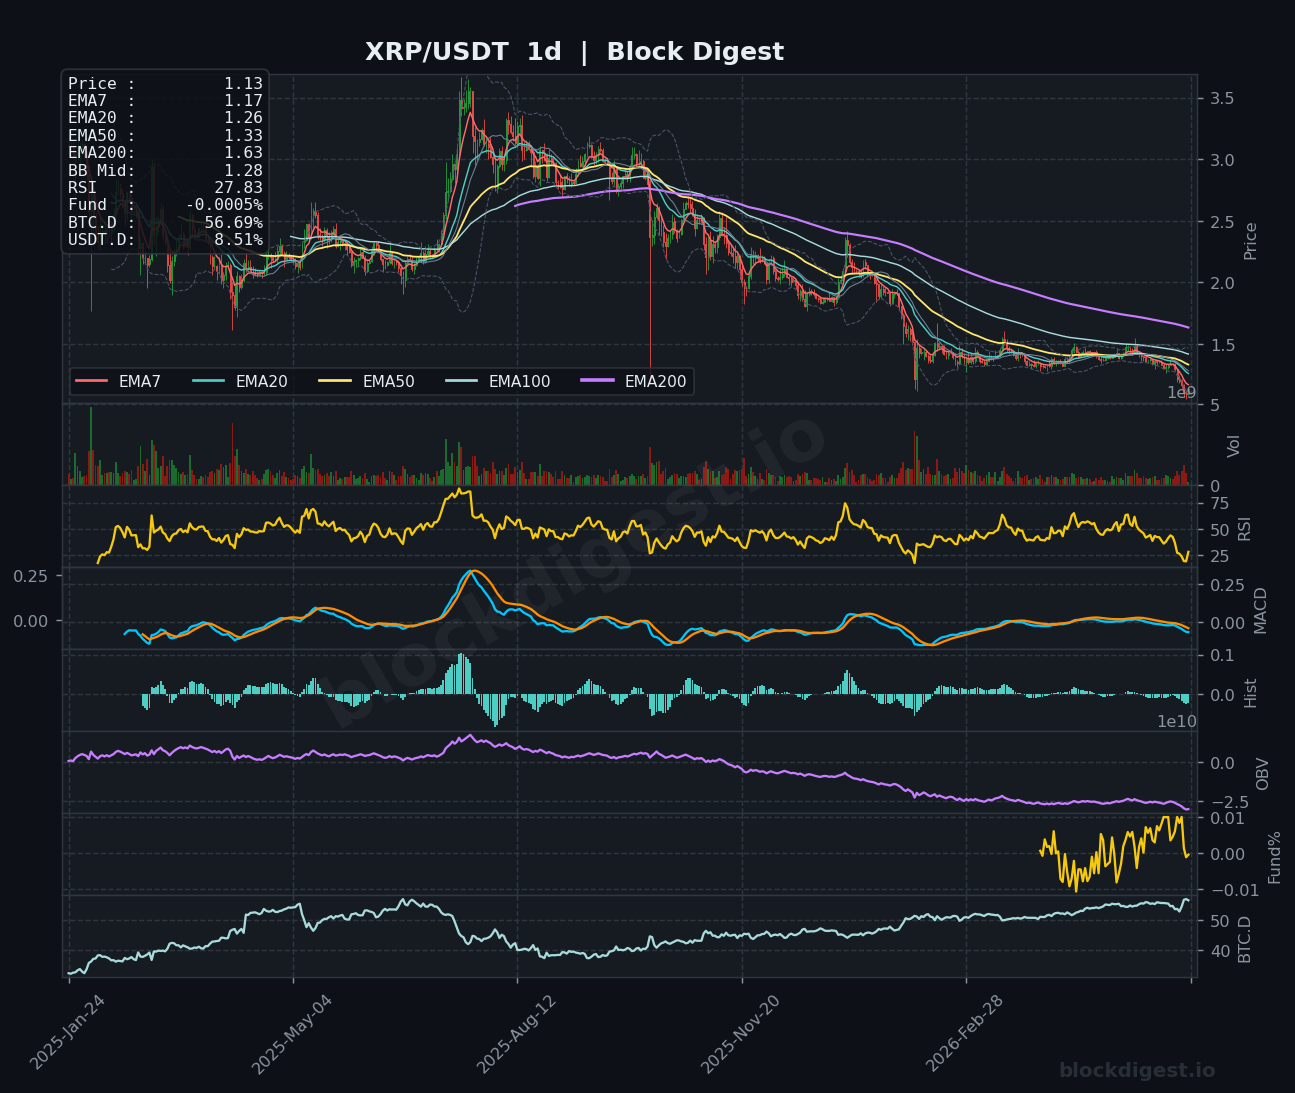
XRP is trading at $1.13, precariously clinging to the critical $1.10 support level that analysts have flagged as the line in the sand before a potential slide toward $0.80. On the 1h chart, RSI has recovered to 65.30, suggesting a short-term bounce is in play, while the MACD histogram has flipped positive — a mild encouraging sign after an extended decline from $1.40+. However, the 4h RSI at 45.29 and a deeply negative MACD signal that the intermediate trend remains bearish, with price trading below all key EMAs including the 4h EMA50 at $1.20 and EMA200 at $1.31. The daily RSI at 27.83 is approaching oversold levels, and the Bollinger Band midline at $1.28 acts as first meaningful resistance; a failure to hold $1.10 on any retest would be a significant technical deterioration.
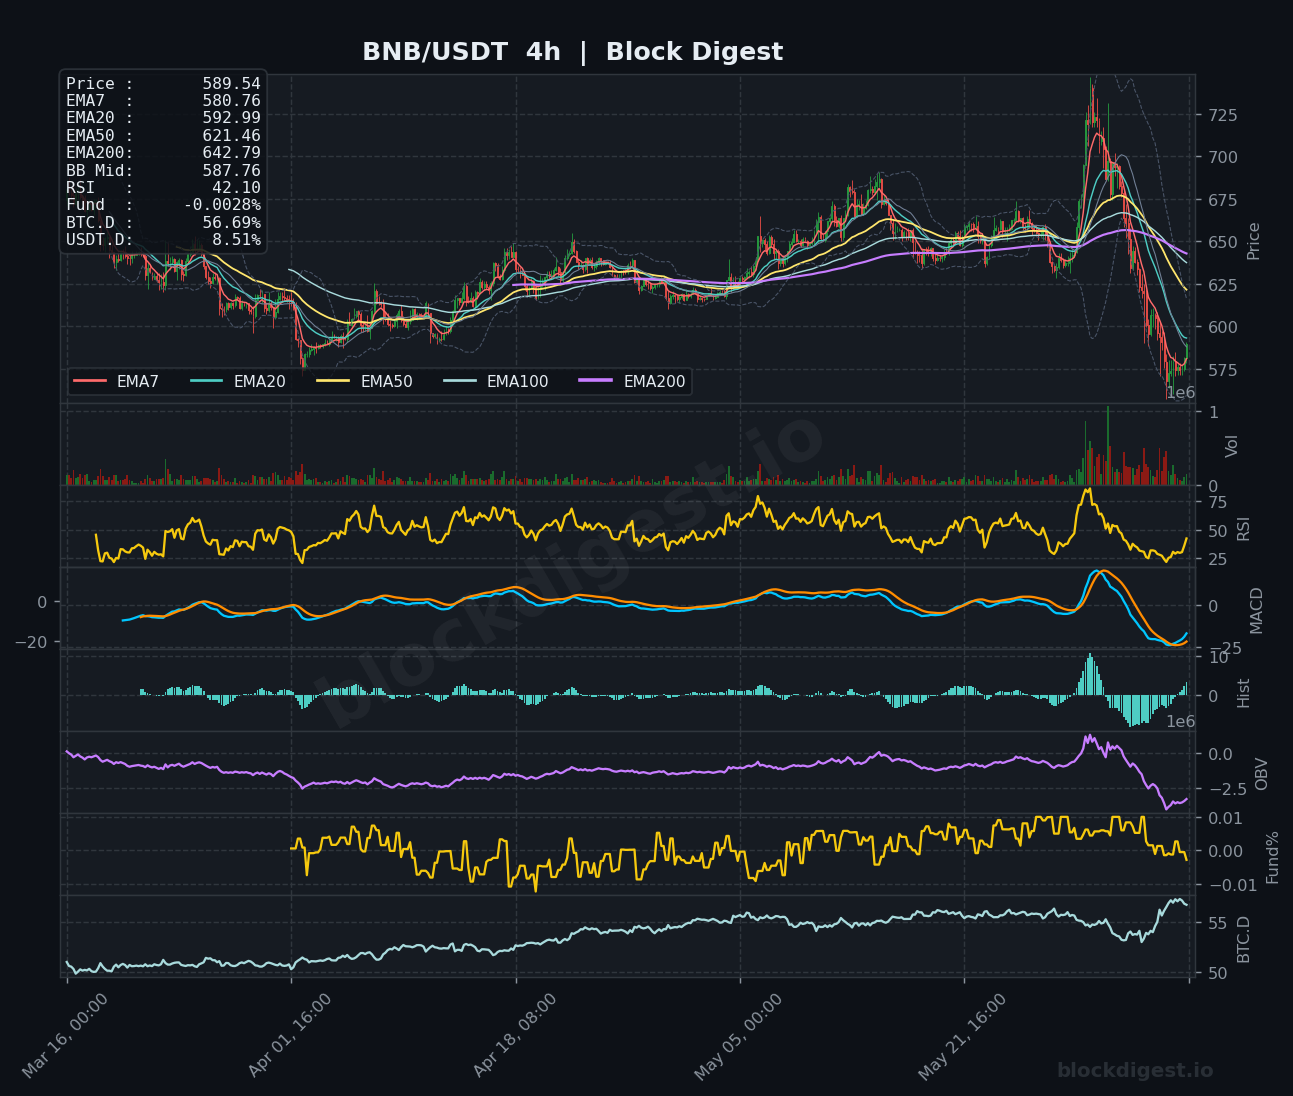
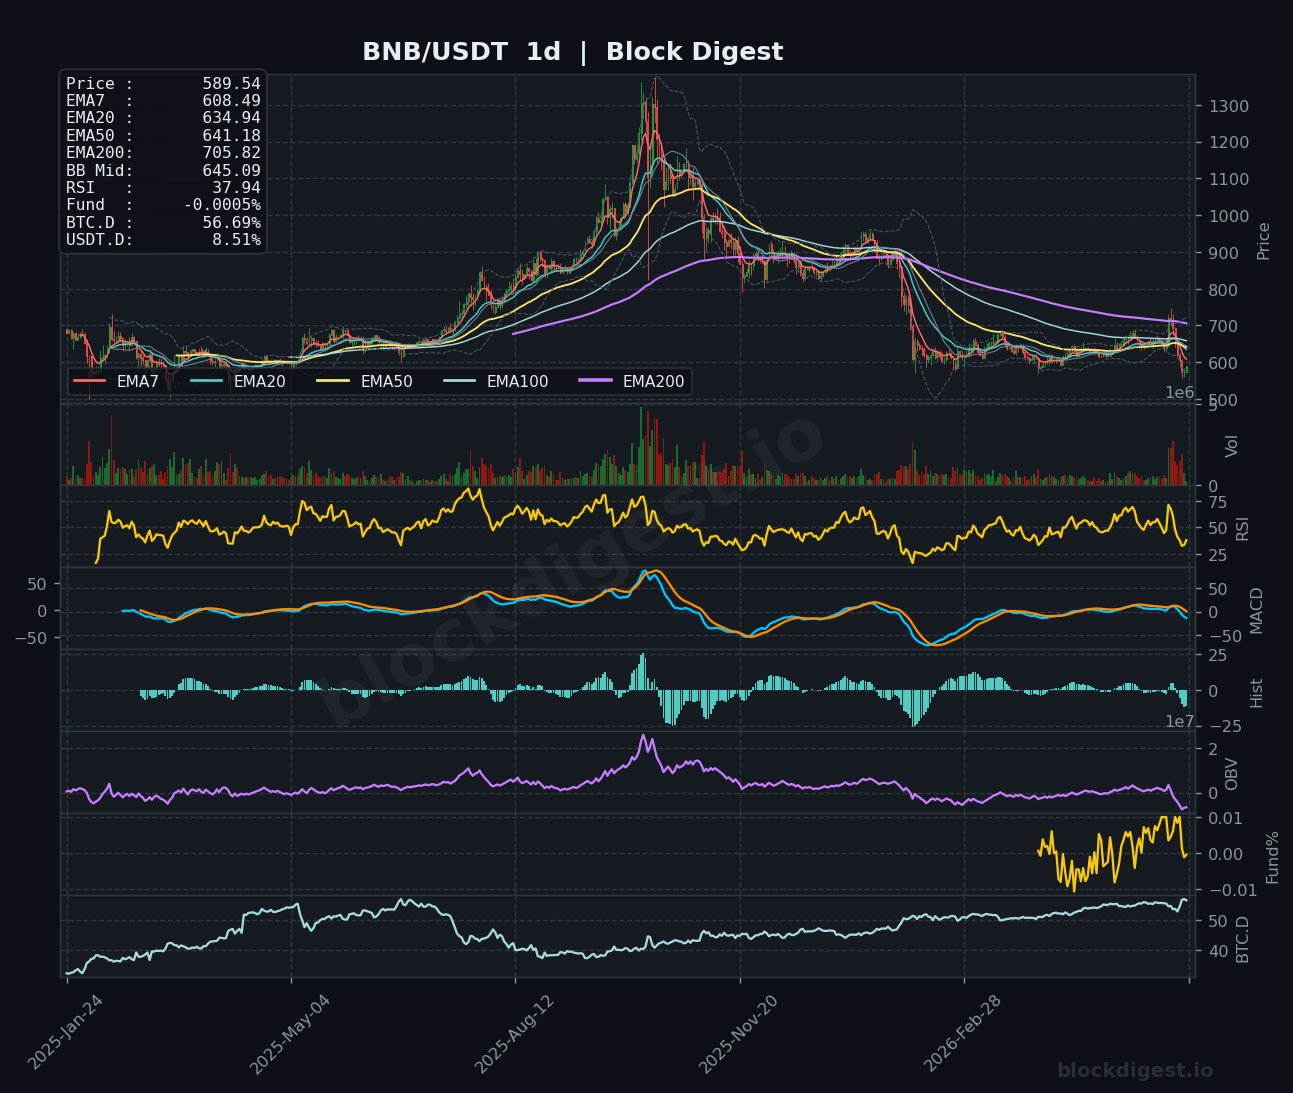
BNB (BNB)
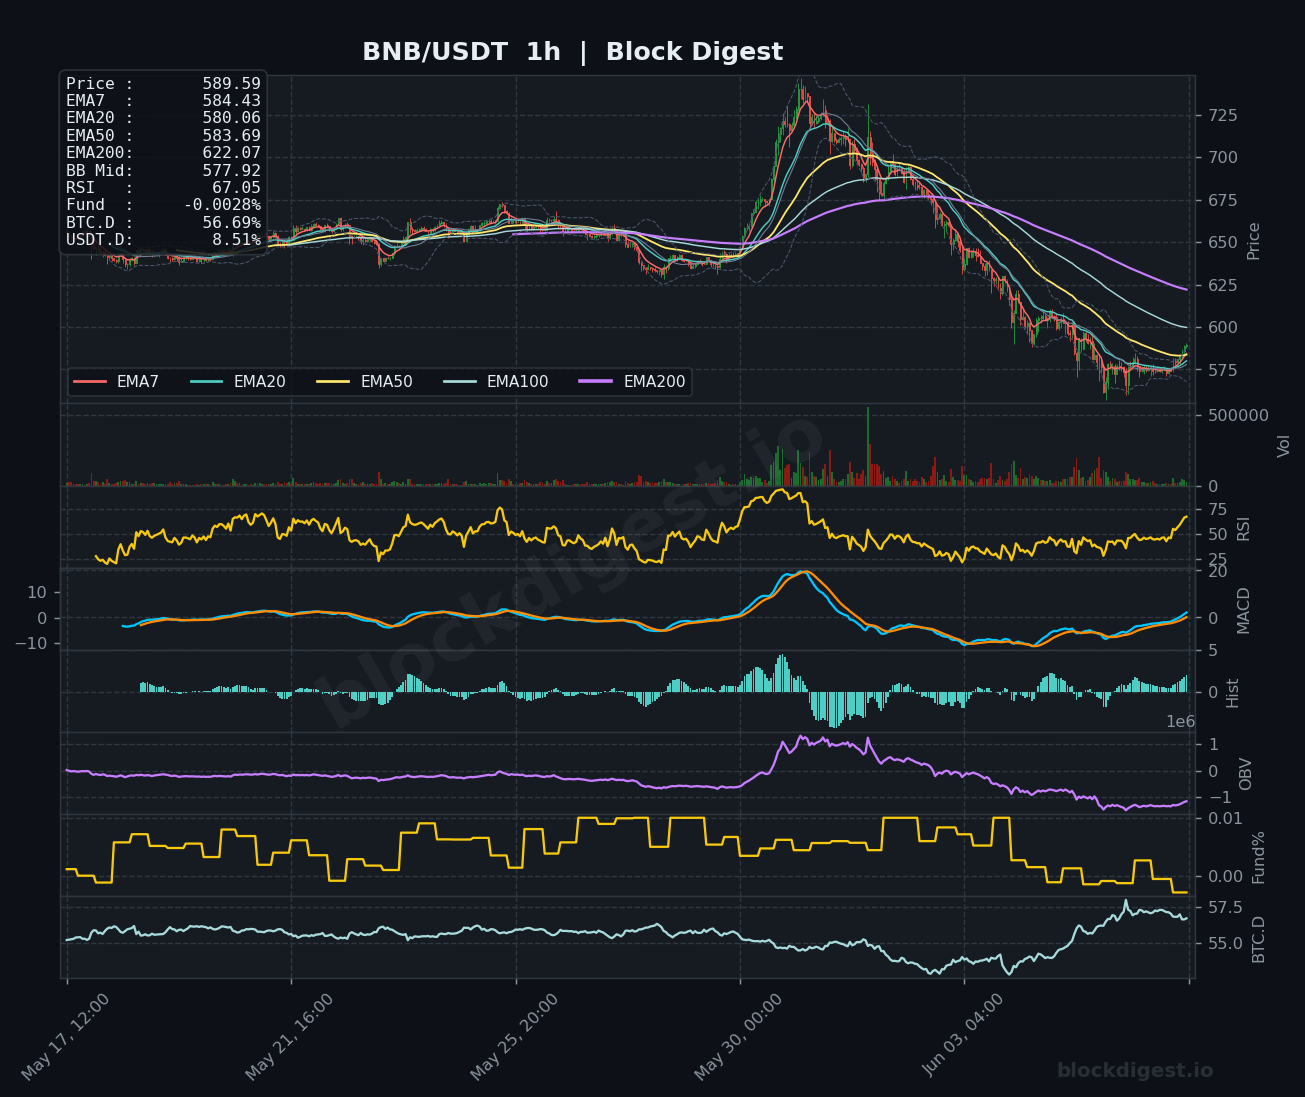
BNB is trading at $589.54, having shed significant ground from its recent highs above $725, with all short-to-medium term EMAs in a bearish stack on the 4h chart — EMA7 at $580.76, EMA20 at $592.99, EMA50 at $621.46, and EMA200 at $642.79. The 4h RSI reads 42.10 and the MACD has rolled decisively negative with expanding bearish histogram bars, pointing to continued near-term weakness. On the daily chart, RSI sits at 37.94 with the MACD bearish, though OBV has not broken to the same degree as other altcoins, suggesting some residual buying interest — consistent with BNB modestly outperforming the broader market on a 7-day basis. Key support lies at $575–$580, with a break below opening a test of $550; first resistance to watch on any recovery attempt is the $620–$625 zone aligned with the daily EMA50.
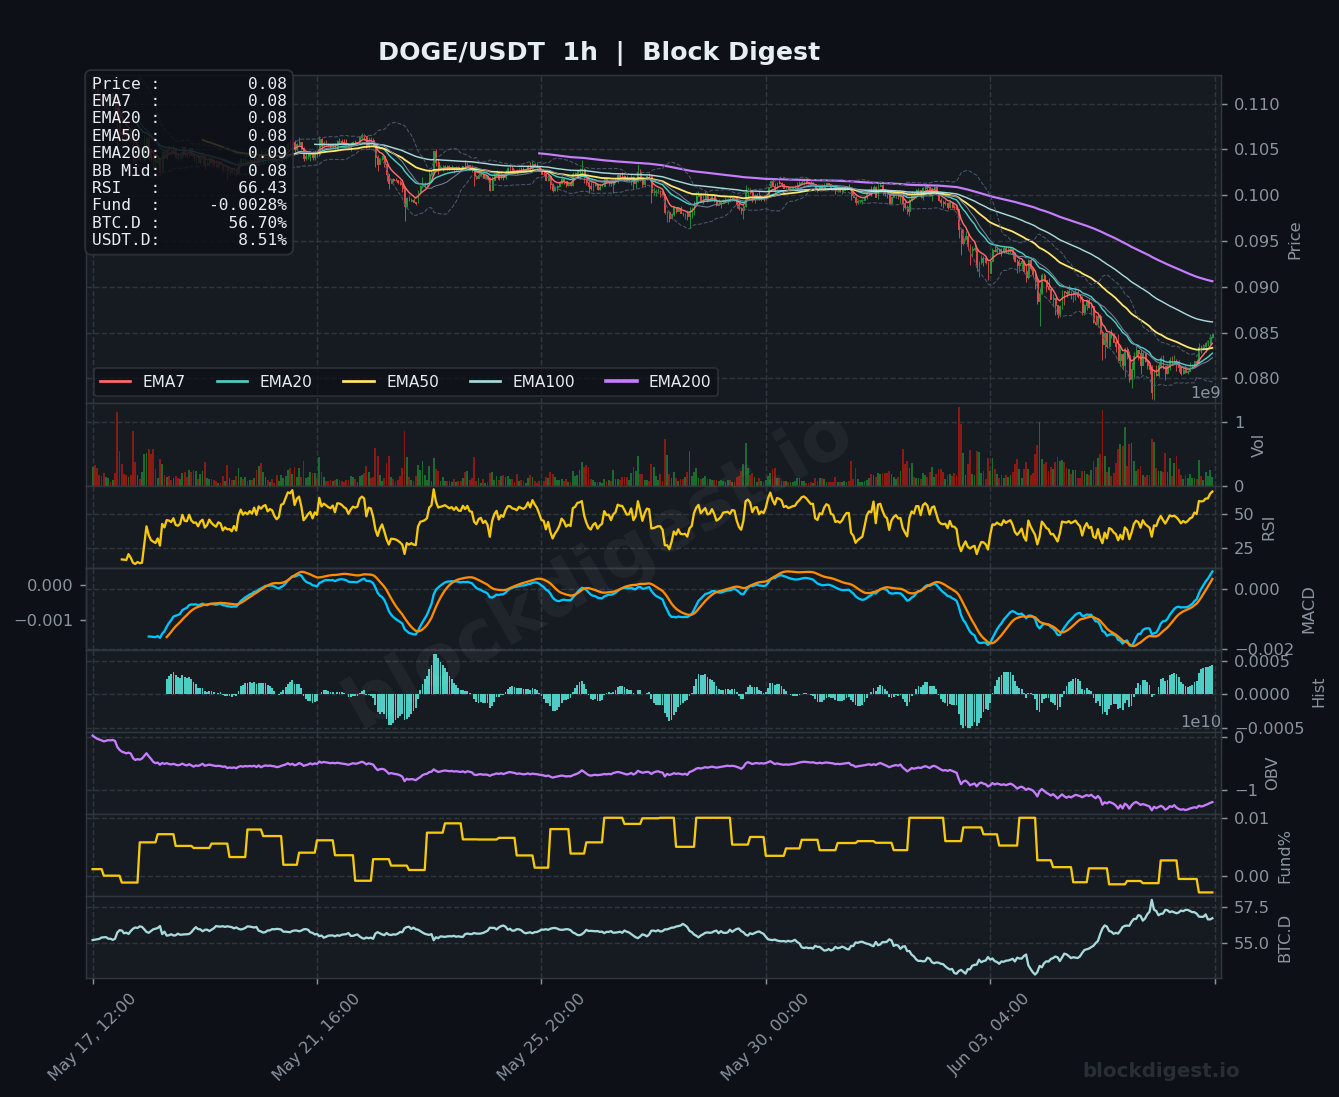
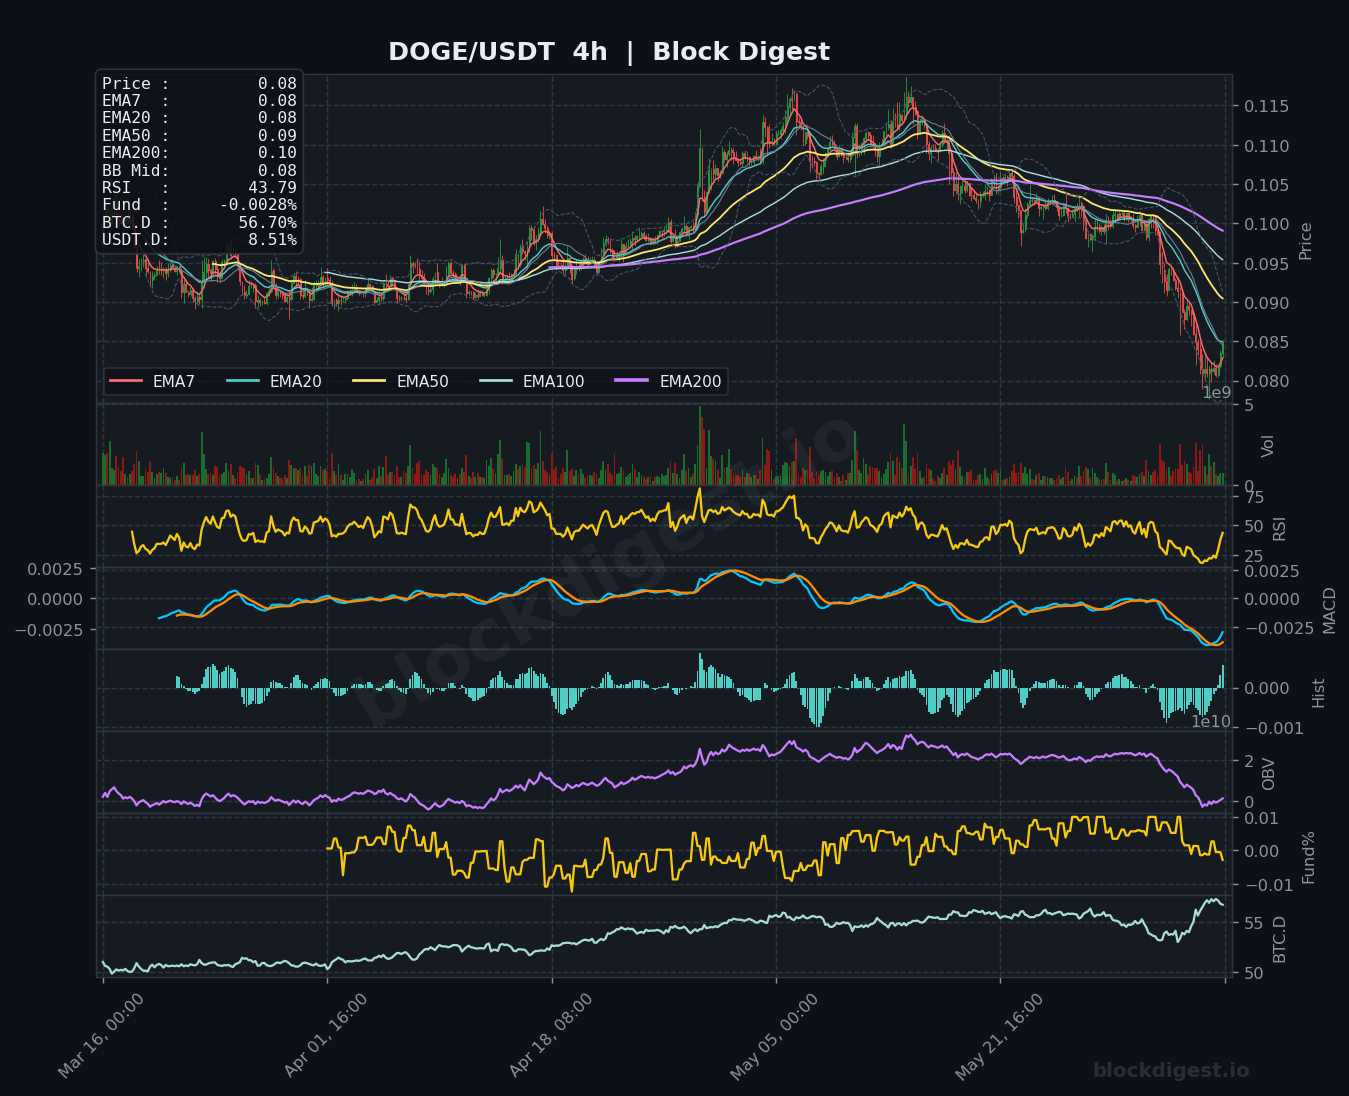
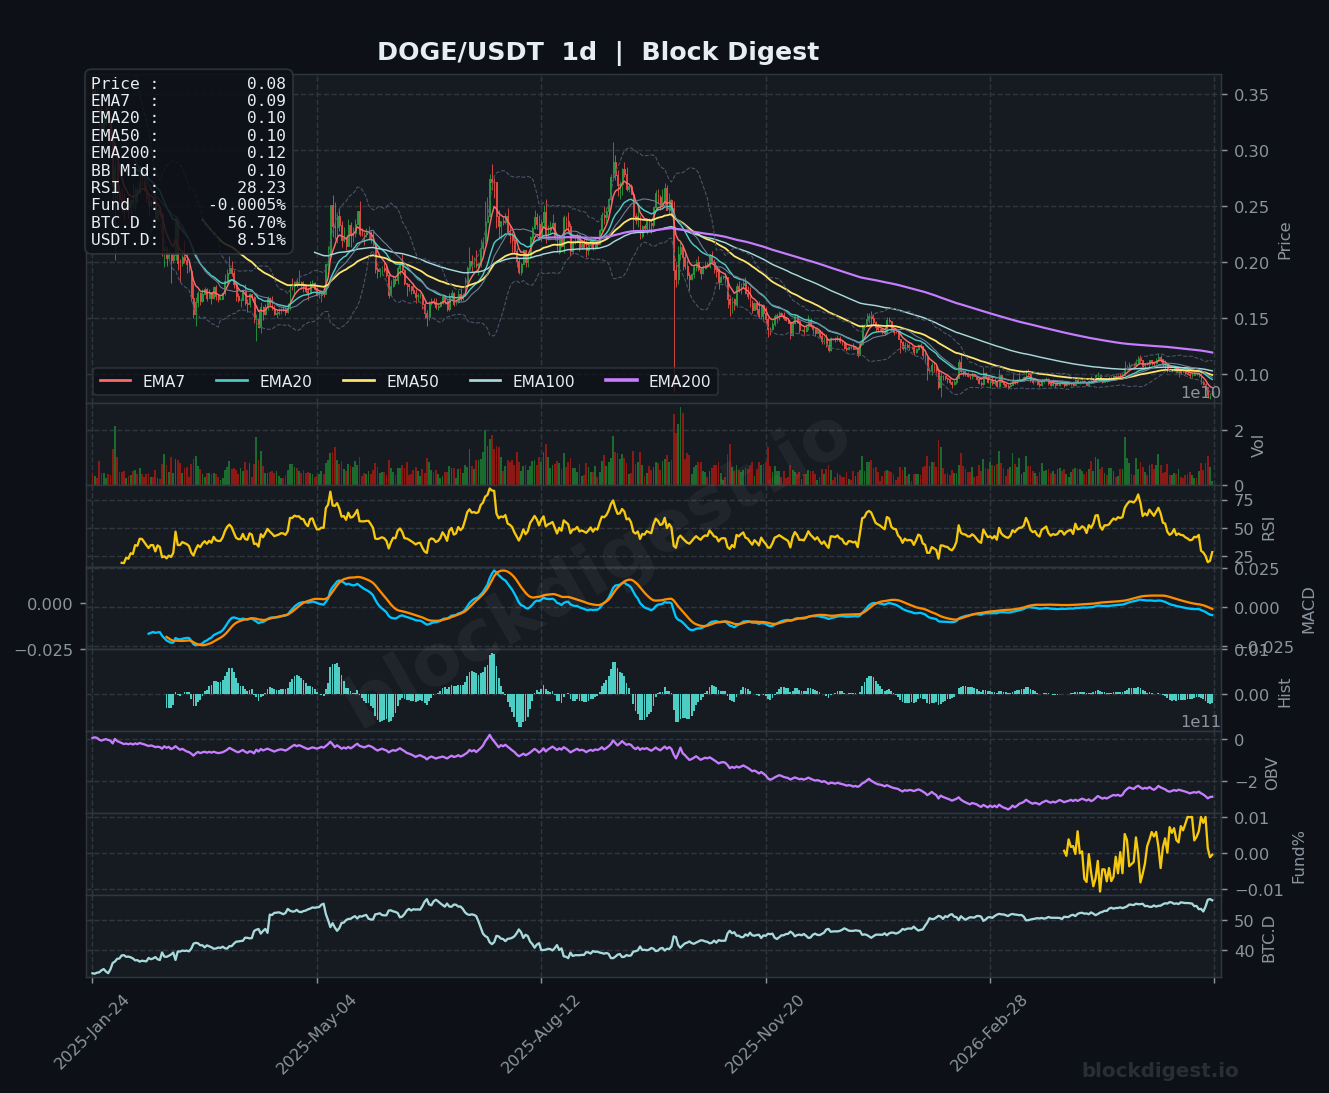
Dogecoin (DOGE)
DOGE is trading at $0.08, having suffered a brutal 20%+ weekly decline as liquidations cascaded through the meme coin sector, pushing price below all EMAs on every timeframe. The daily RSI at 28.23 is approaching oversold territory, but the 4h RSI at 43.79 and a clearly negative MACD with bearish histogram suggest the selling momentum is not yet exhausted on intermediate timeframes. OBV on the daily chart has been in persistent decline since late 2025 highs, confirming the structural absence of accumulation demand, while the 4h OBV has similarly rolled over sharply in the recent selloff. The $0.075–$0.078 zone represents the next critical support cluster; a failure there could extend losses toward $0.065, making any bullish speculative narrative contingent entirely on a broader altcoin market recovery.
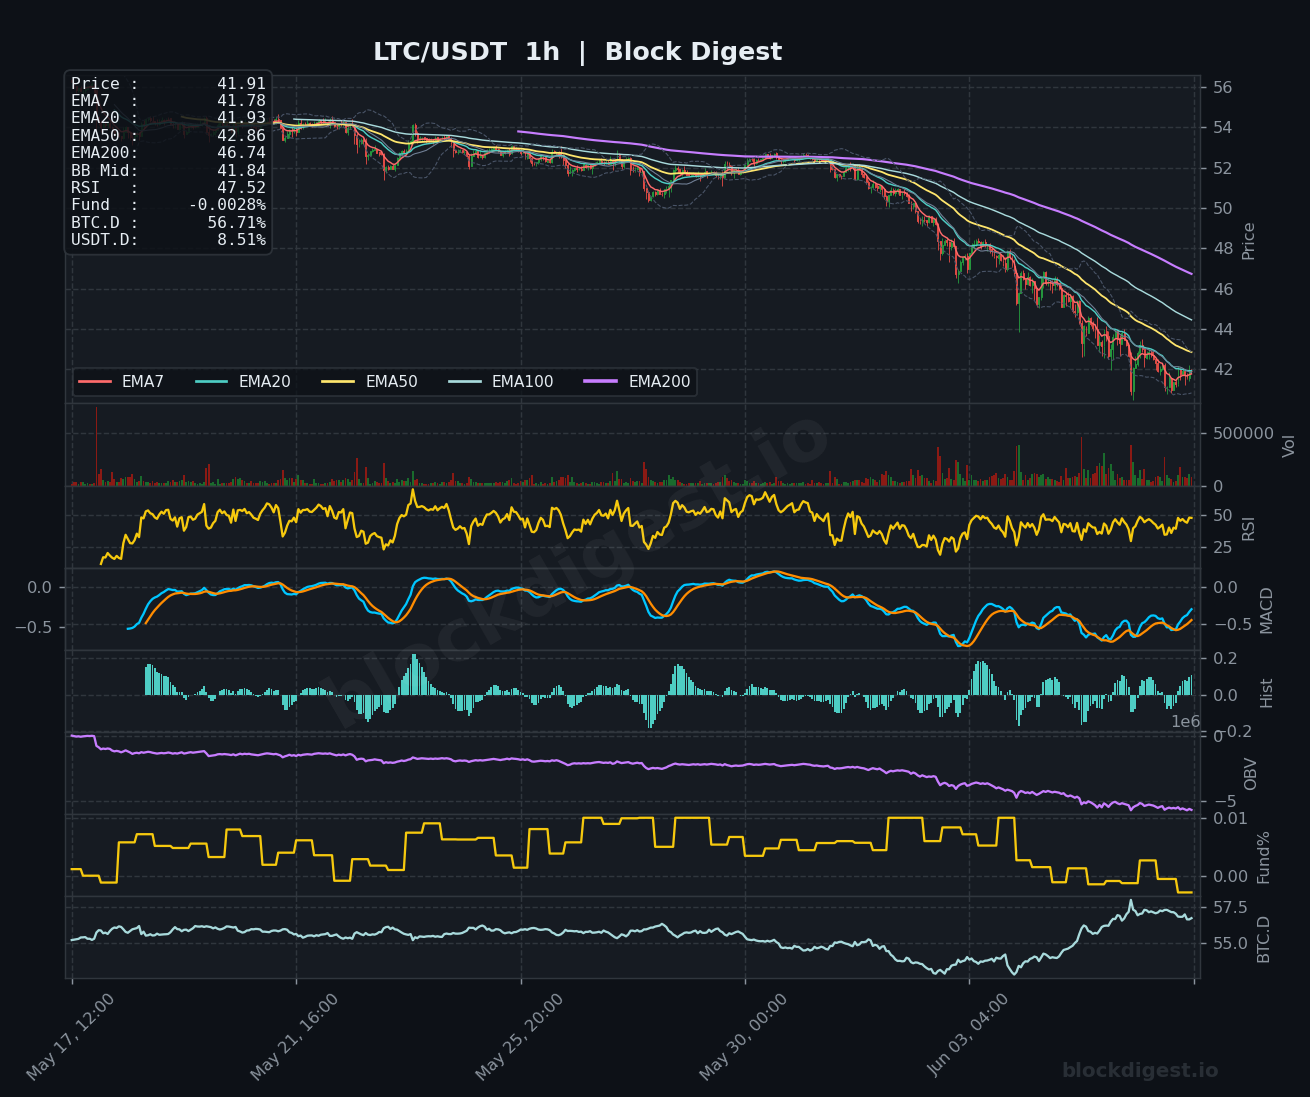
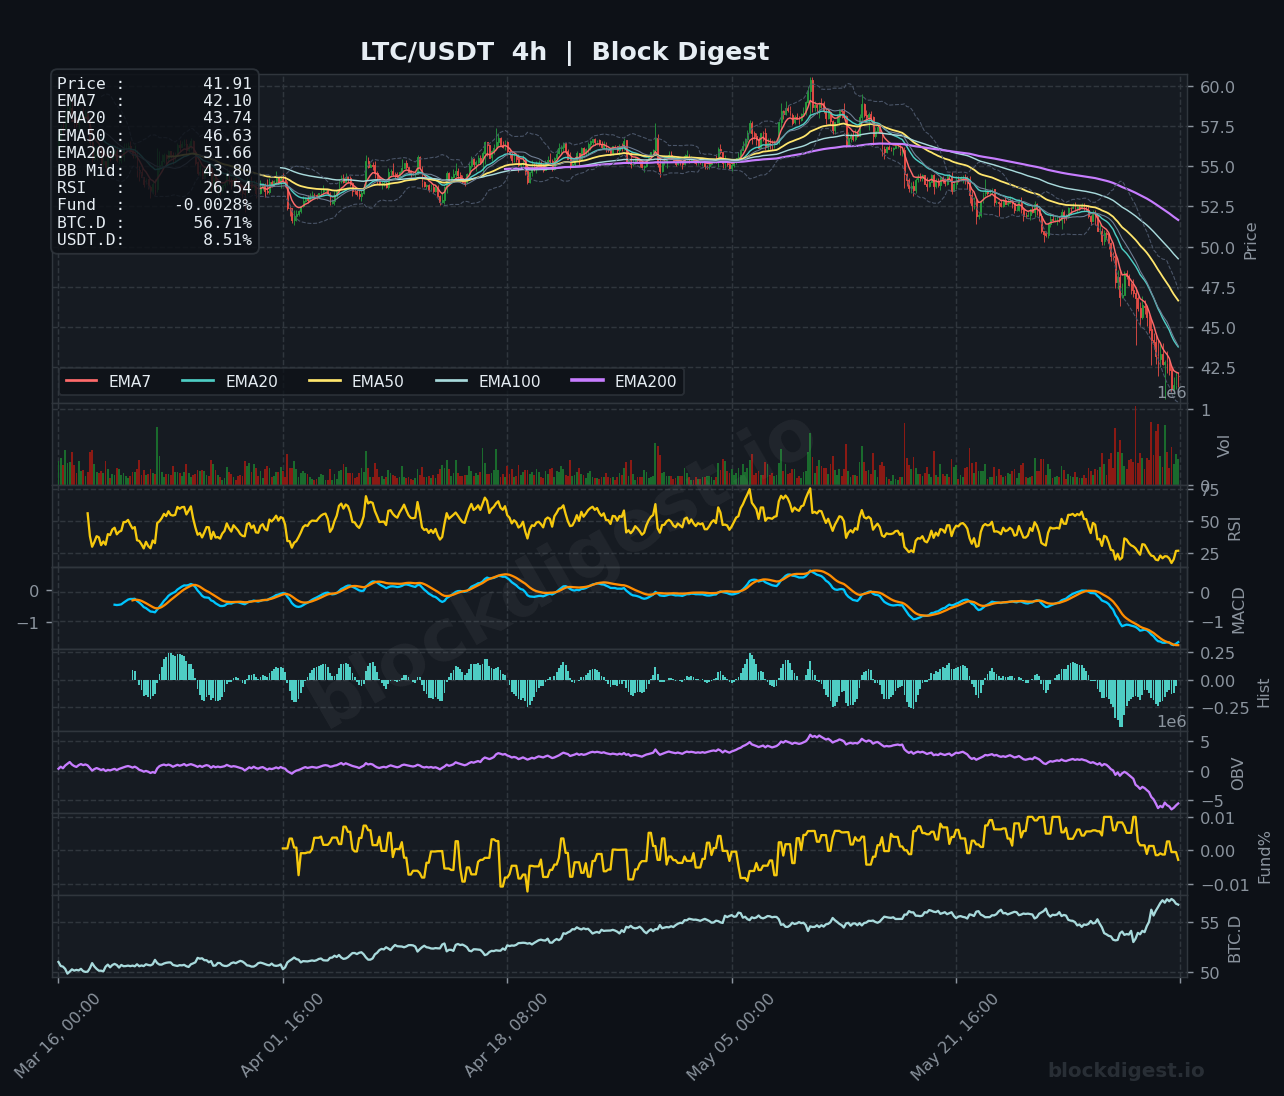
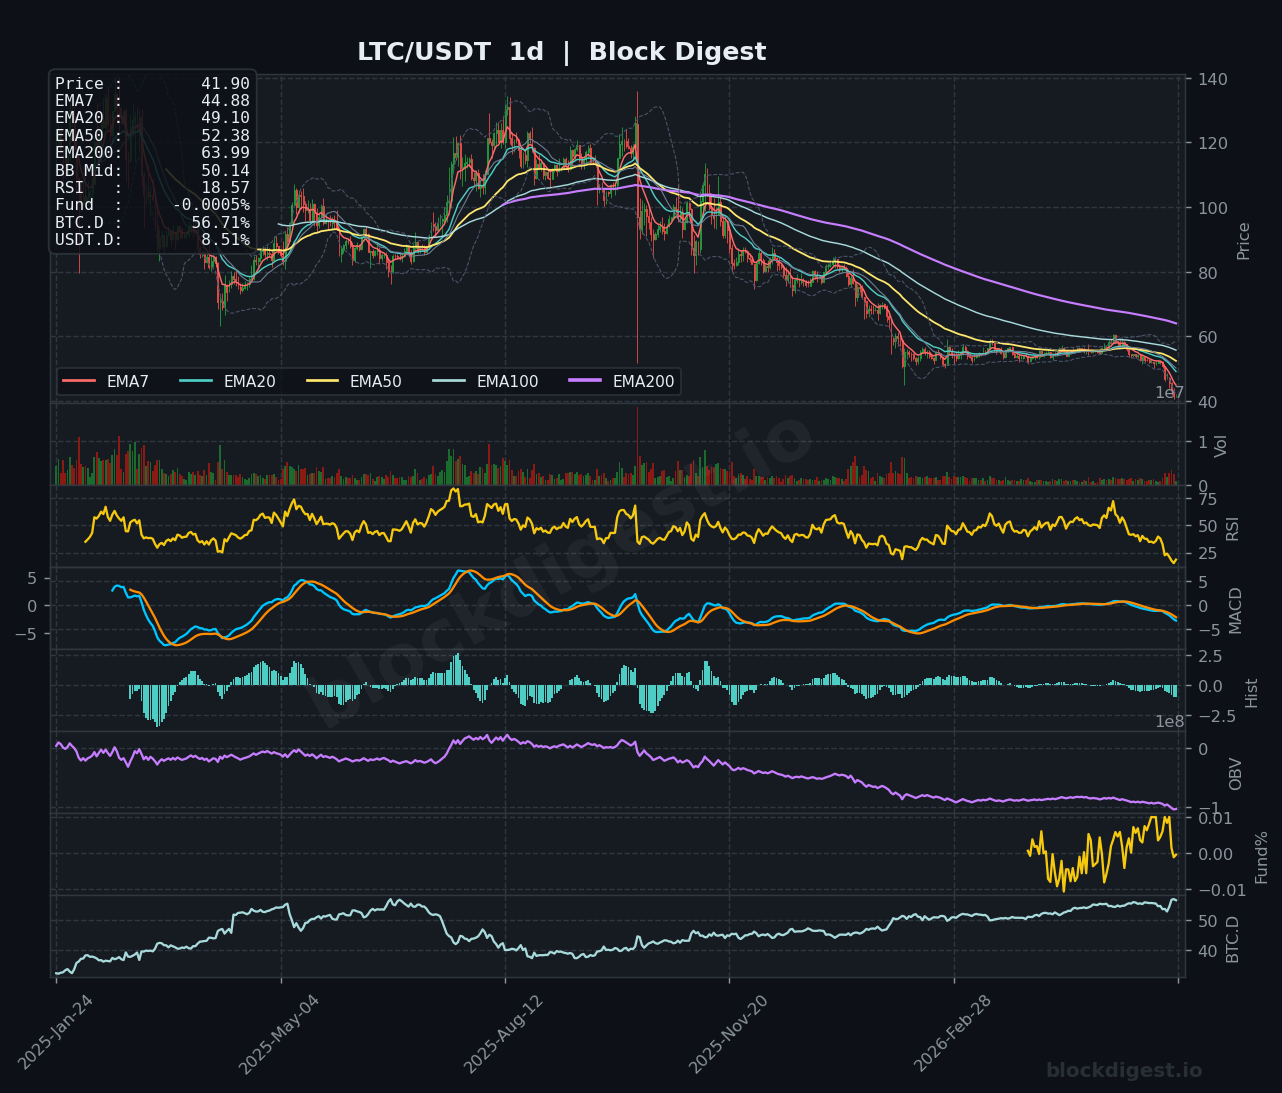
Litecoin (LTC)
LTC is trading at $41.90–$41.91, and stands out as one of the weakest charts in this roundup — the daily RSI has plunged to an alarming 18.57, the lowest reading across all six assets analyzed today, indicating extreme oversold conditions on the macro timeframe. The 4h RSI of 26.54 and a steeply negative MACD with no sign of a bullish cross confirm the intermediate downtrend is fully intact, with price trading well below all EMAs including the daily EMA50 at $52.38 and EMA200 at $63.99. OBV across all timeframes is in sustained decline, reflecting persistent distribution, while the 1h MACD remains in negative territory despite a minor stabilization near the $42 area. While the extreme daily RSI reading hints at a potential mean-reversion bounce, the structural setup is deeply bearish, and any recovery faces immediate resistance at $44–$46 before the more significant EMA cluster near $49–$52.
TRON (TRX)
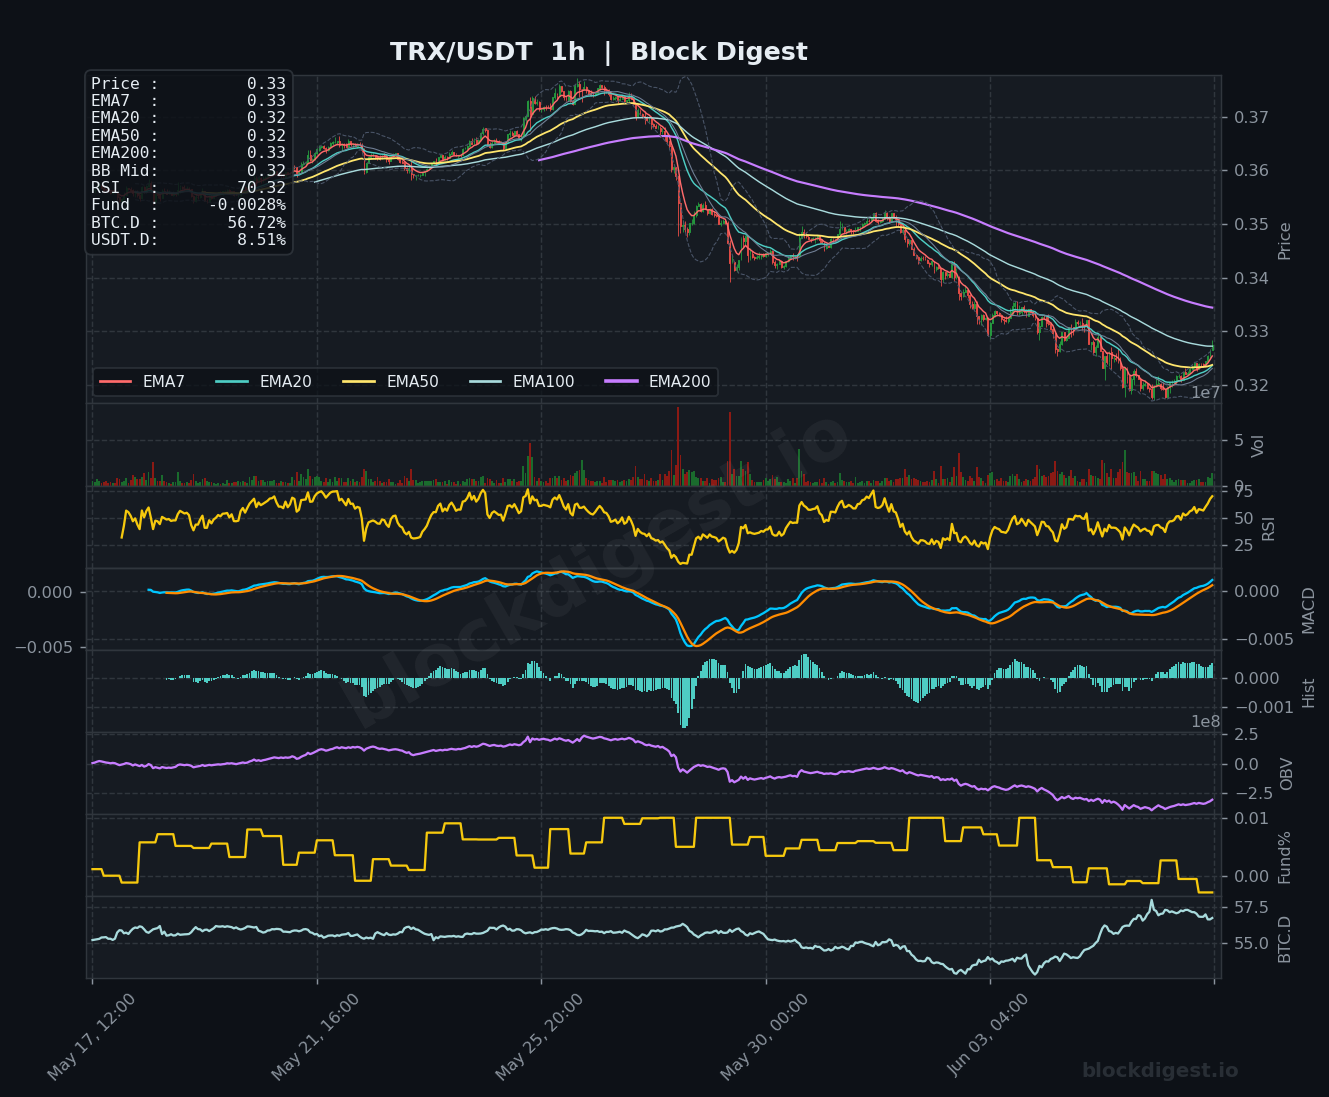
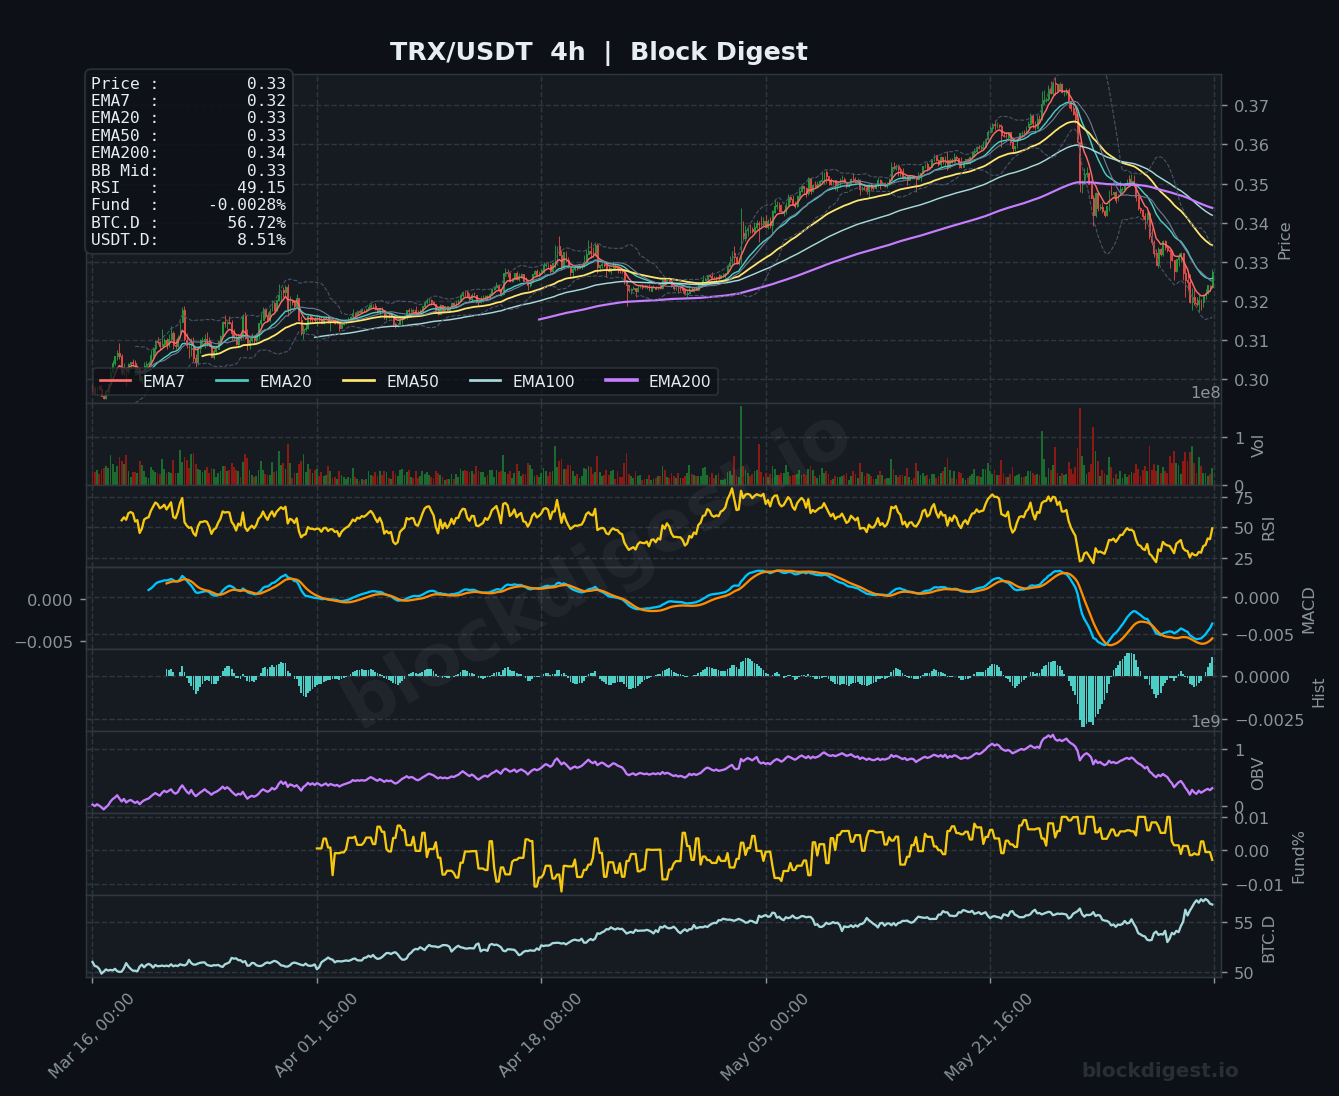
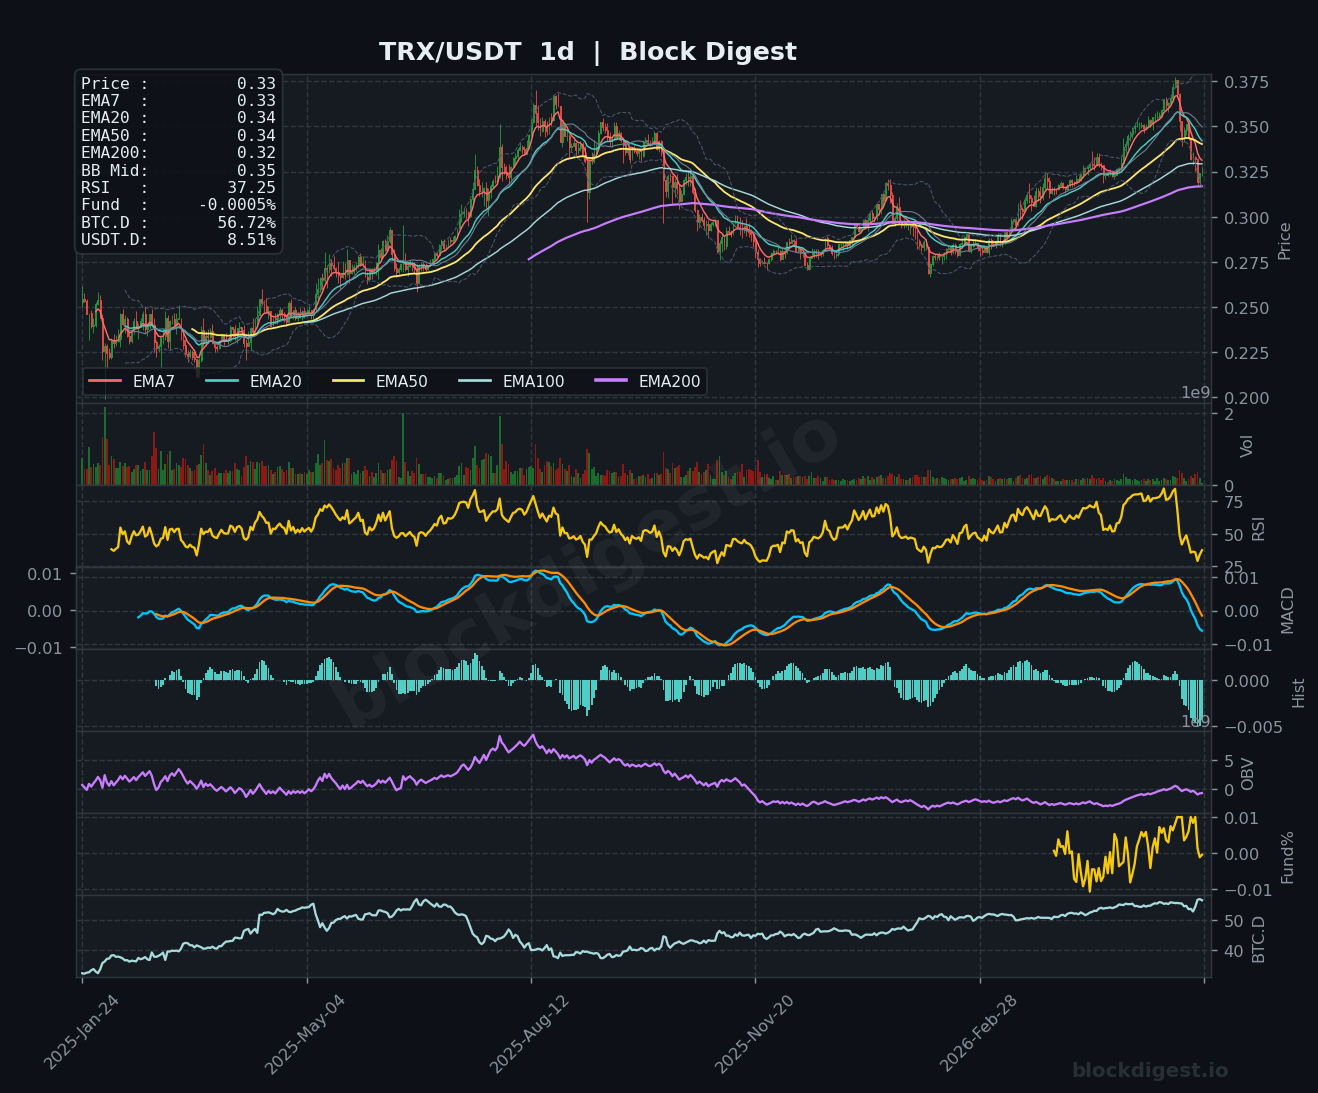
TRX at $0.33 presents one of the more nuanced setups in today’s altcoin landscape — unlike its peers, the daily chart shows TRX held a long-term uptrend from 2025 lows before a sharp recent reversal from its $0.375 peak, and crucially, the daily EMA200 remains at $0.32, providing a long-term support floor that is being tested. The 1h RSI at 70.32 signals short-term overbought conditions following a near-term bounce, while the 4h RSI at 49.15 and a MACD that remains negative but is attempting to stabilize suggest a mixed intermediate outlook. The daily RSI at 37.25 and a bearish MACD cross on the daily confirm that the recent peak has damaged the macro trend, but TRX is structurally better positioned than most altcoins given its proximity to long-term EMA support. Bulls need to defend $0.32 firmly; a sustained hold there with improving MACD momentum on the 4h could set up a recovery toward $0.34–$0.35, while a close below $0.32 would represent a meaningful technical breakdown.
Altcoin Outlook
The June 7 altcoin landscape is one of broad-based technical damage, with nearly every chart showing price below key moving averages, declining OBV, and RSI readings in oversold or near-oversold territory across multiple timeframes. TRX emerges as the relative standout, benefiting from a more constructive long-term structure and proximity to its daily EMA200 support, while LTC is the most technically distressed, with a daily RSI of 18.57 that reflects deeply capitulative selling. The key conditions to watch for any genuine altcoin recovery are: BTC dominance rolling below 55.5%, USDT.D beginning to trend lower, and individual assets reclaiming their respective EMA20 on the daily chart — none of which are currently satisfied. Until these thresholds are met, traders should treat any bounce as a potential relief rally within a larger bearish structure rather than the start of a new uptrend.
Disclaimer: This analysis is for informational purposes only and does not constitute financial advice. Cryptocurrency markets are highly volatile and unpredictable. All trading decisions should be made based on your own research and risk tolerance. Block Digest is not responsible for any financial losses incurred as a result of acting on this content.