Altcoin Daily Analysis: BTC Dominance Rises, Altcoins Under Pressure
Market Context
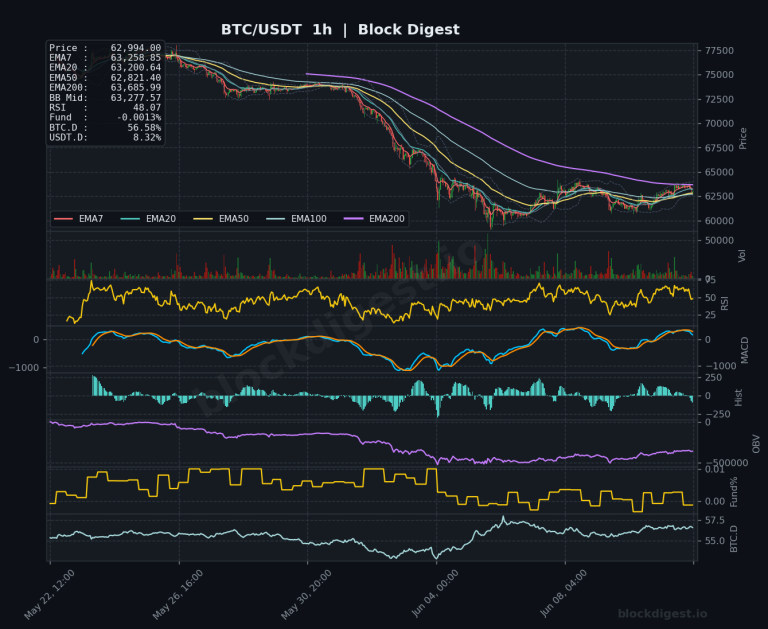
The broader altcoin market is trading under significant pressure as of June 11, 2026, with BTC dominance sitting at 56.51% — a level that has been trending upward over recent weeks, reflecting continued capital rotation away from altcoins and toward Bitcoin. USDT.D at 8.37% remains elevated, signaling that market participants are maintaining defensive cash positions and risk appetite across the altcoin complex remains subdued. Until BTC dominance shows a meaningful rollover and USDT.D begins contracting, the structural headwinds for altcoins are likely to persist.
Solana (SOL)
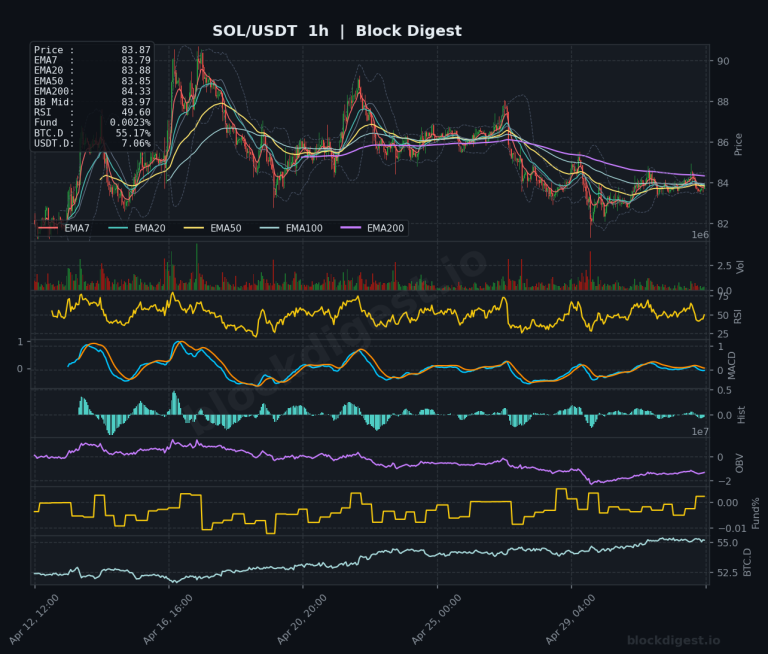
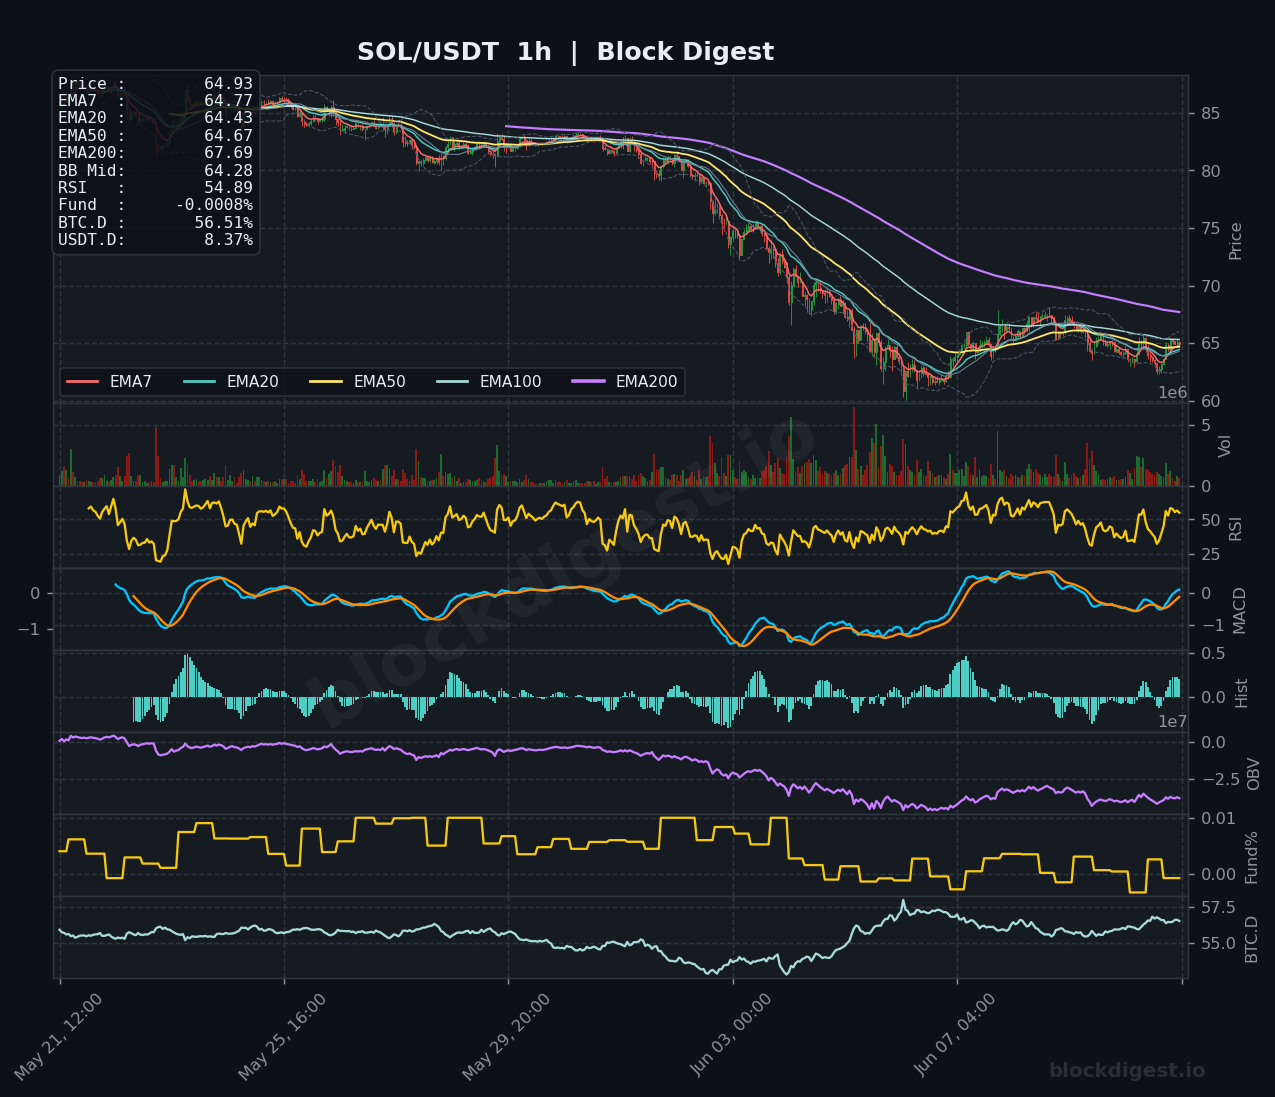
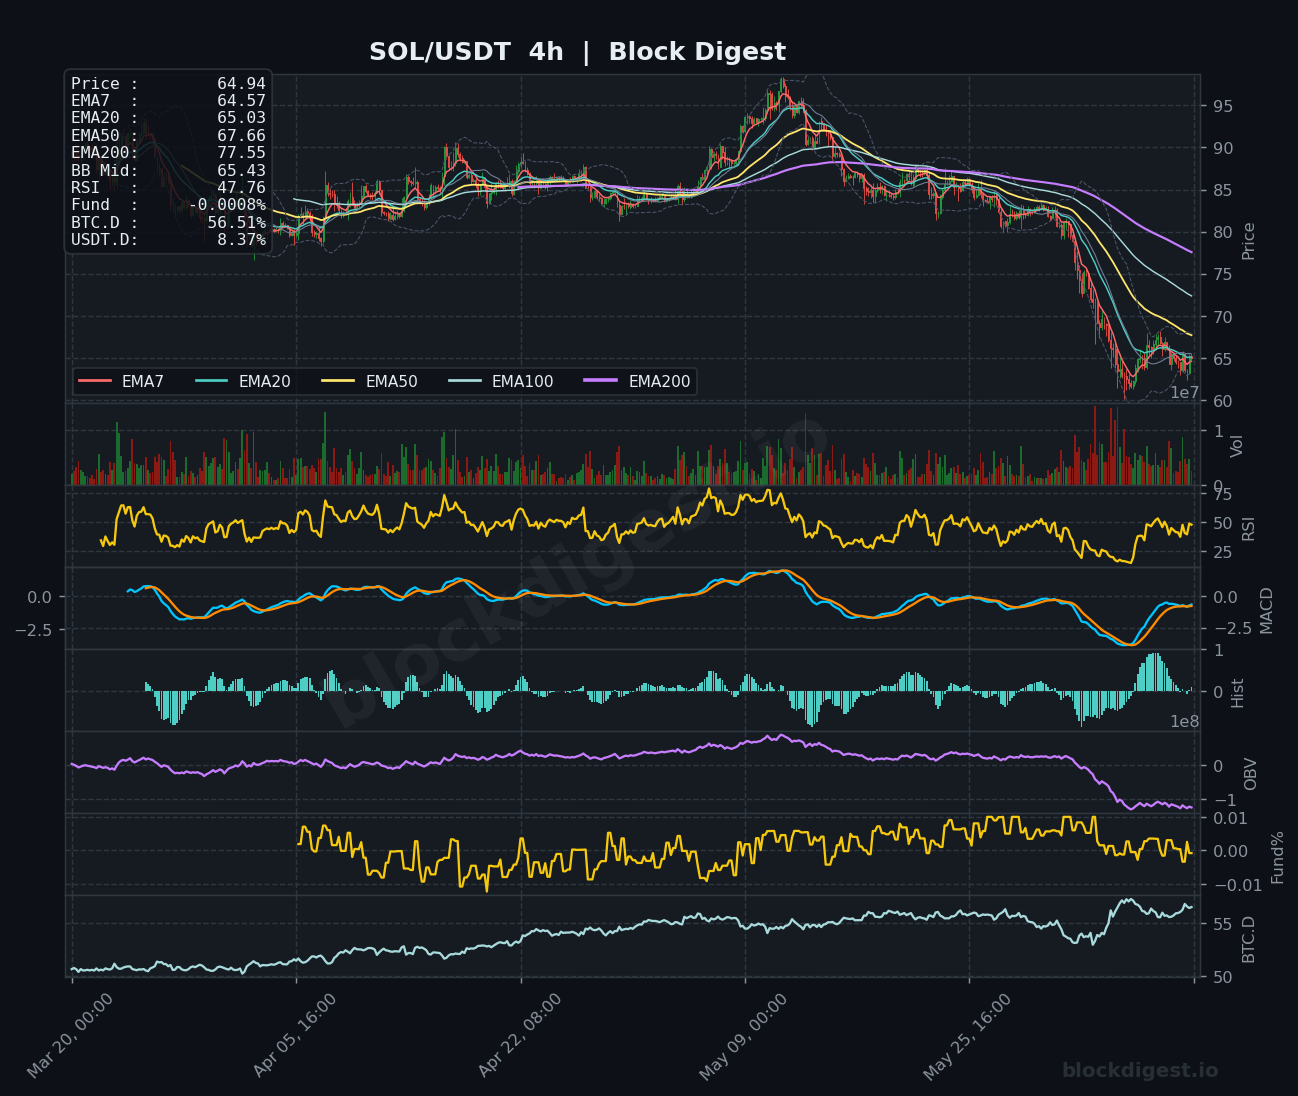
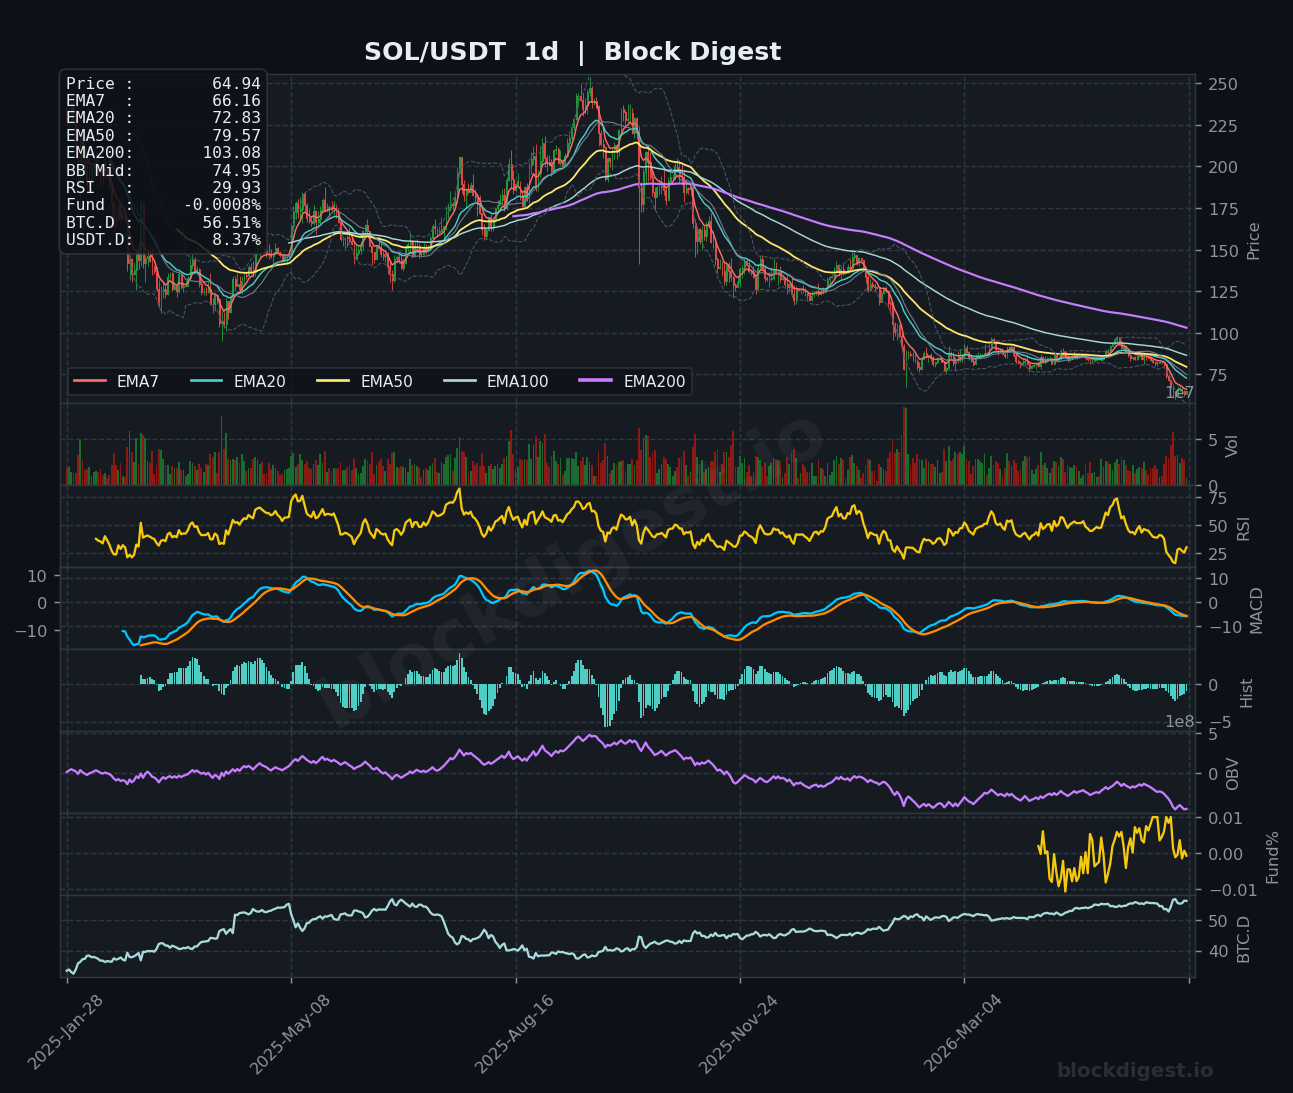
SOL is currently trading at $64.94, having suffered a pronounced multi-week downtrend from highs near $95, with price now trading well below all major EMAs — the EMA200 on the 4h sits at $77.55, while even the short-term EMA20 at $65.03 is acting as resistance. The daily RSI has collapsed to approximately 29.93, placing SOL in deeply oversold territory on the longer timeframe, though oversold readings alone are insufficient to signal reversal in the absence of a momentum catalyst. The 4h MACD remains in negative territory with the histogram just beginning to show early signs of compression, and OBV on both the 1h and 4h continues to trend lower, indicating persistent distribution. The short-term bias remains bearish with a tentative stabilization watch around the $62–$65 range; a sustained reclaim of $67–$68 would be the minimum needed to shift intraday sentiment.
XRP (XRP)
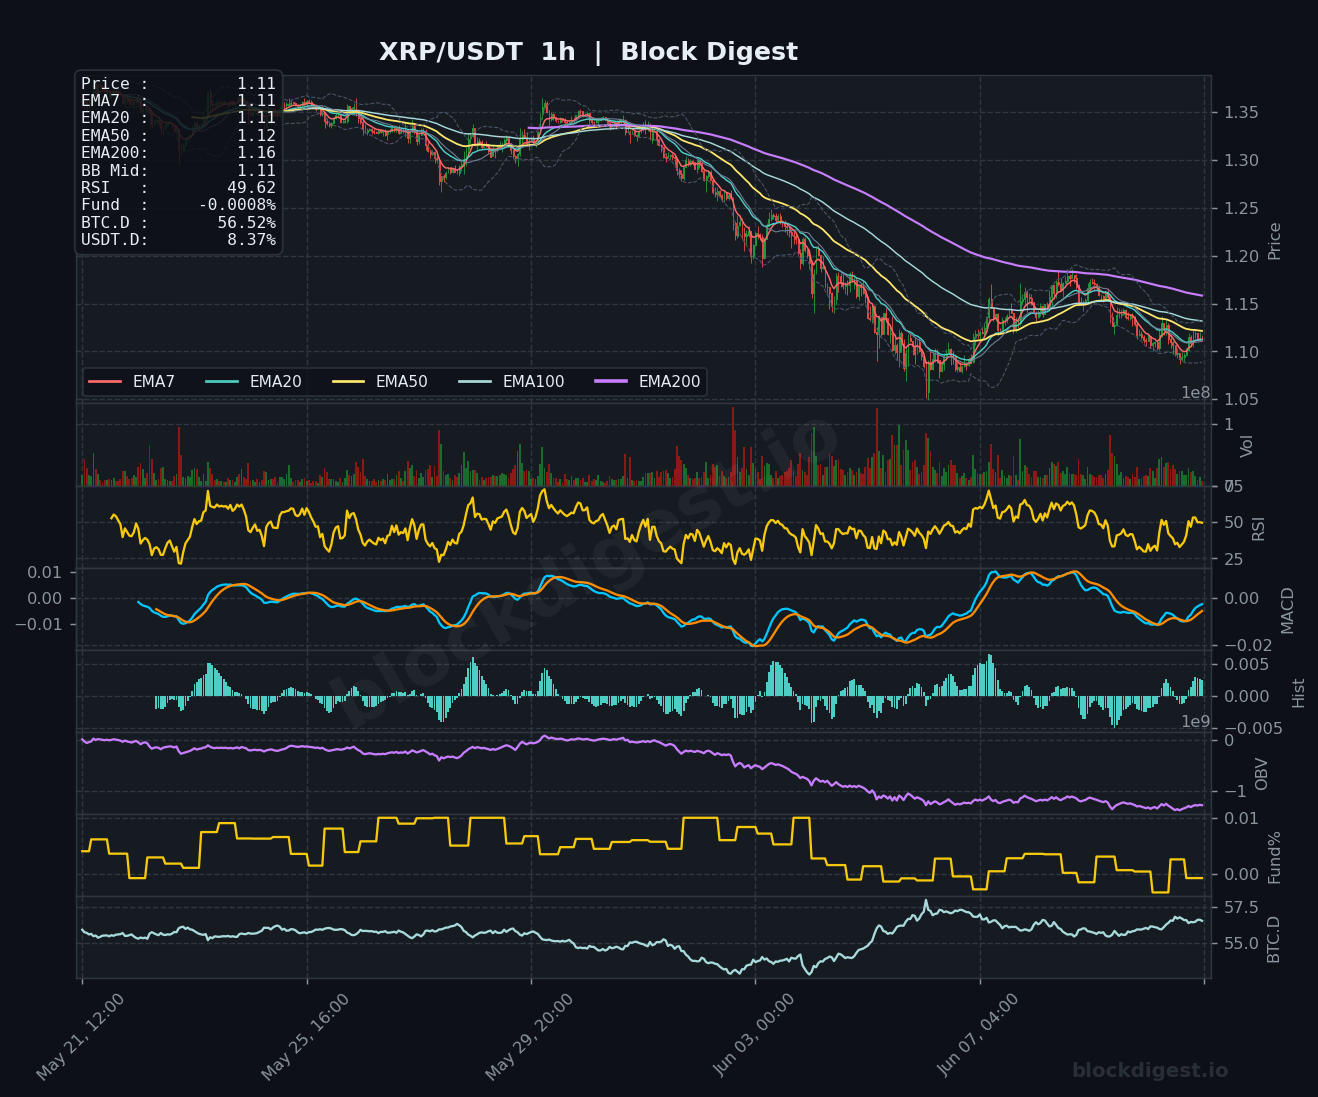
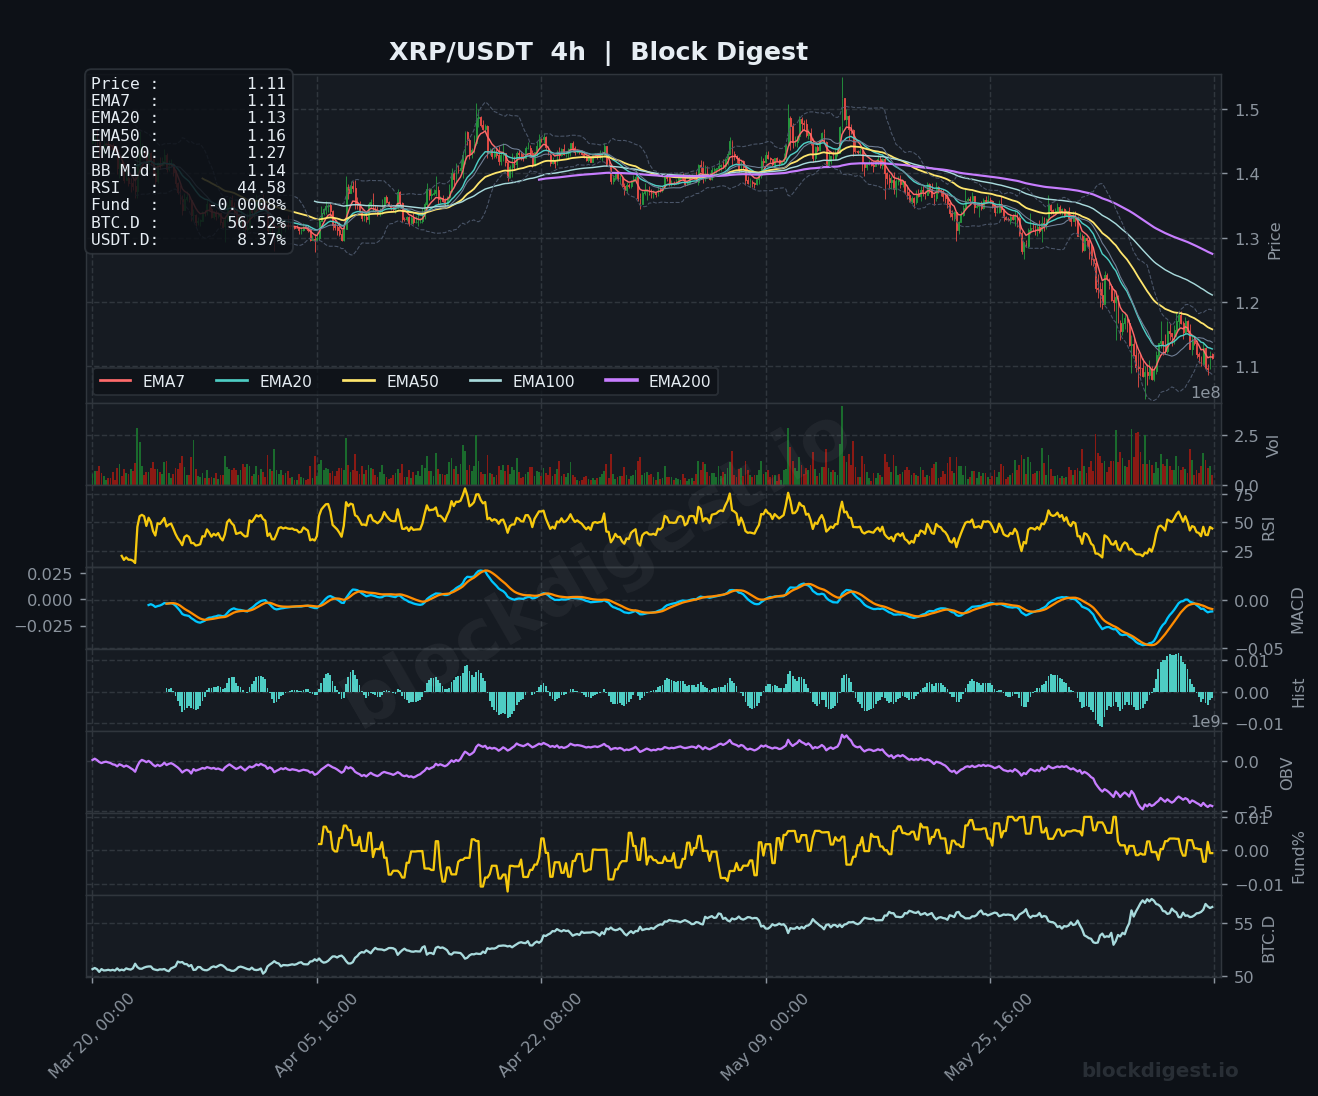
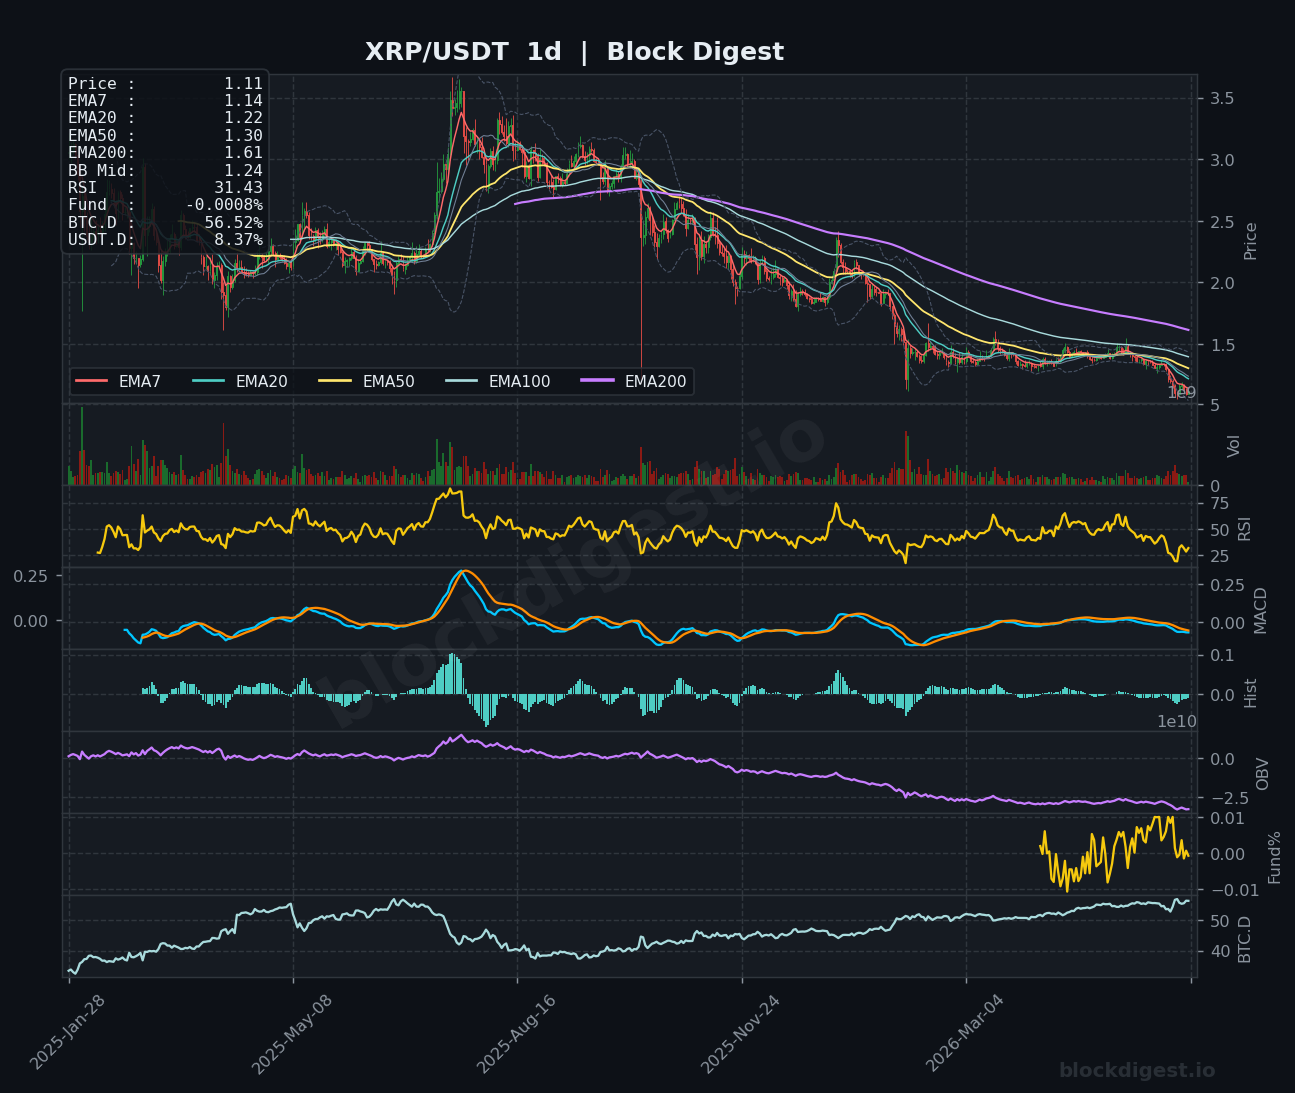
XRP is trading at $1.11, extending a sharp decline from the $1.45–$1.50 zone, with price now pressing against multi-week lows and sitting beneath all key EMAs on both the 1h and 4h charts. The 4h RSI reads 44.58 and the daily RSI has fallen to 31.43 — approaching oversold conditions — while the 4h MACD signal line remains below zero with the histogram showing some tentative narrowing that bears watching. On-balance volume on the daily timeframe continues to slope downward, confirming that selling pressure has been consistent and not merely a short-term flush. Key support is the $1.08–$1.10 zone; a failure here opens the door toward $1.00, while a recovery above $1.15–$1.16 (EMA200 on 1h) would be the first indication of stabilization.
BNB (BNB)
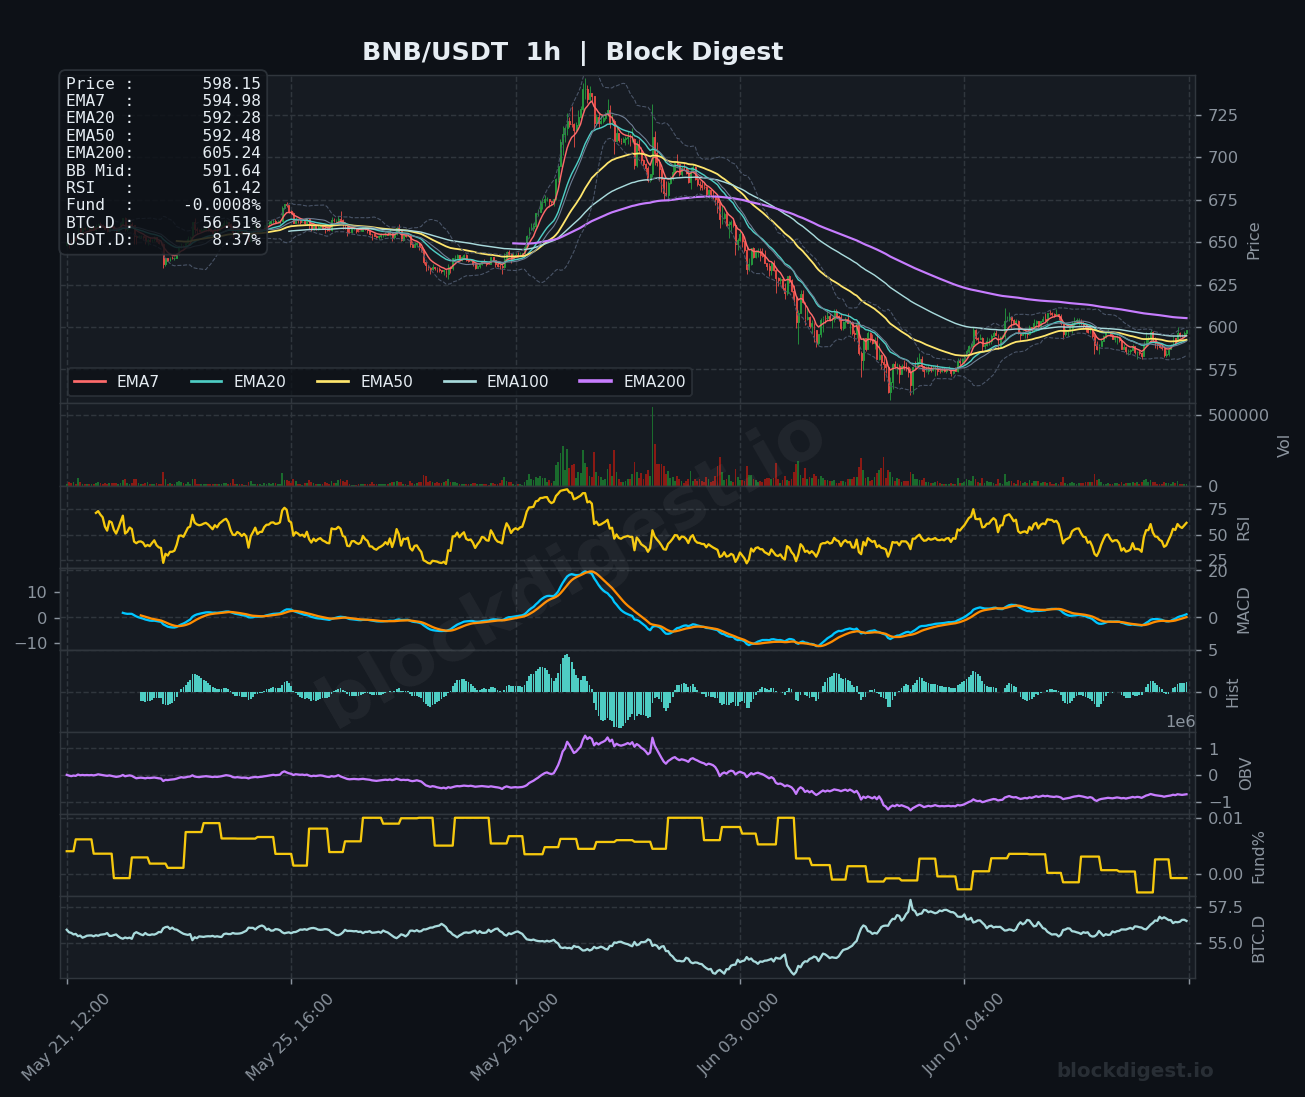
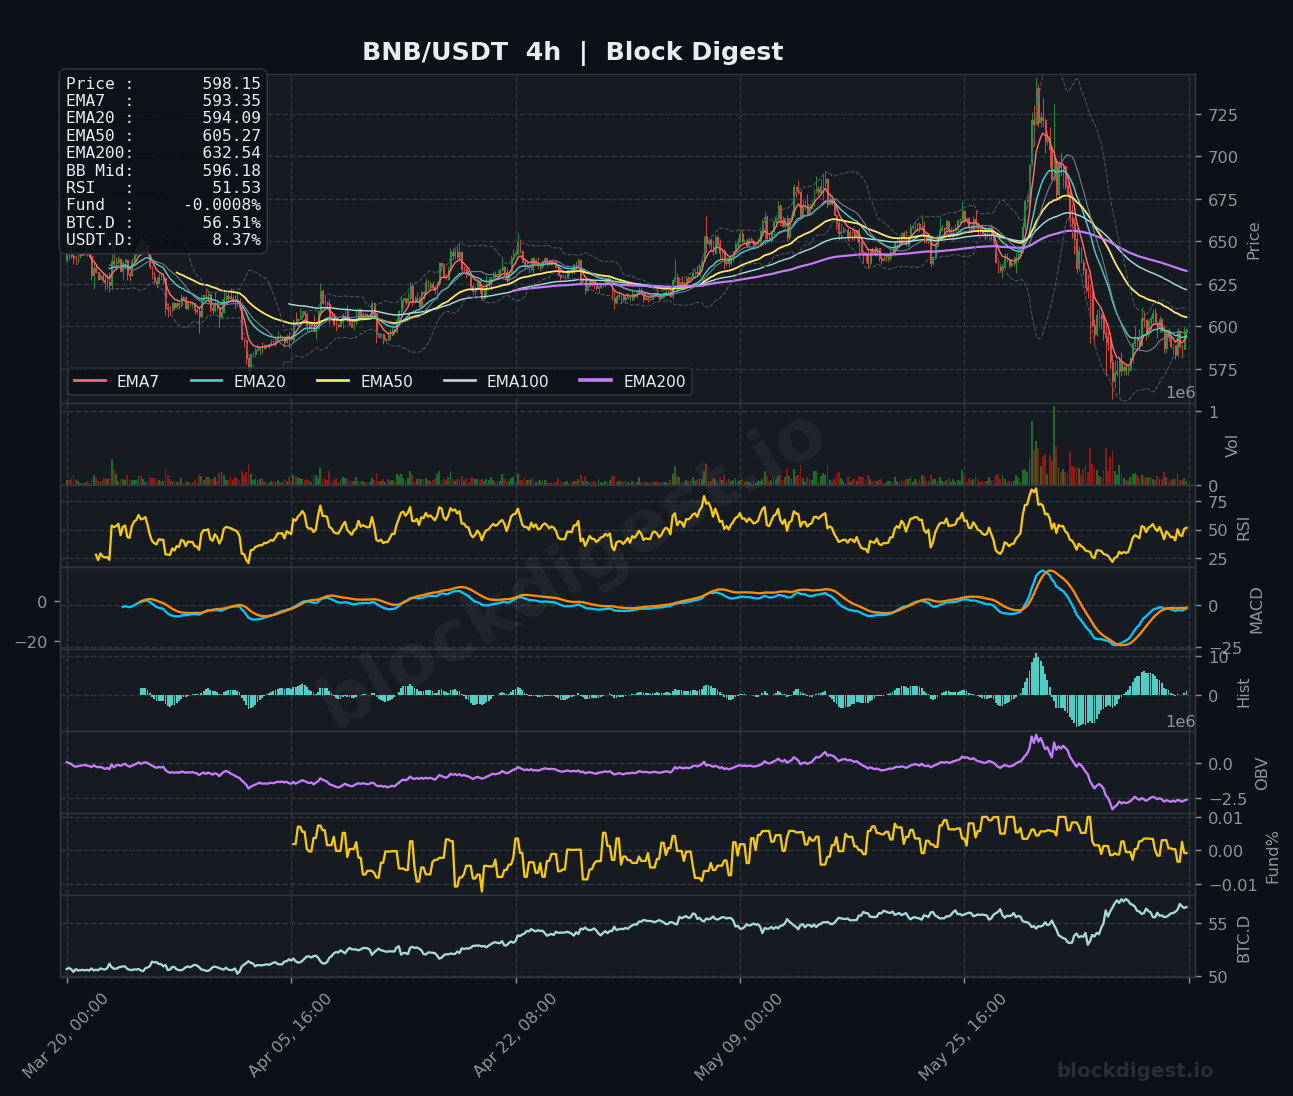
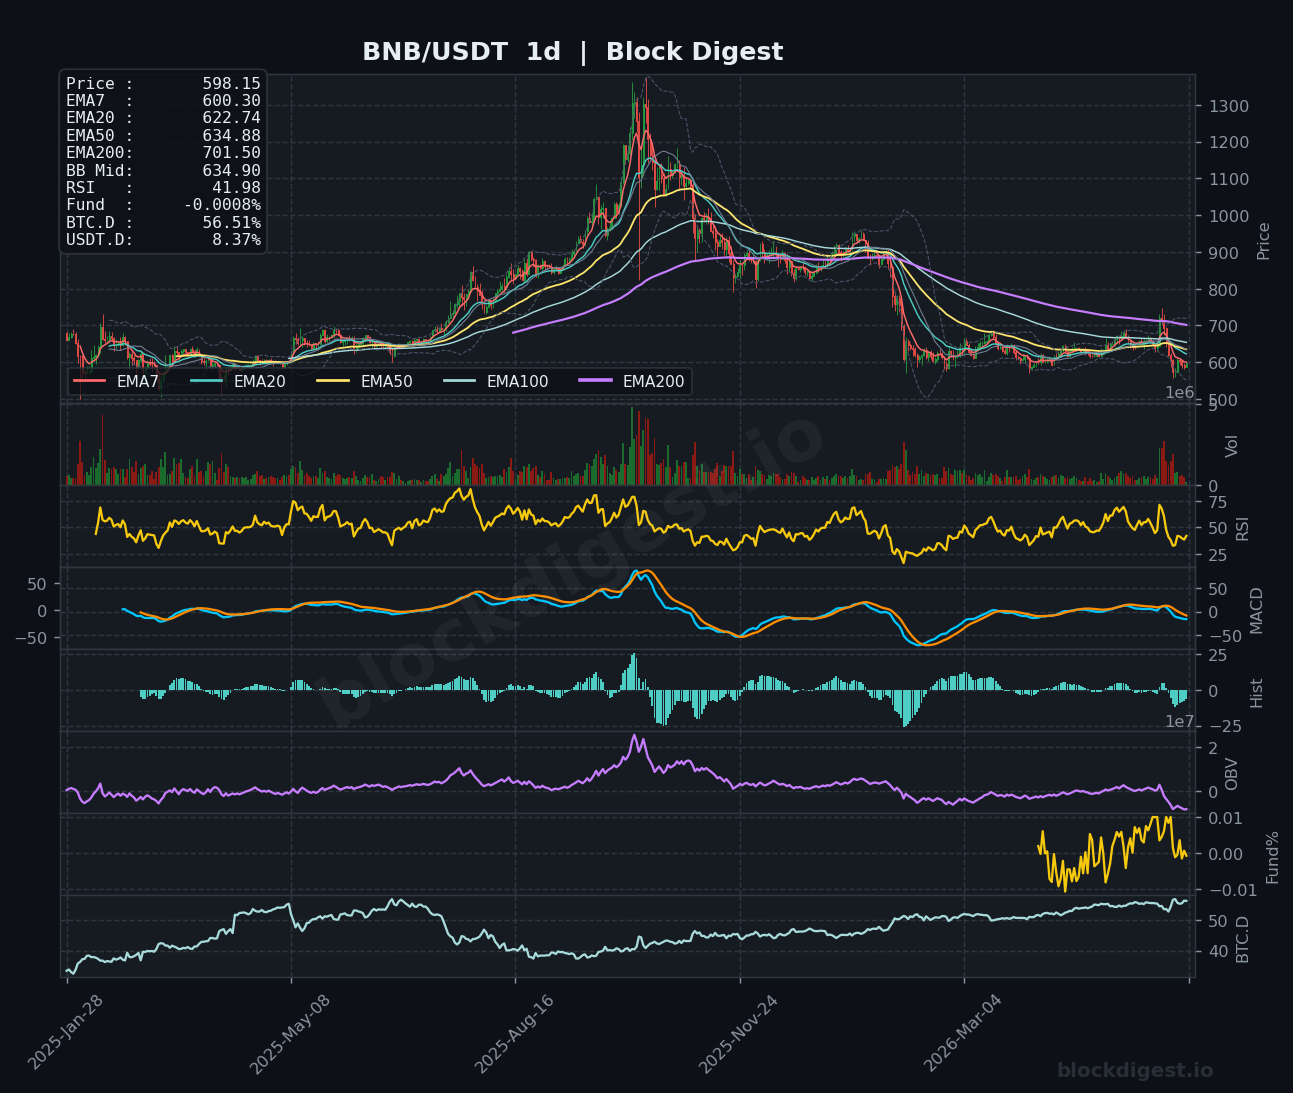
BNB is currently priced at $598.15, holding just above the psychologically significant $600 level after a steep correction from the recent swing high near $730. The 1h RSI reads a relatively firm 61.42 — the strongest short-term reading among all six assets reviewed today — suggesting some near-term buying interest has emerged off the lows, though the 4h RSI at 51.53 and daily RSI at 41.98 still reflect a bearish intermediate trend. All EMAs on the daily chart are stacked bearishly, with EMA200 at $701.50 far overhead and the EMA50 at $634.88 serving as the nearest meaningful resistance. The 4h MACD is attempting a bullish cross from deeply negative territory, which, if confirmed, could support a short-term bounce toward $615–$620, but the macro structure remains decidedly bearish while price holds below the EMA50.
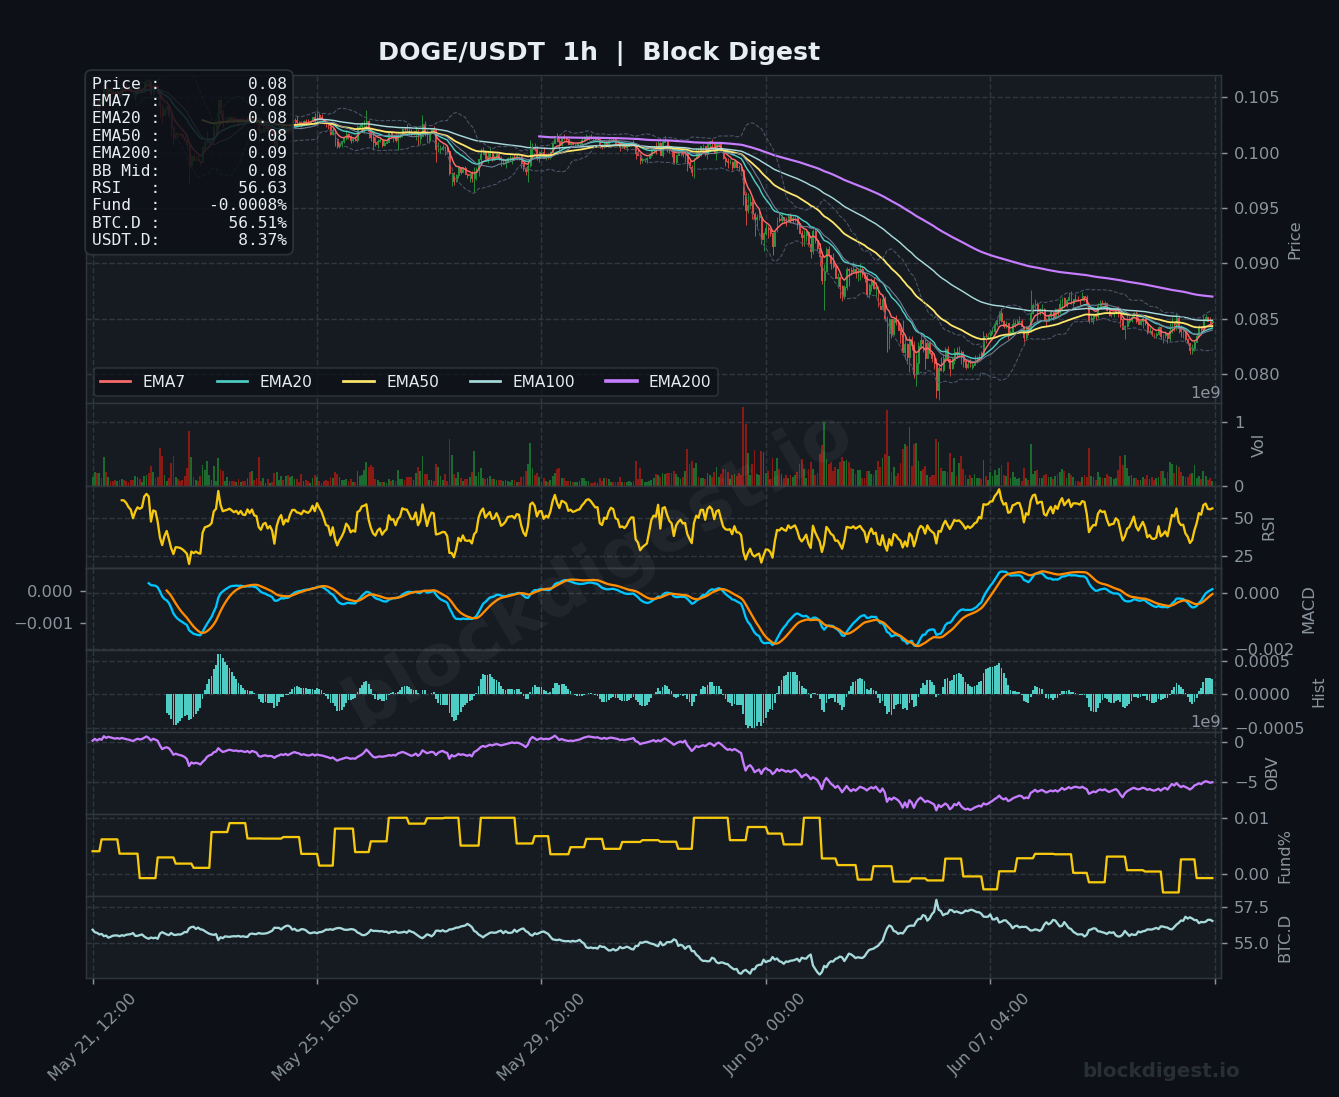
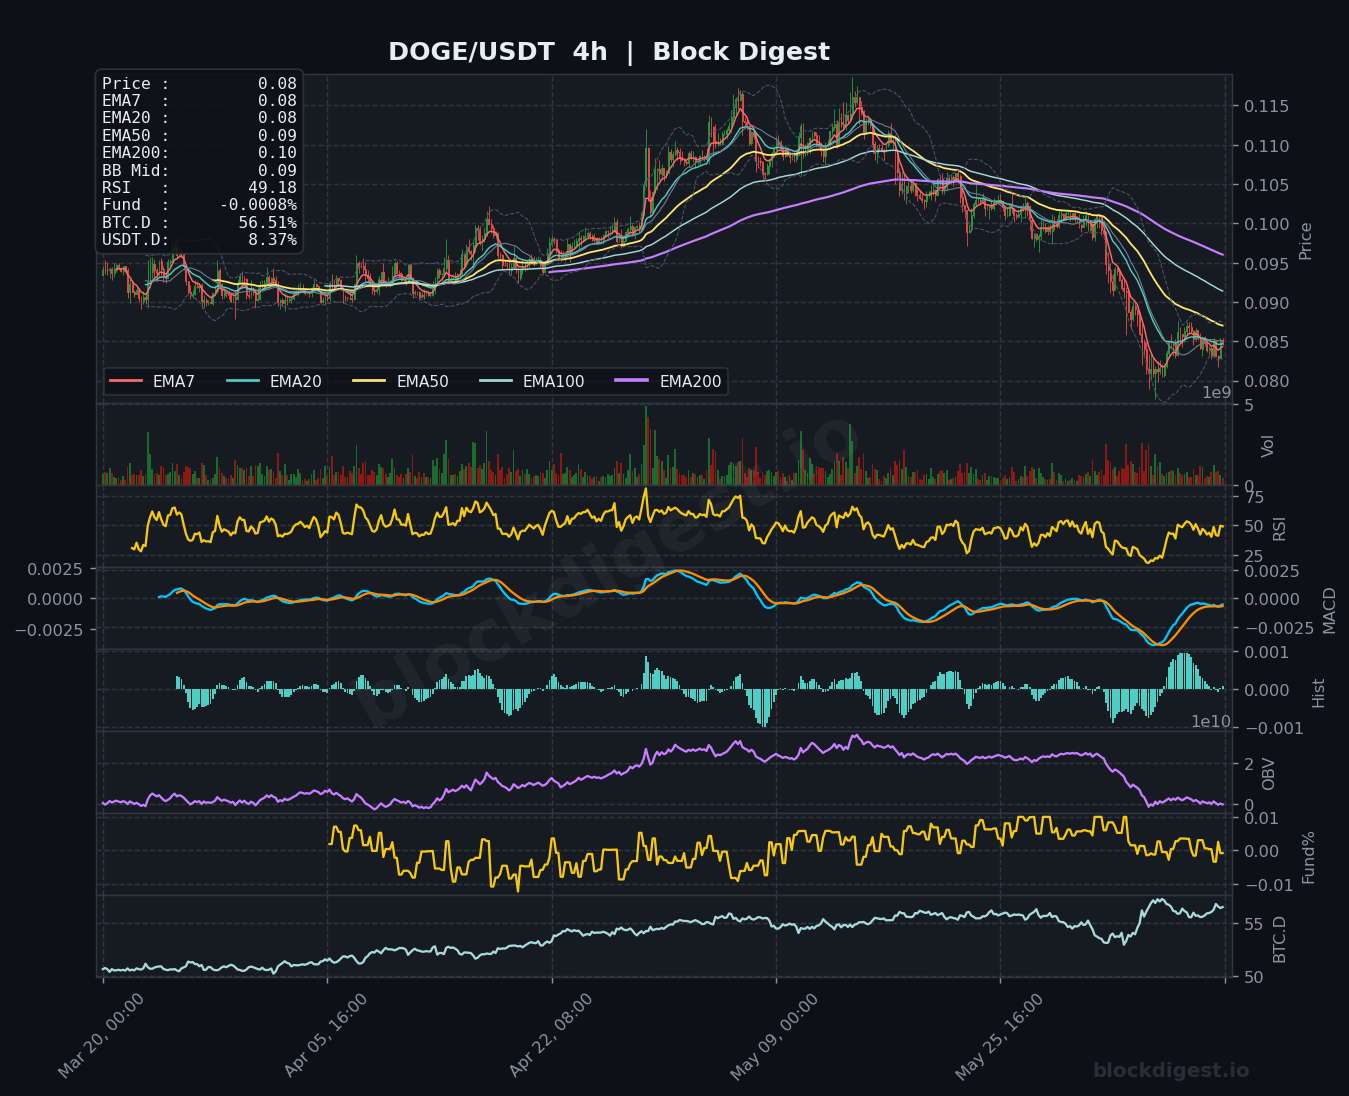
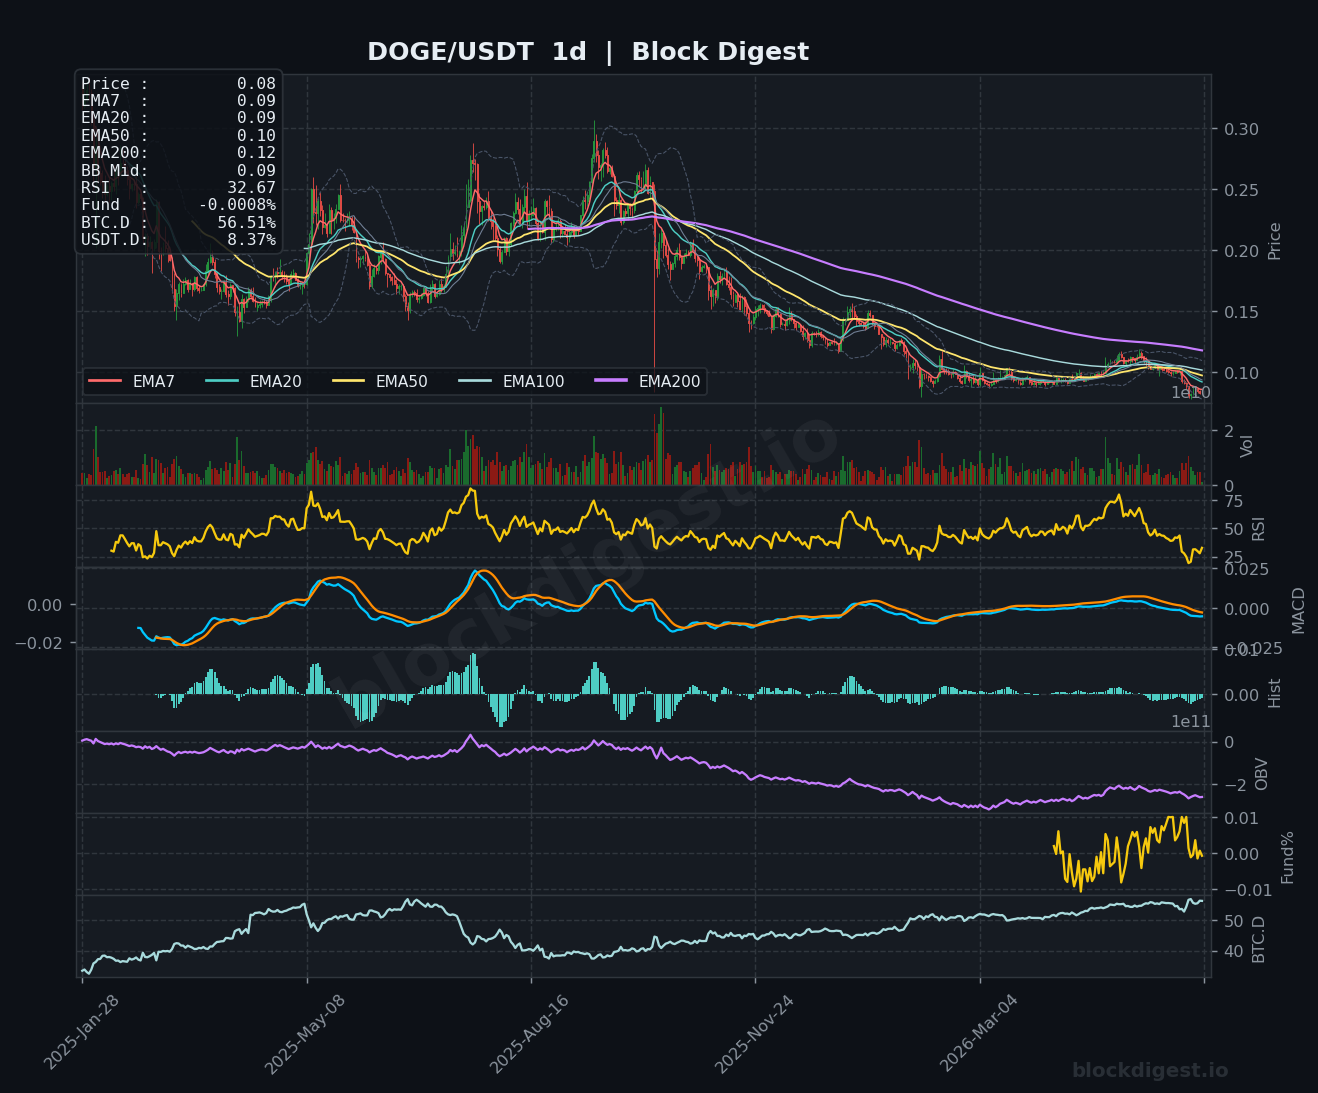
Dogecoin (DOGE)
DOGE is trading at $0.0800, having declined sharply from highs near $0.115, with the current price compressed just above the lower Bollinger Band on multiple timeframes. The daily RSI at 32.67 indicates near-oversold conditions, mirroring the broader altcoin weakness, while the 4h RSI at 49.18 suggests the short-term bounce off recent lows has stalled without conviction. The 1h MACD is attempting to cross into positive territory near zero, and the histogram is showing small positive bars, hinting at a micro-recovery attempt, but OBV on the daily remains in a clear downtrend. Immediate resistance sits at $0.085–$0.087 (EMA50/EMA100 on 1h), and a clean break above $0.090 would be required to suggest any meaningful shift in trend; support below is thin toward $0.076–$0.078.
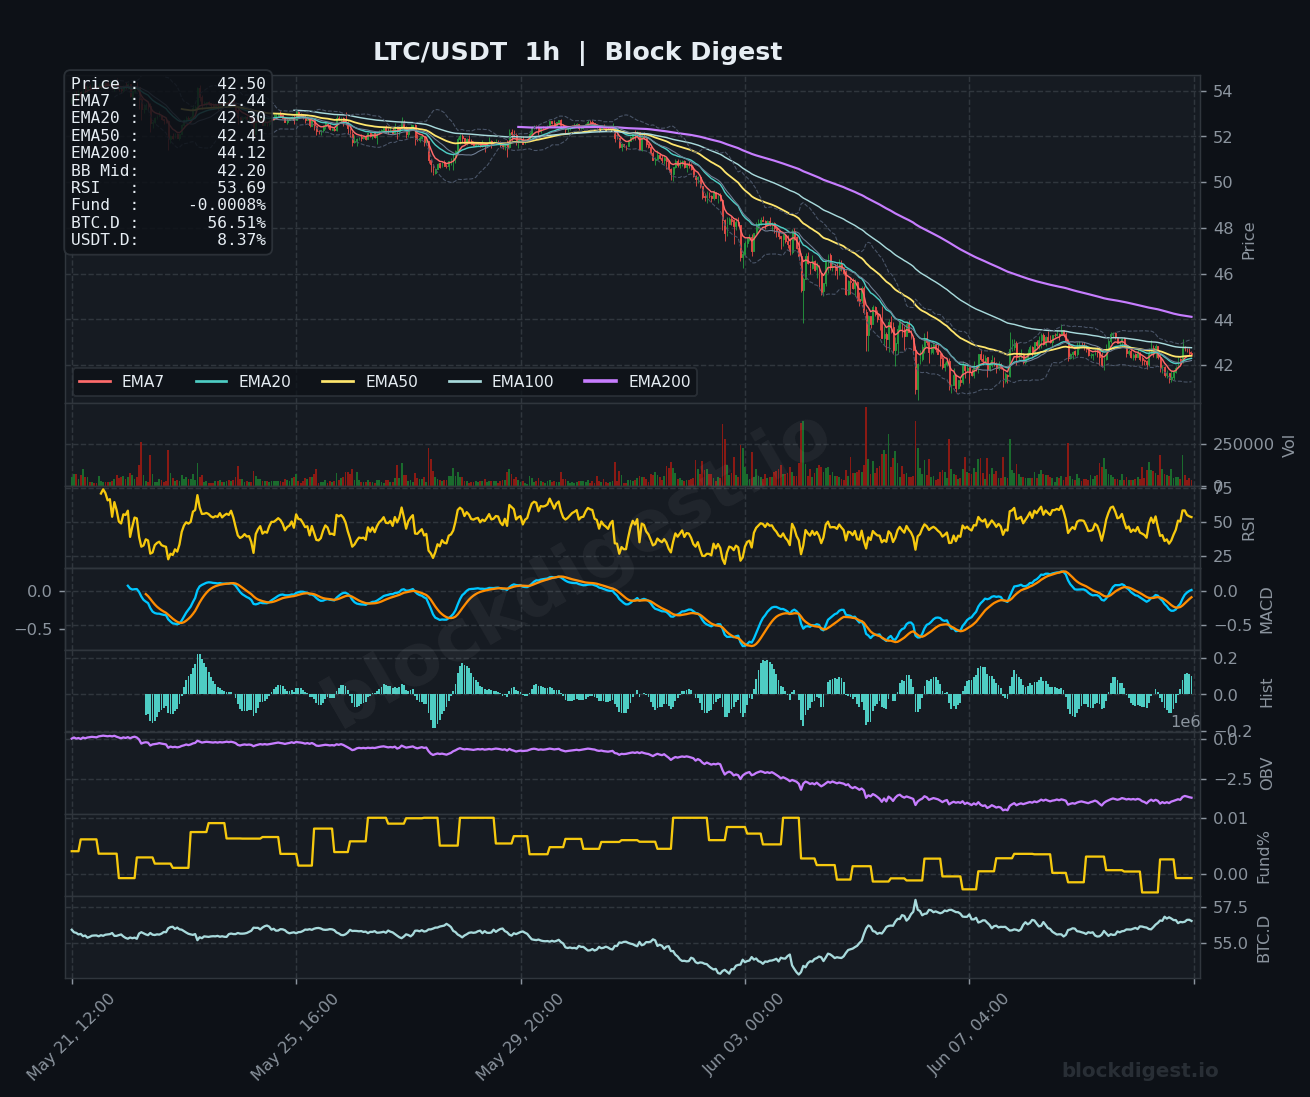
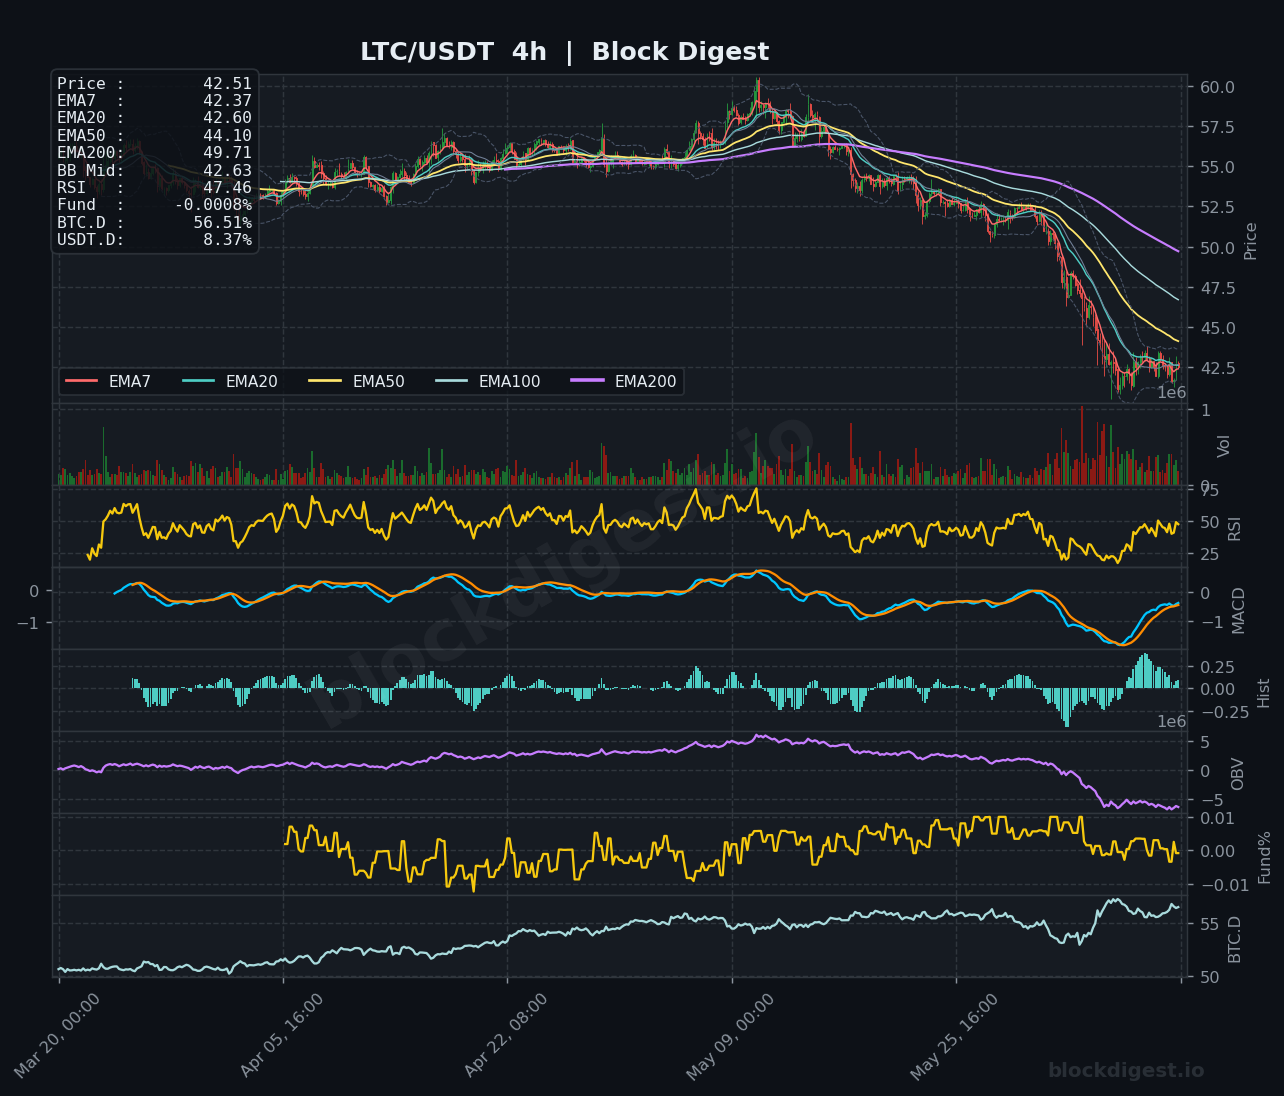
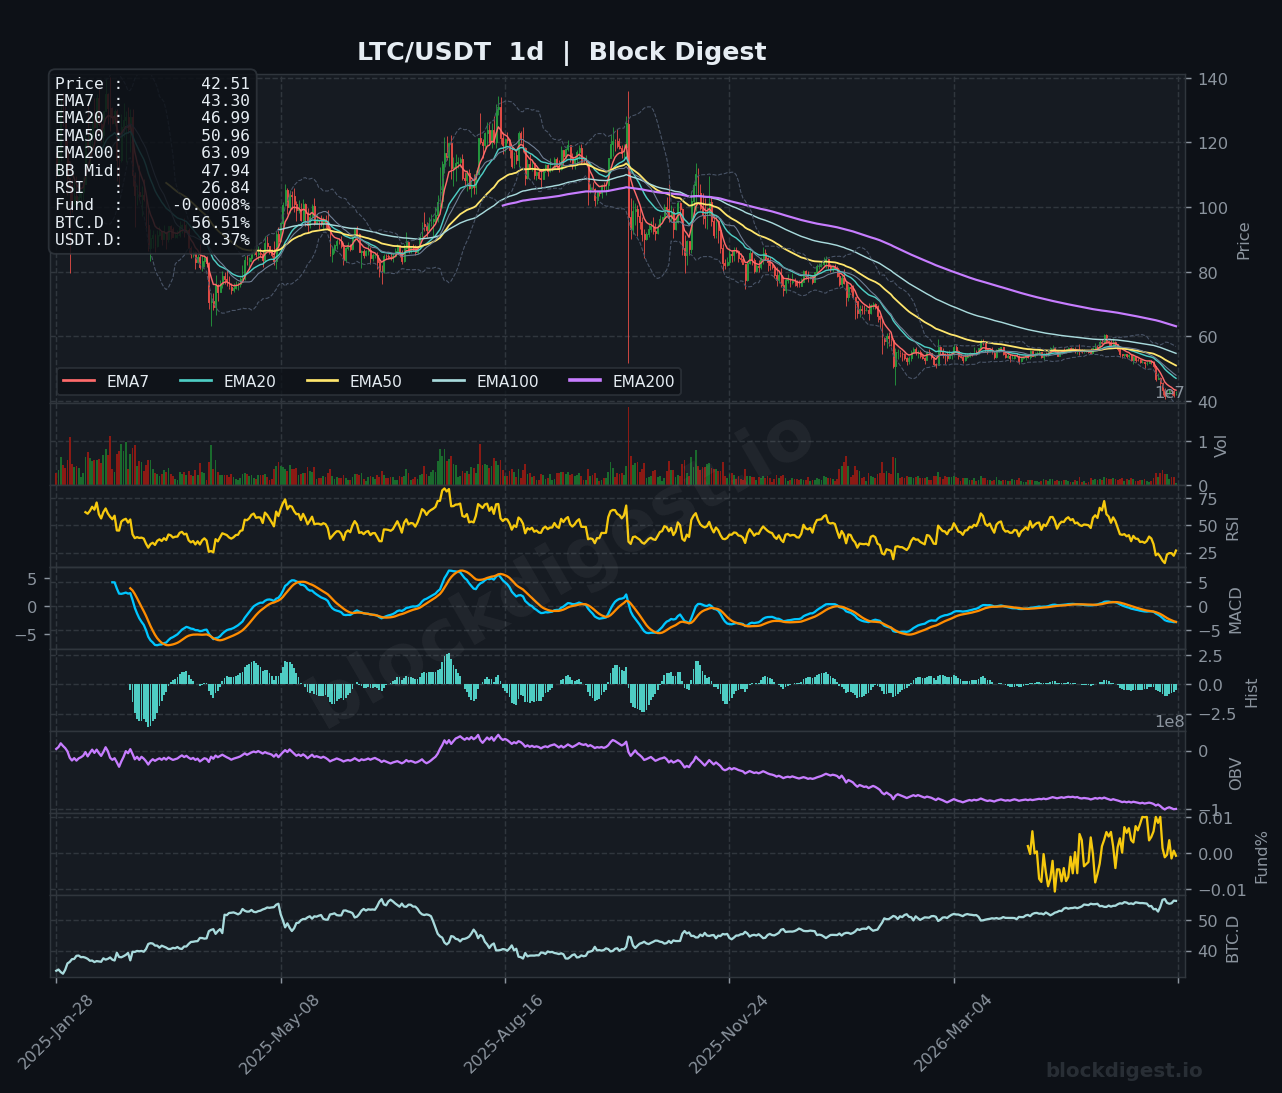
Litecoin (LTC)
LTC is trading at $42.50–$42.51, its weakest level in the analyzed timeframe, with price having shed roughly 30% from the $60 area in a sustained decline. The daily RSI at 26.84 is the most oversold reading among all assets in today’s review, placing LTC in technically extreme territory — though in a bear trend, oversold conditions can persist for extended periods. The 4h MACD recently printed its deepest negative reading before beginning to curl upward, and the histogram is showing growing positive bars suggesting early momentum recovery, but price remains beneath all EMAs including the daily EMA7 at $43.30. Key downside support is the $40.00–$41.00 zone; any recovery attempt will face resistance from the EMA20 at $42.60 on the 4h and the more significant $44.10 EMA50 level.
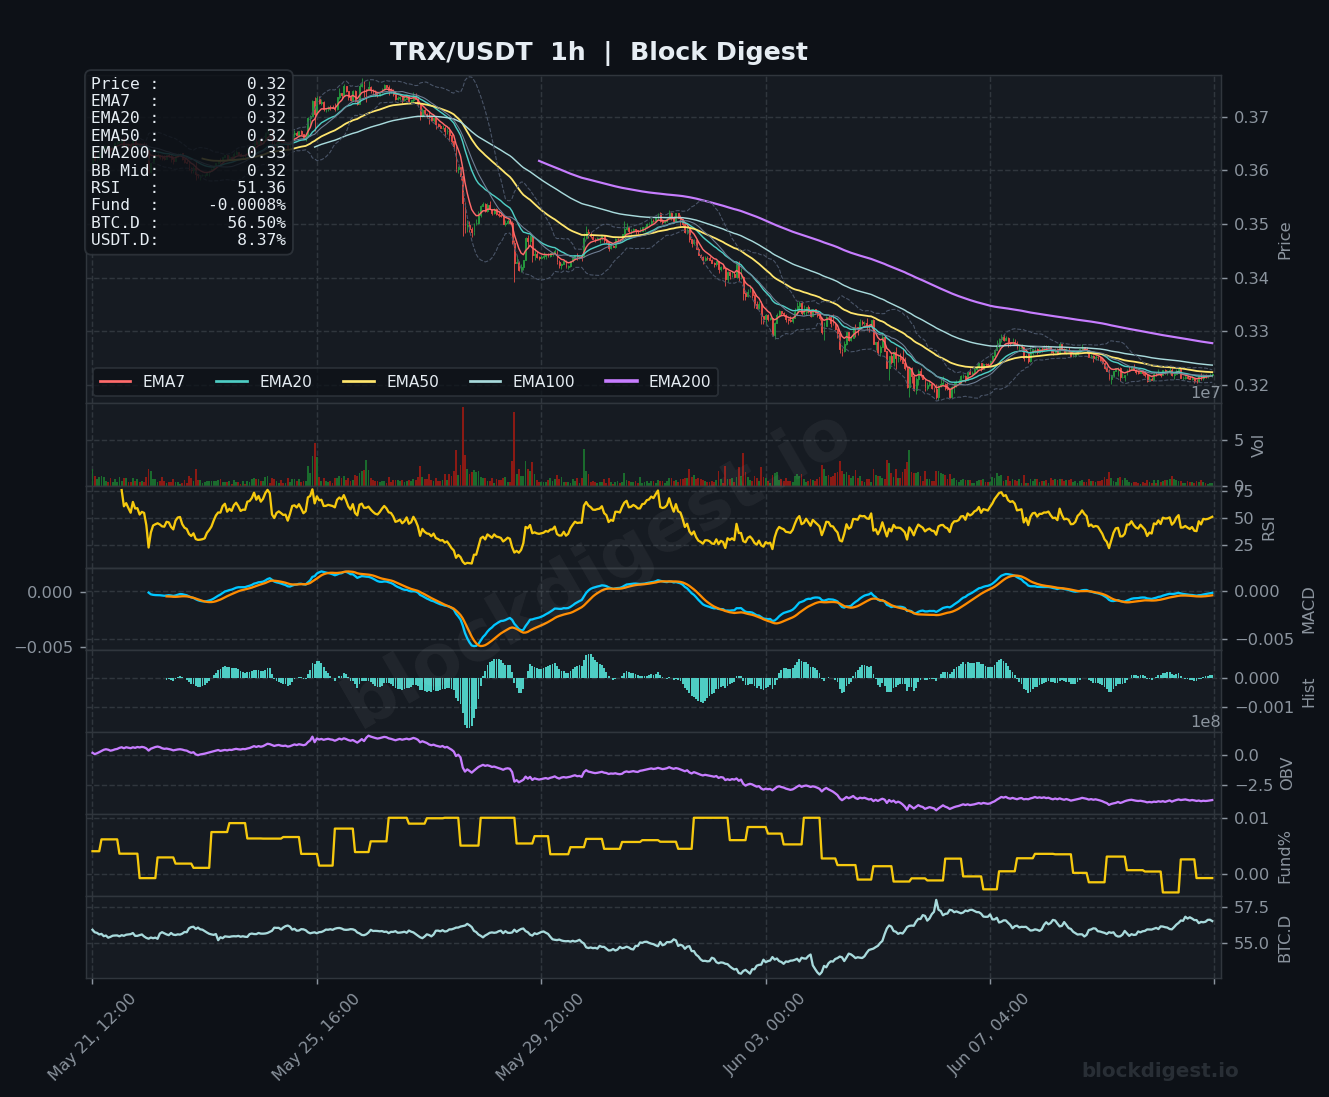
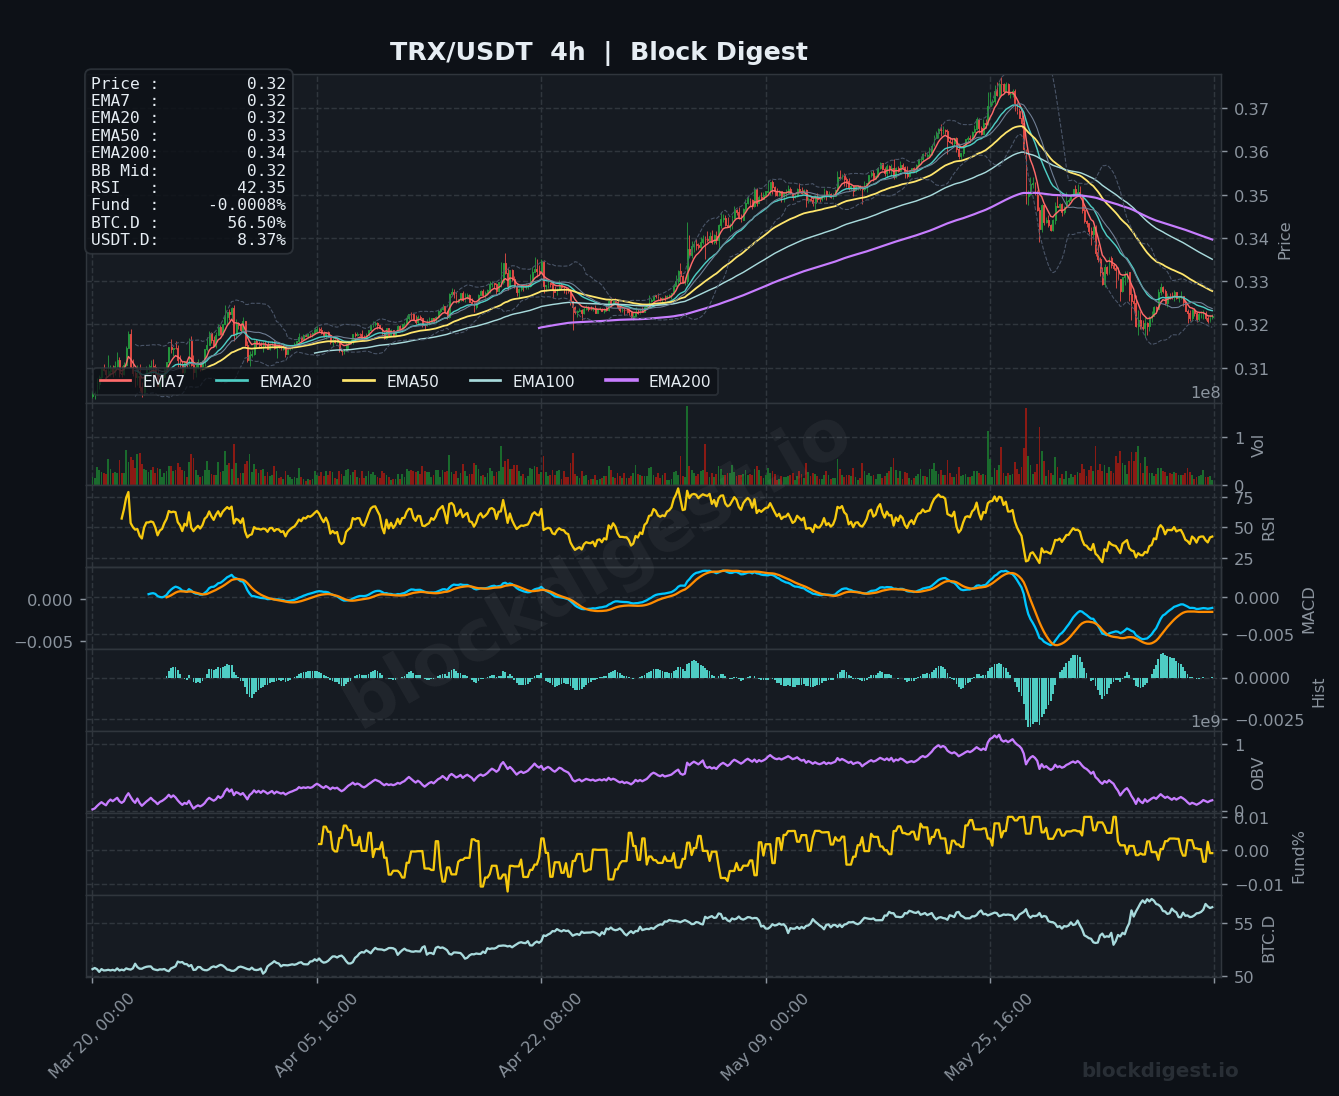
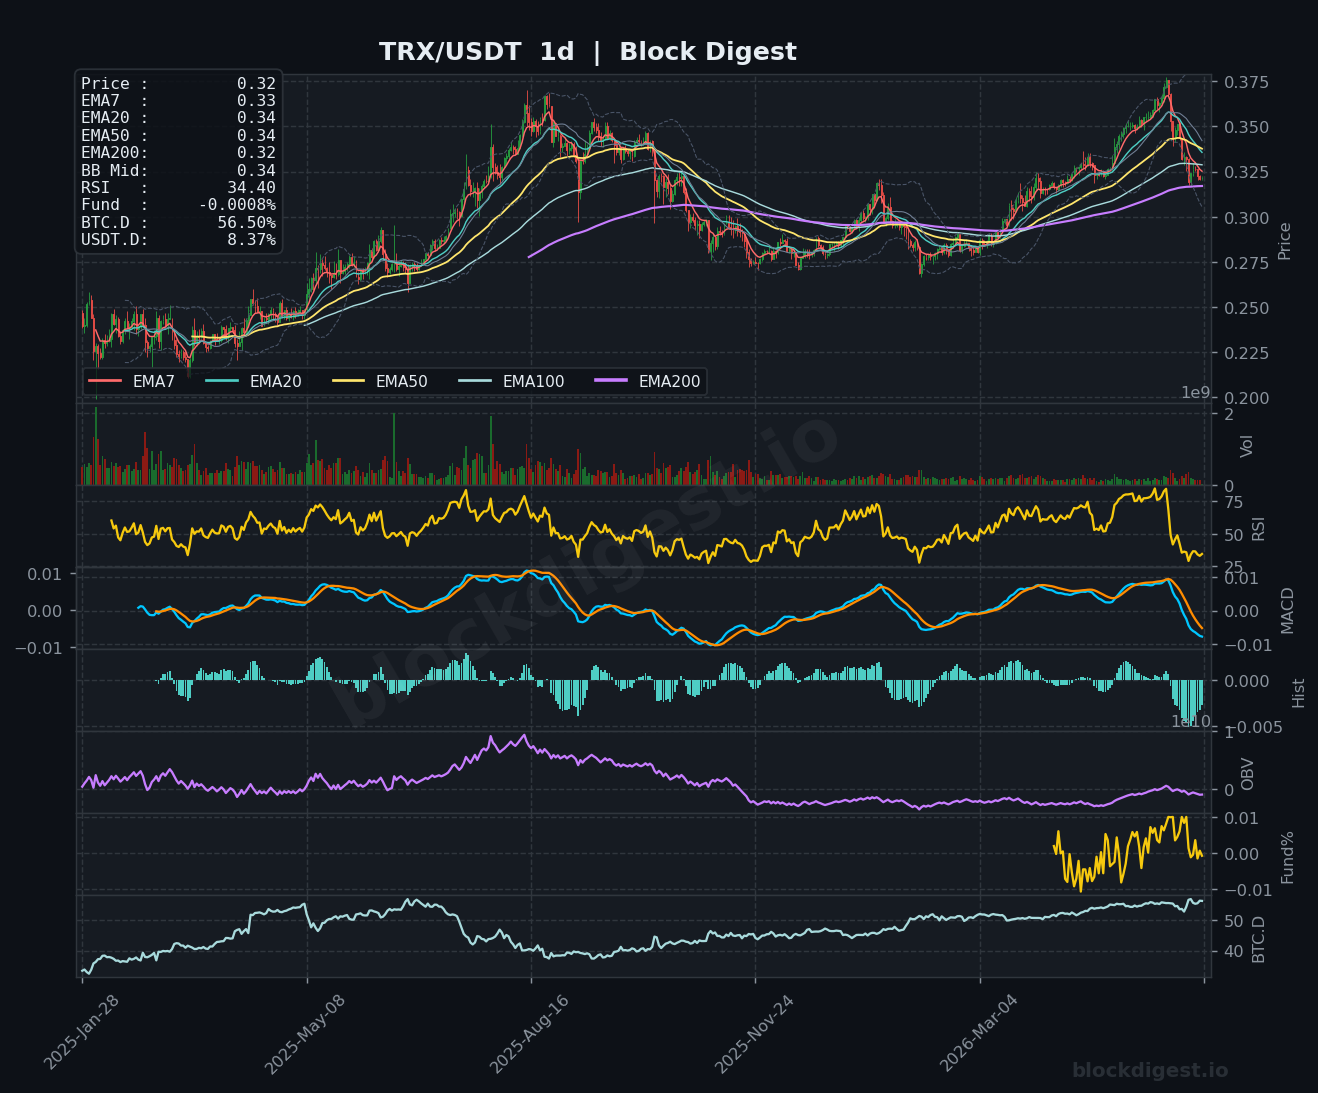
TRON (TRX)
TRX is trading at $0.32, retracing from a notable high near $0.375 and exhibiting relative strength compared to most altcoins in this review, given that TRX had been in an uptrend for much of the prior cycle on the daily chart. The daily RSI at 34.40 reflects recent selling pressure, and the daily MACD has crossed bearish for the first time in several months — a noteworthy development that warrants caution on longer timeframes. The 4h RSI at 42.35 is moderately weak, and the 4h MACD is negative but the histogram is beginning to flatten, suggesting the pace of decline may be slowing. The EMA200 on the daily at $0.32 is providing a notable structural support test right at current prices; holding this level is critical — a breakdown below $0.31 would likely accelerate selling, while a reclaim of $0.33–$0.34 would suggest the correction is finding footing.
Altcoin Outlook
The overall altcoin market structure as of June 11, 2026 is broadly bearish, with all six assets under review trading below their key daily moving averages and daily RSI readings clustering near or in oversold territory — LTC at 26.84, SOL at 29.93, and XRP at 31.43 being the most extreme. BNB stands out as the relative near-term outperformer given its 1h RSI strength and proximity to the $600 support floor, while LTC and SOL exhibit the weakest setups on both momentum and structure across timeframes. The primary conditions to watch are a potential BTC dominance rollover from the 56.5% zone and any sustained contraction in USDT.D below 8%, which would signal the early stages of renewed risk appetite flowing back into alts. Until those macro-level shifts materialize, bounce attempts in individual names should be treated as counter-trend opportunities within a still-dominant downtrend.
Disclaimer: This analysis is for informational purposes only and does not constitute financial advice. Cryptocurrency markets are highly volatile and unpredictable. All trading decisions should be made based on your own research and risk tolerance. Block Digest is not responsible for any financial losses incurred as a result of acting on this content.