Altcoin Daily Analysis — April 29, 2026
Altcoin Daily Roundup – April 29, 2026
Market Context
The altcoin market remains under pressure as Bitcoin dominance holds at 54.02%, limiting capital rotation into alternative cryptocurrencies. USDT dominance at 7.13% suggests cautious market positioning, with investors maintaining elevated stablecoin exposure amid uncertain conditions. The broader altcoin complex continues trading in consolidation patterns, with most major tokens struggling to establish decisive directional momentum against persistent bearish technical alignments.
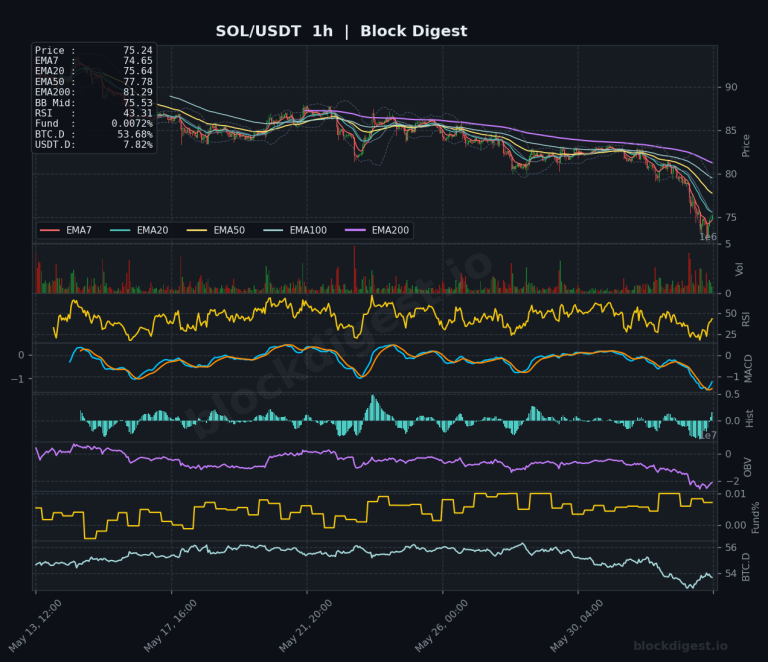
Solana (SOL)
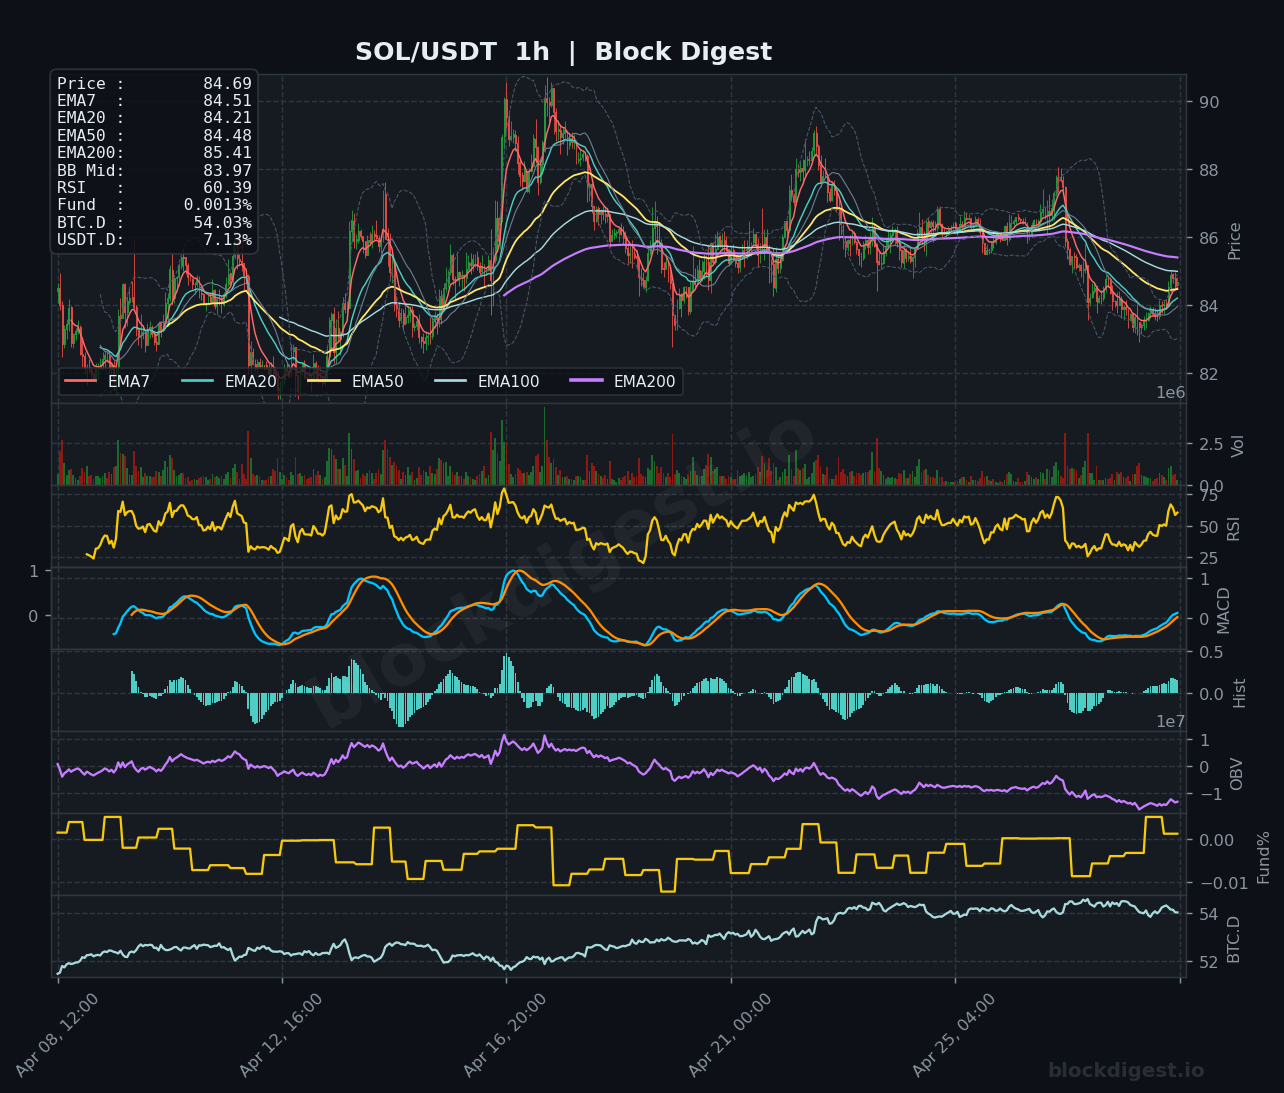
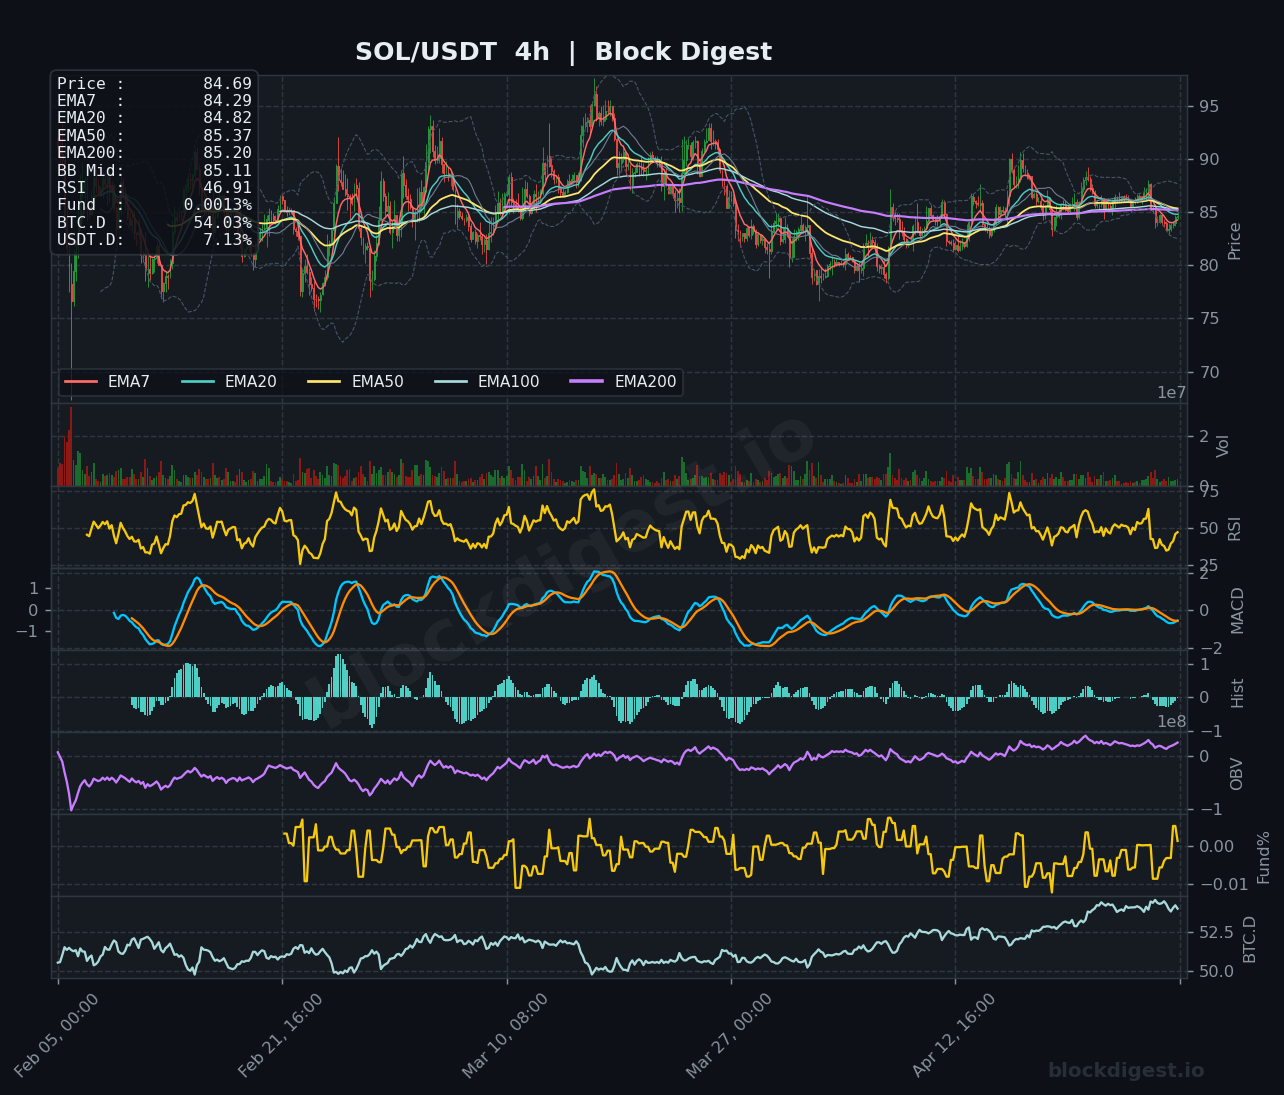
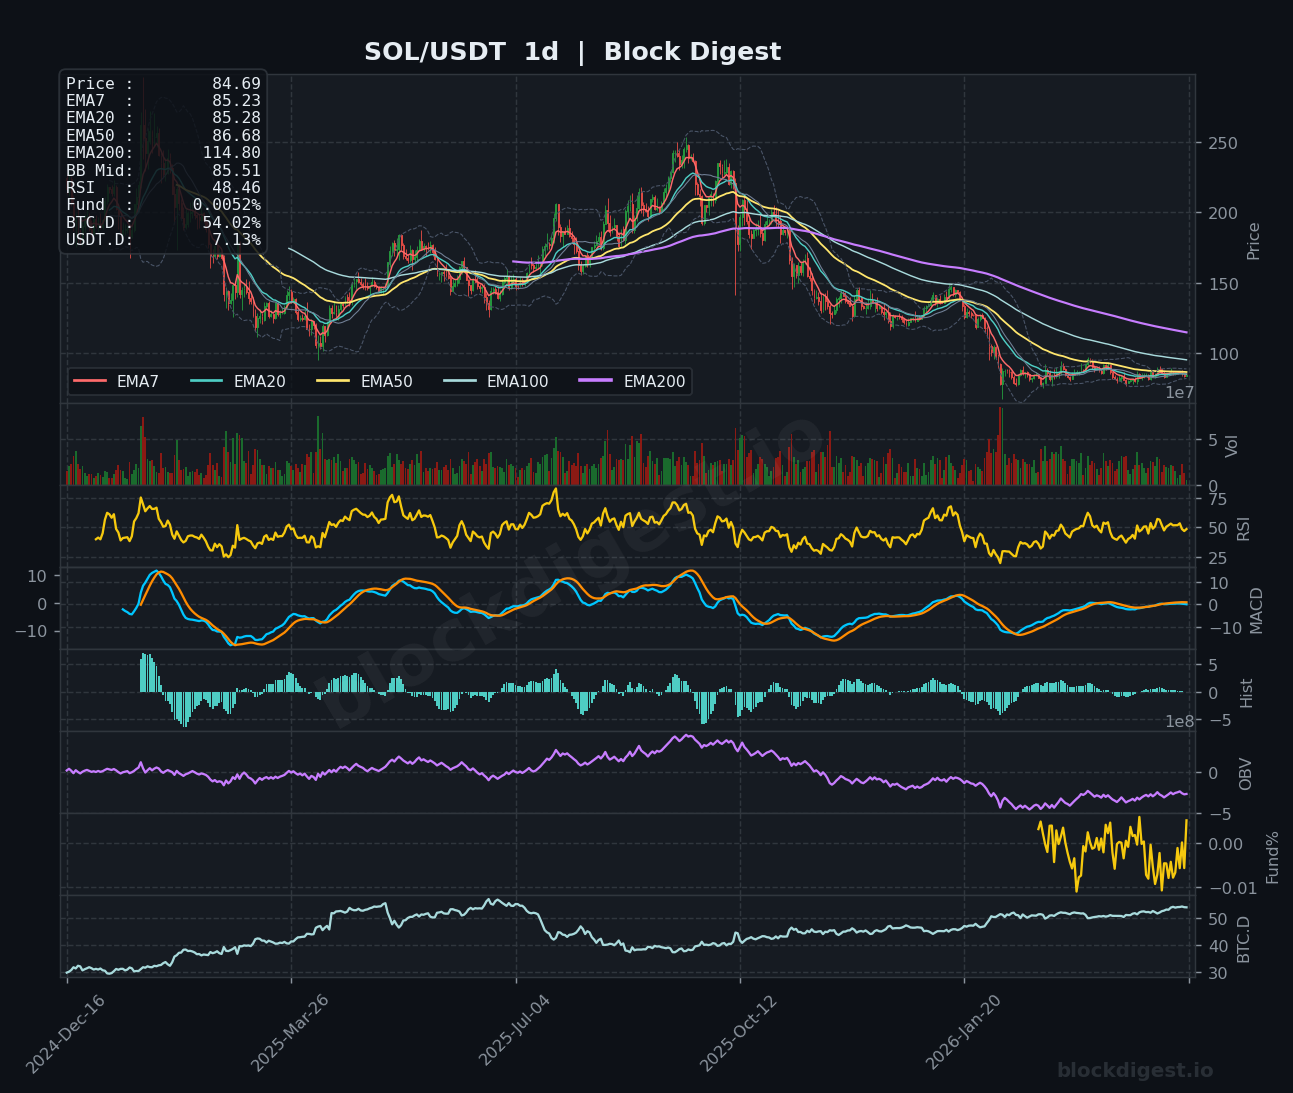
Solana trades at $84.69, trapped beneath its key moving averages and showing technical deterioration across multiple timeframes. The 1-hour chart reveals price trading below the EMA20 ($84.82) with RSI at 60.39, indicating weakening momentum despite recent stabilization attempts. On the 4-hour timeframe, SOL has broken below its EMA50 ($85.37) with RSI at 46.91, confirming bearish momentum structure. The daily chart paints an even grimmer picture, with price deeply below the EMA200 ($114.80) and RSI languishing at 48.46, while MACD remains in negative territory. Immediate resistance clusters around $85.20-$85.40, while support lies near $83.50.
XRP (XRP)
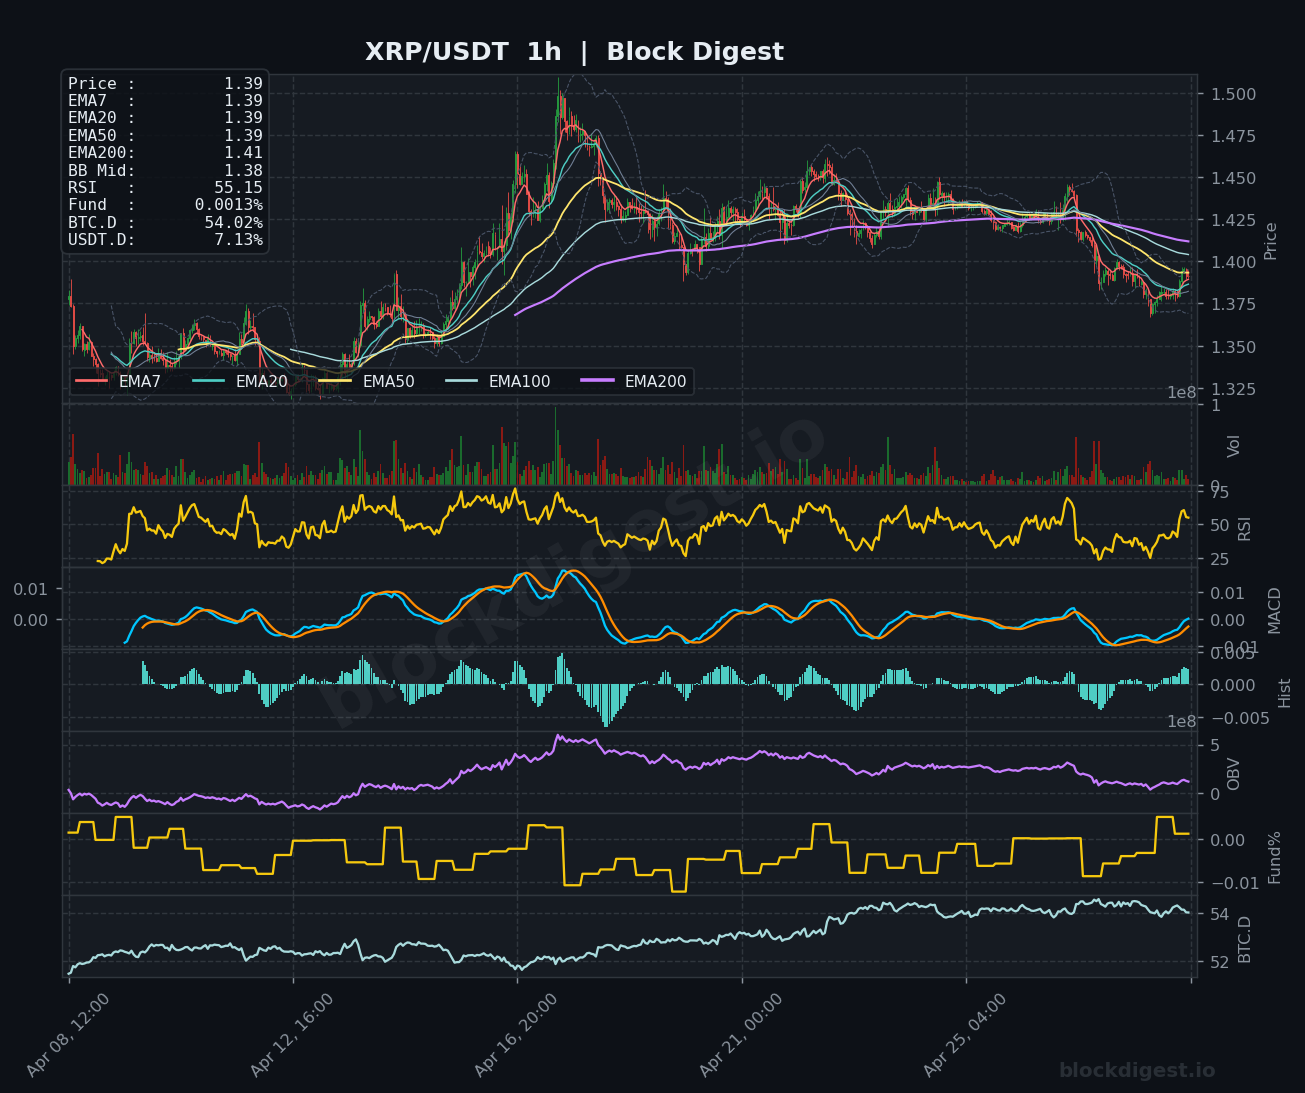
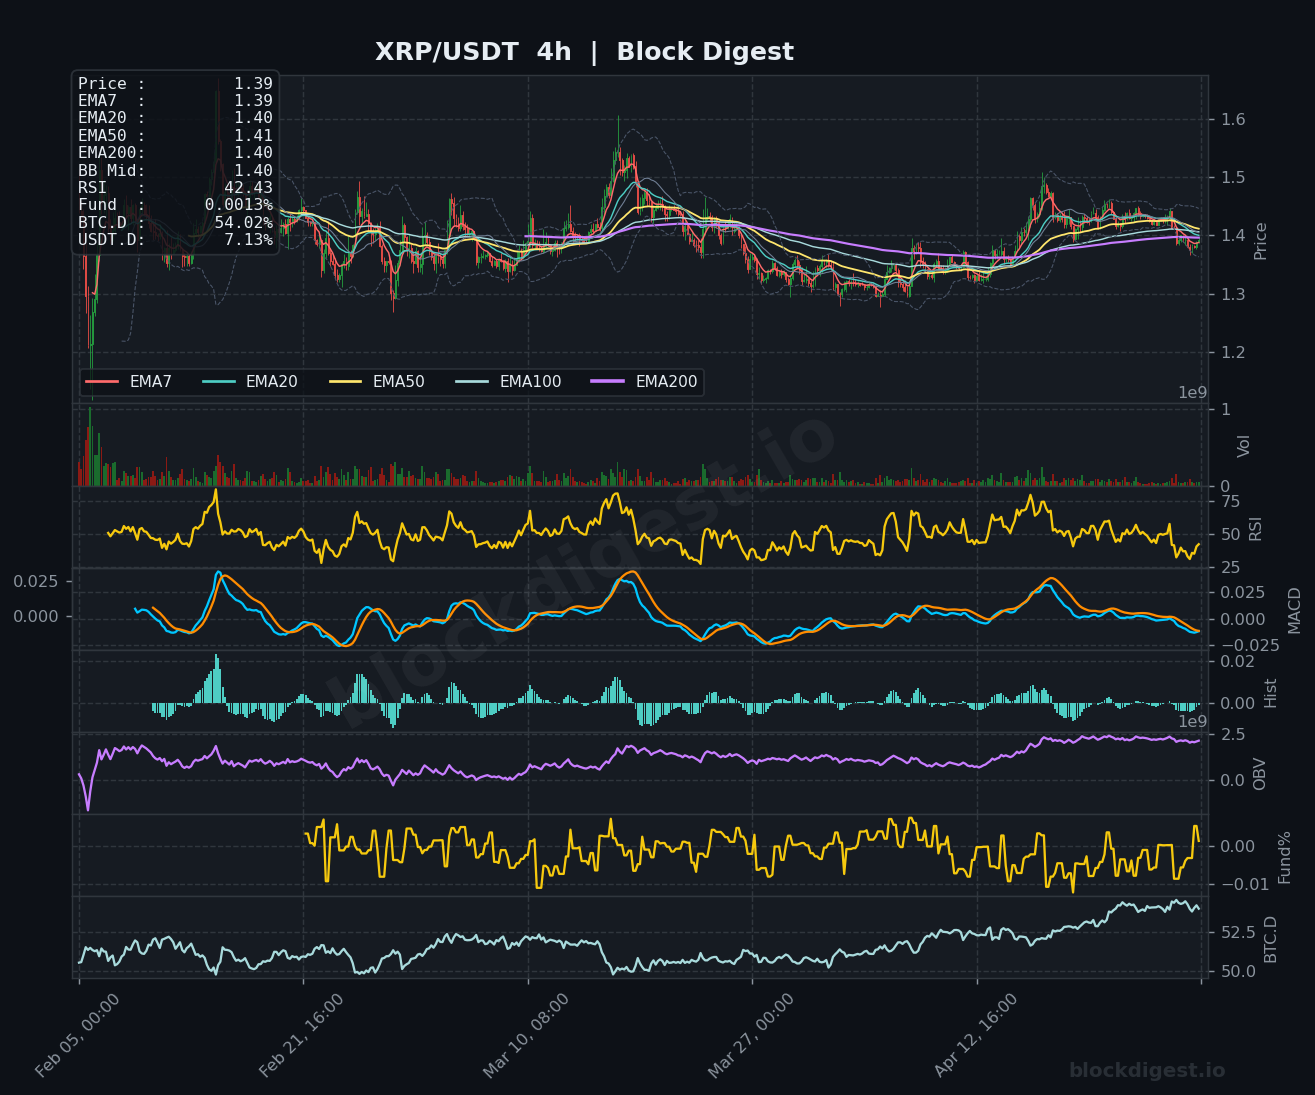
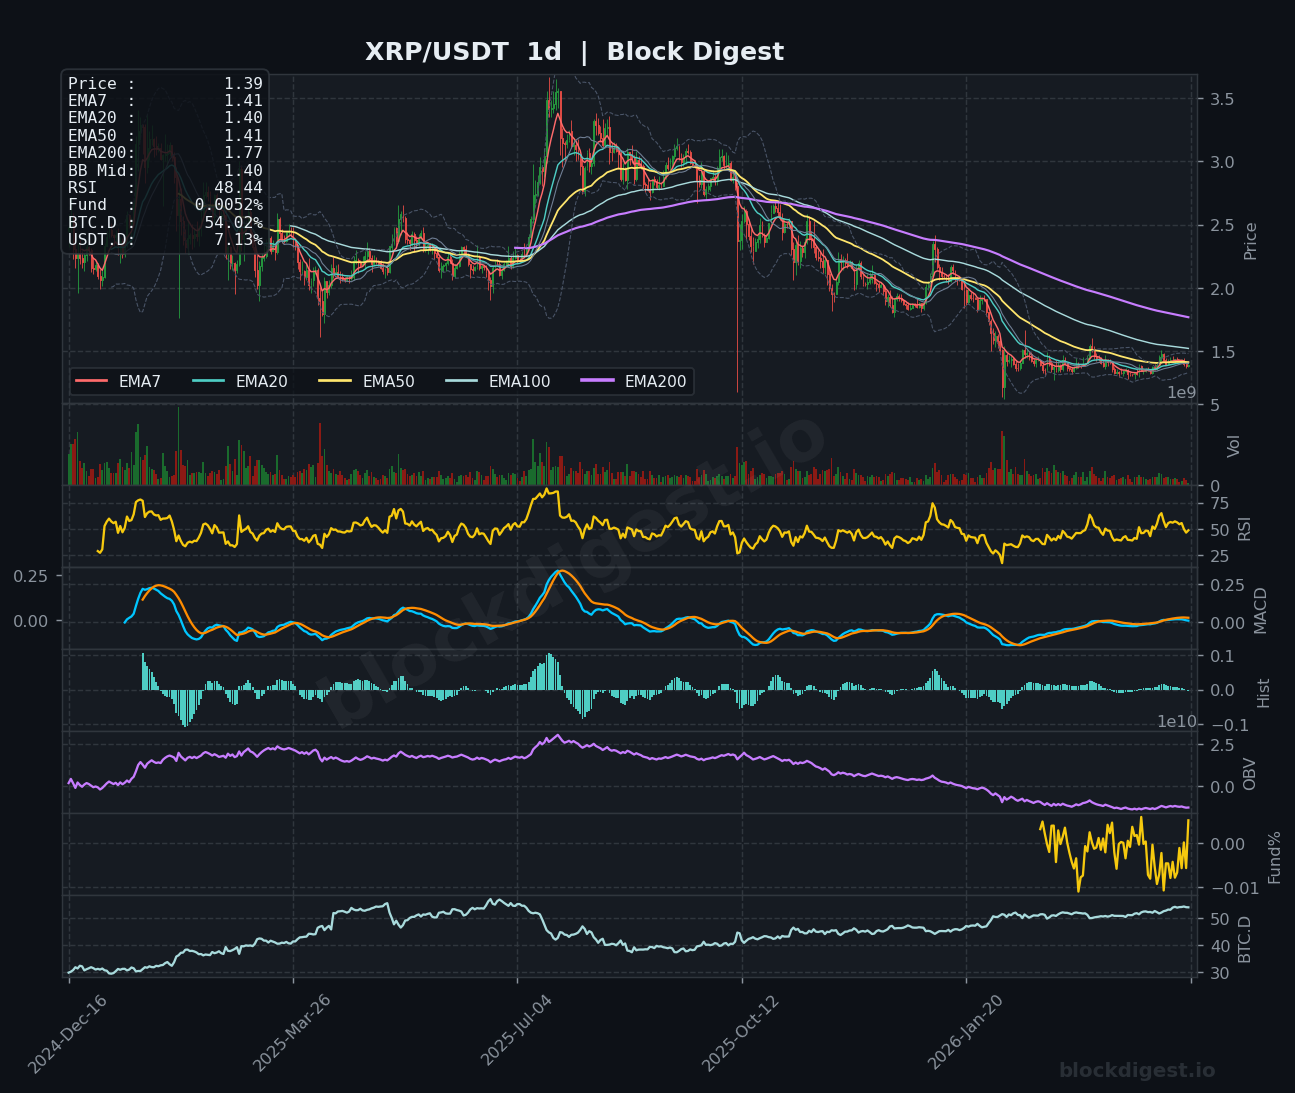
XRP holds at $1.39, demonstrating relative stability with price consolidating around its moving average cluster. The 1-hour chart shows balanced conditions with RSI at 55.15 and price aligned with the EMA convergence zone near $1.39-$1.40. The 4-hour timeframe reveals XRP trading slightly below the EMA50 ($1.41) with RSI at 42.43, suggesting mild bearish pressure. However, the daily perspective remains concerning, with price well below the EMA200 ($1.77) and RSI at 48.44, indicating the broader downtrend remains intact. The MACD histogram shows minimal momentum in either direction. Key resistance sits at $1.41-$1.42, while support holds at $1.37-$1.38.
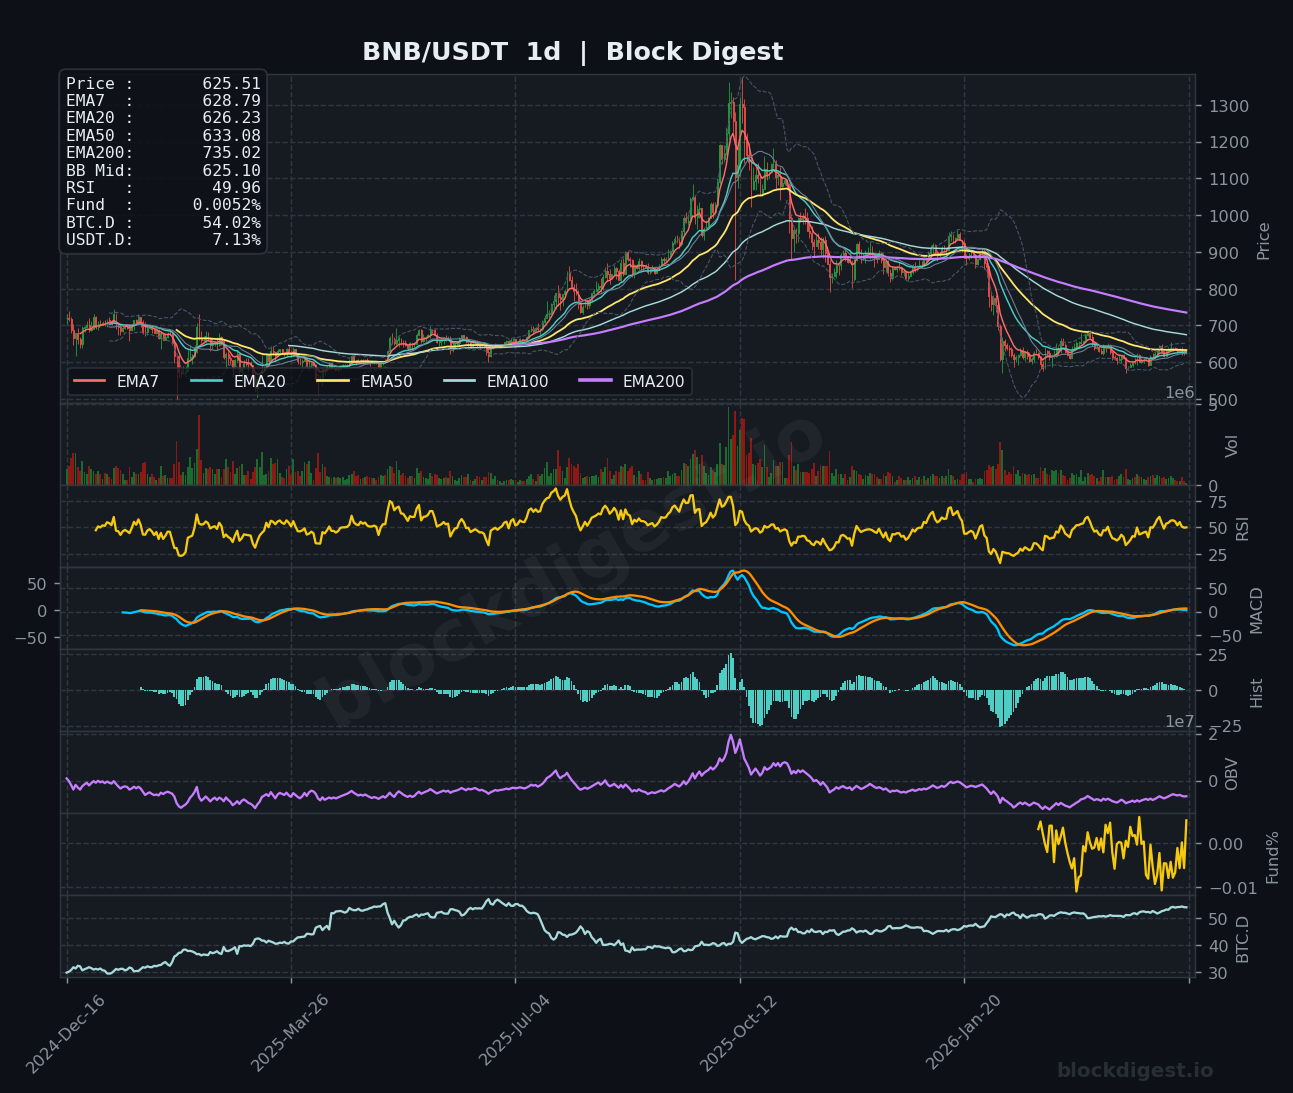
BNB (BNB)
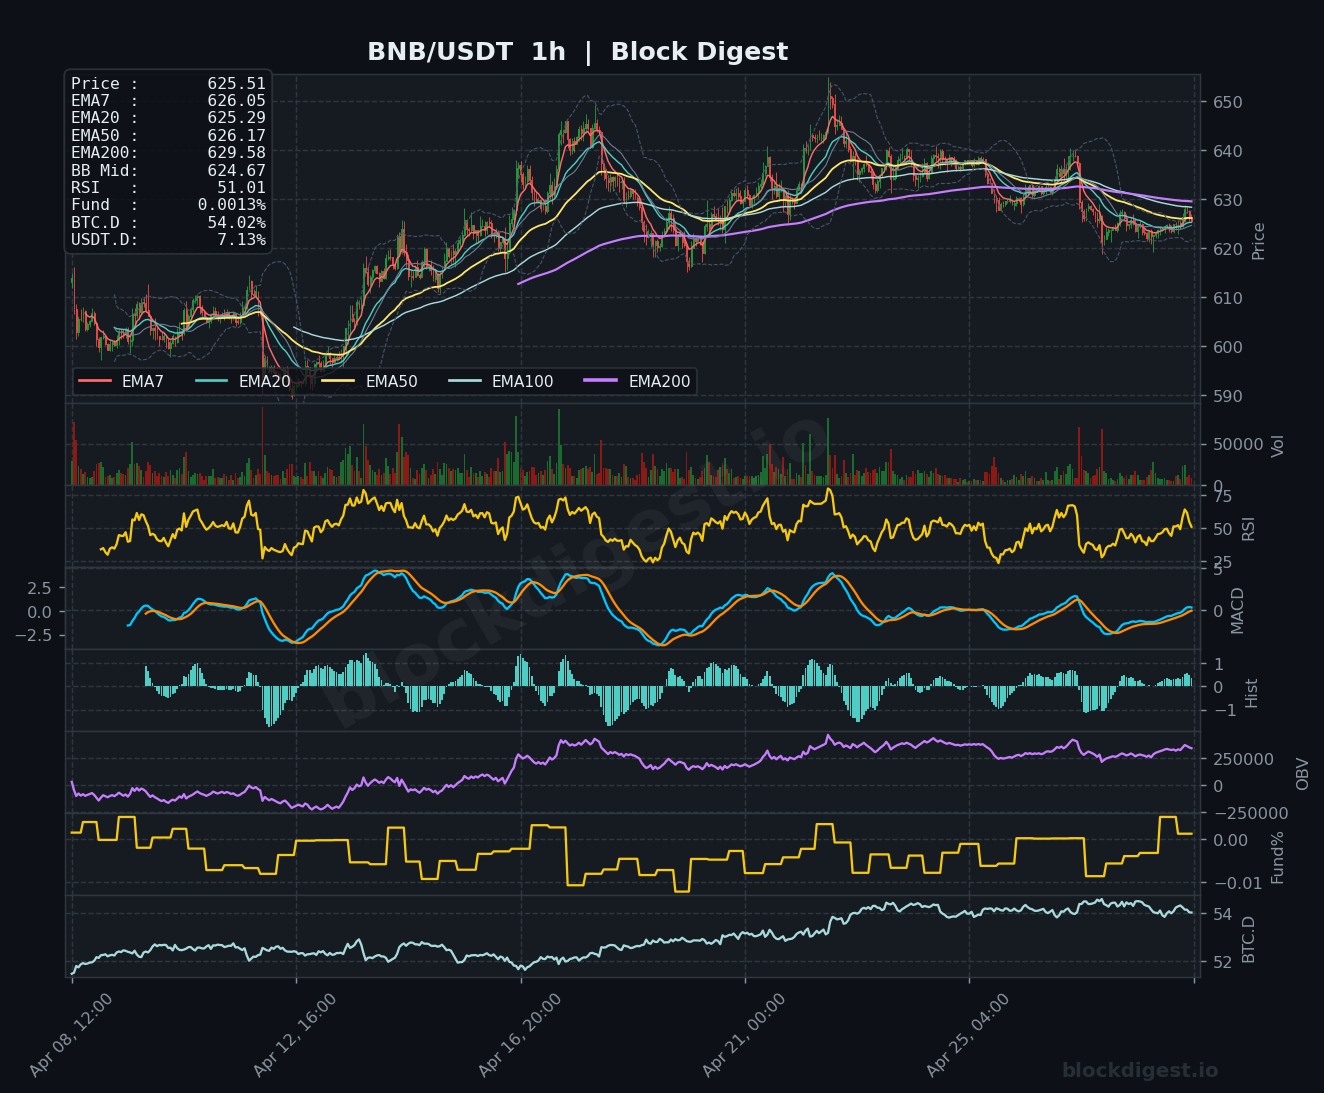
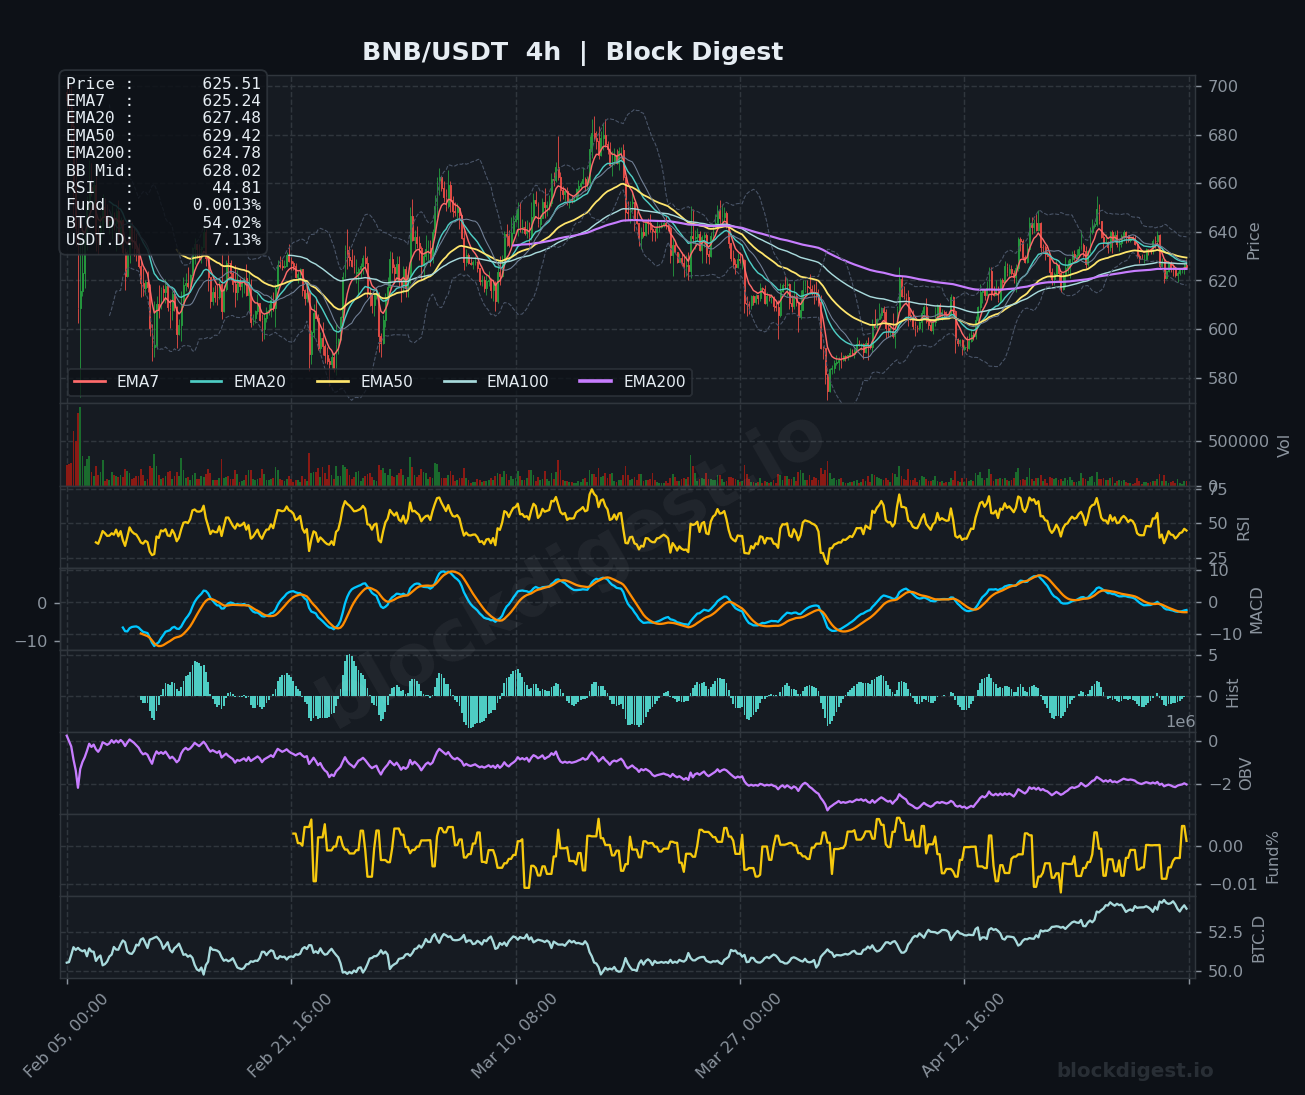
BNB trades at $625.51, experiencing continued weakness as it tests critical support levels across all timeframes. The 1-hour chart shows price converging with the EMA cluster around $625-$626 with RSI at 51.01, suggesting indecision at current levels. The 4-hour view reveals BNB struggling below the EMA50 ($629.42) with RSI declining to 44.81, confirming building downside pressure. The daily chart remains structurally bearish, with price significantly below the EMA200 ($735.02) and RSI at 49.96, while the MACD continues trending lower. Immediate support lies at $620-$622, with resistance at $630-$633. A breakdown below $620 could accelerate losses toward the $600 psychological level.
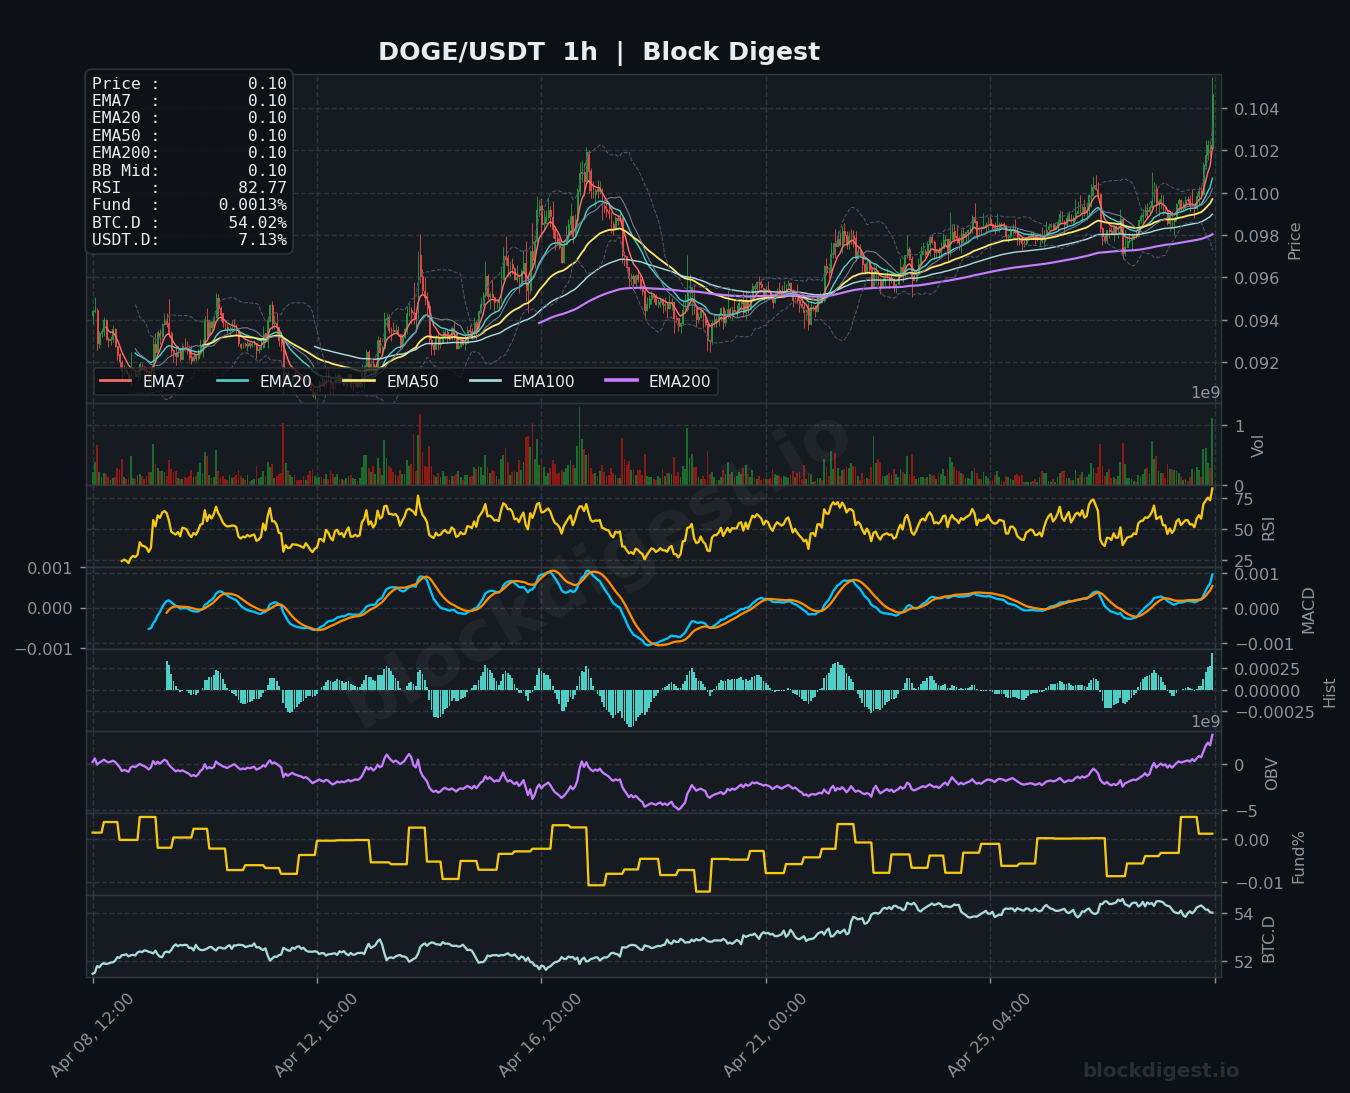
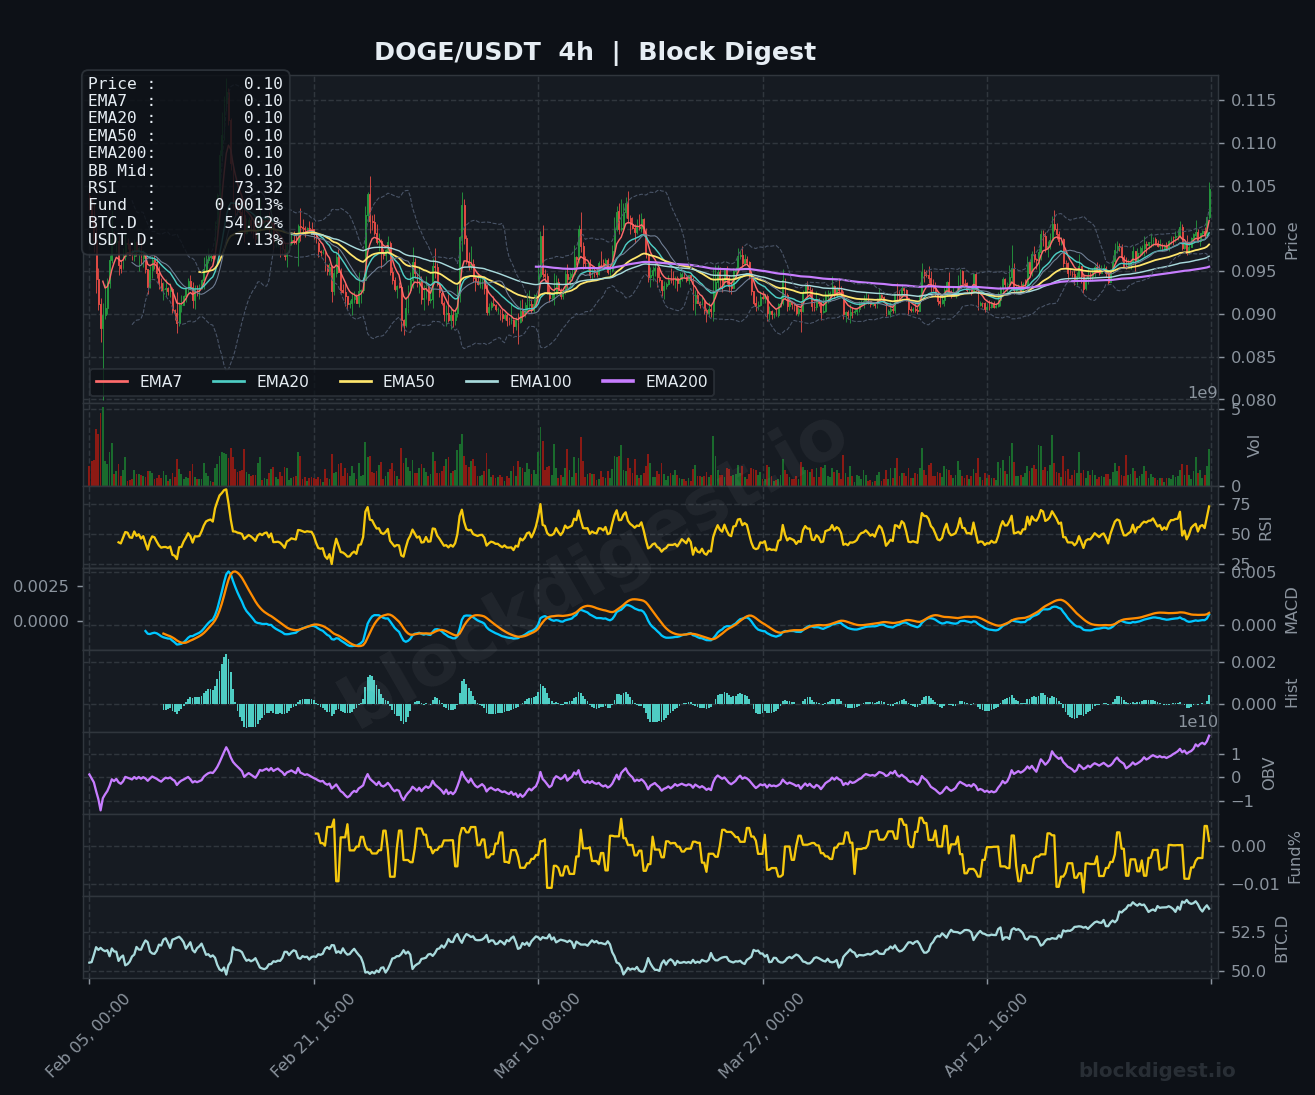
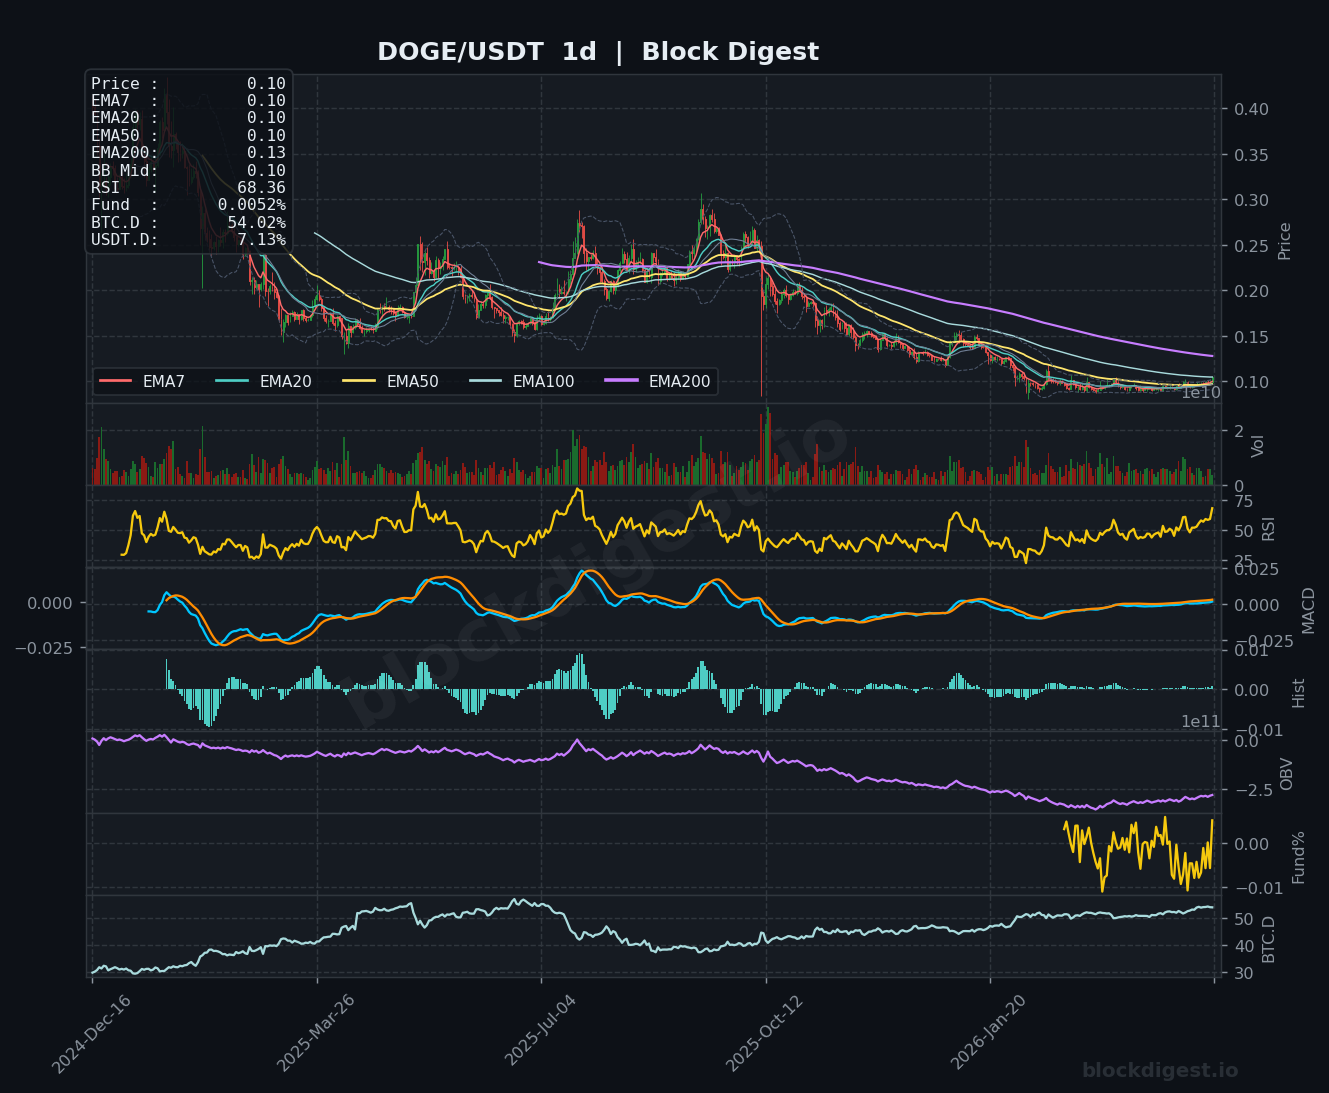
Dogecoin (DOGE)
Dogecoin shows surprising strength, currently trading at $0.1000 with signs of bullish momentum building across shorter timeframes. The 1-hour chart displays aggressive upside action with RSI surging to 82.77, entering overbought territory as price pushes above all major EMAs. The 4-hour perspective shows DOGE at $0.1000 with RSI at 73.32, maintaining bullish momentum above the rising EMA structure. The daily chart reveals RSI at 68.36 with MACD showing positive crossover potential, though price remains below the EMA200 ($0.13). This represents one of the strongest technical setups among major altcoins. Resistance appears at $0.1020-$0.1040, while support has established at $0.0980-$0.0990.
Litecoin (LTC)
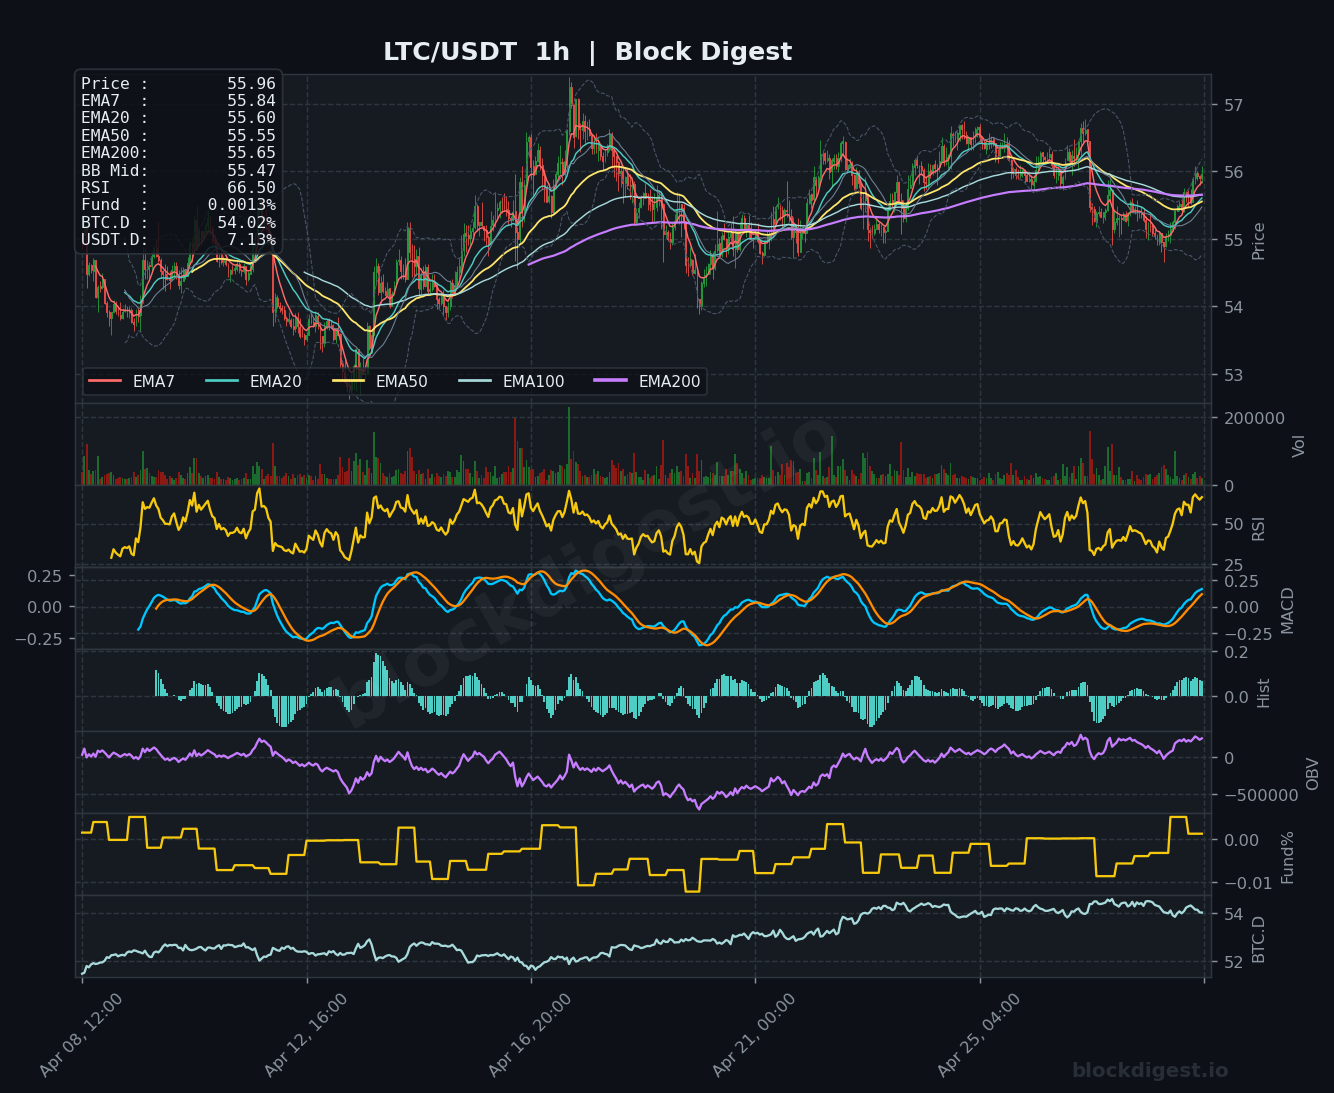
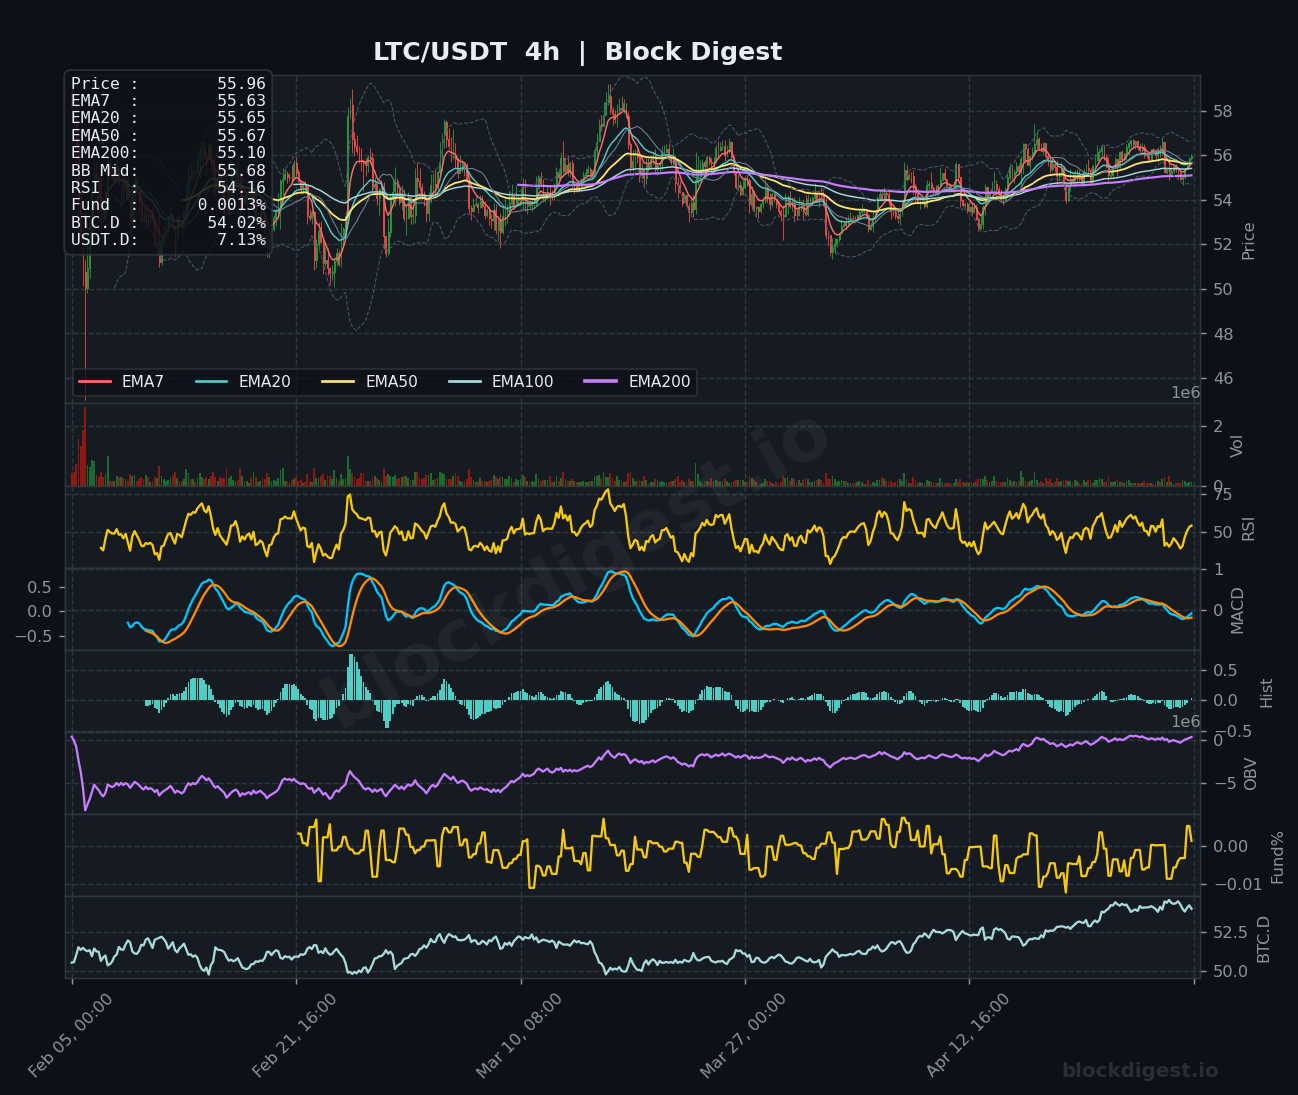
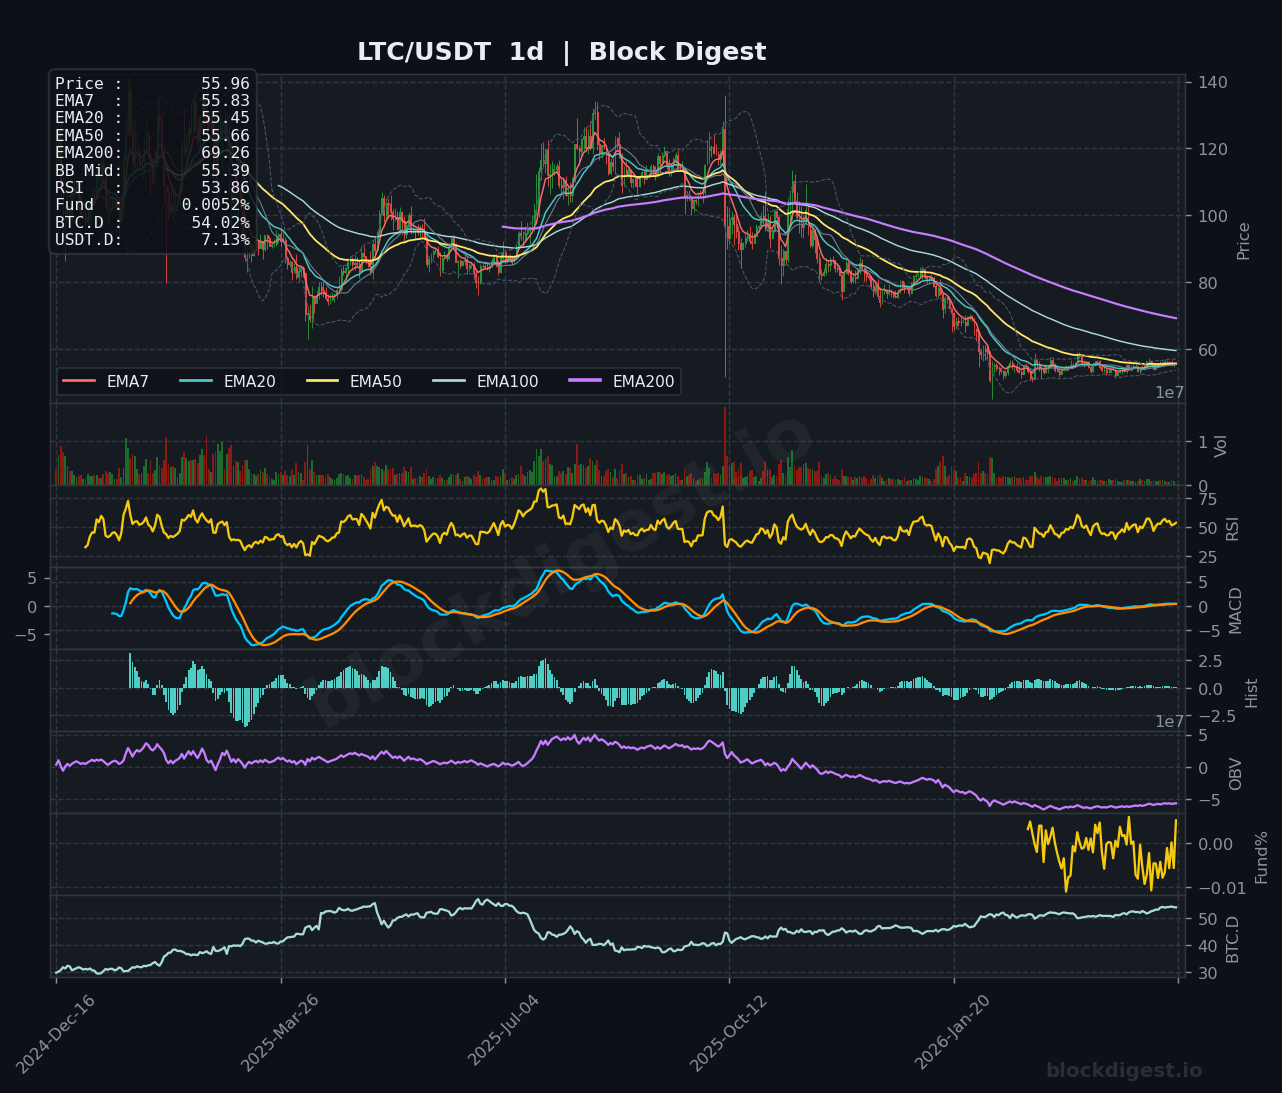
Litecoin trades at $55.96, displaying choppy sideways price action with neutral momentum indicators across all timeframes. The 1-hour chart shows price oscillating around the EMA cluster near $55.60-$55.85 with RSI at 66.50, suggesting mild bullish bias on shorter intervals. The 4-hour view presents a balanced picture with LTC at the EMA convergence zone and RSI at 54.16, reflecting market indecision. The daily timeframe remains weak structurally, with price below the EMA200 ($69.26) and RSI at 53.86, though MACD shows stabilization near neutral levels. LTC appears range-bound between $55.00 support and $57.00 resistance, requiring a decisive break to establish trend.
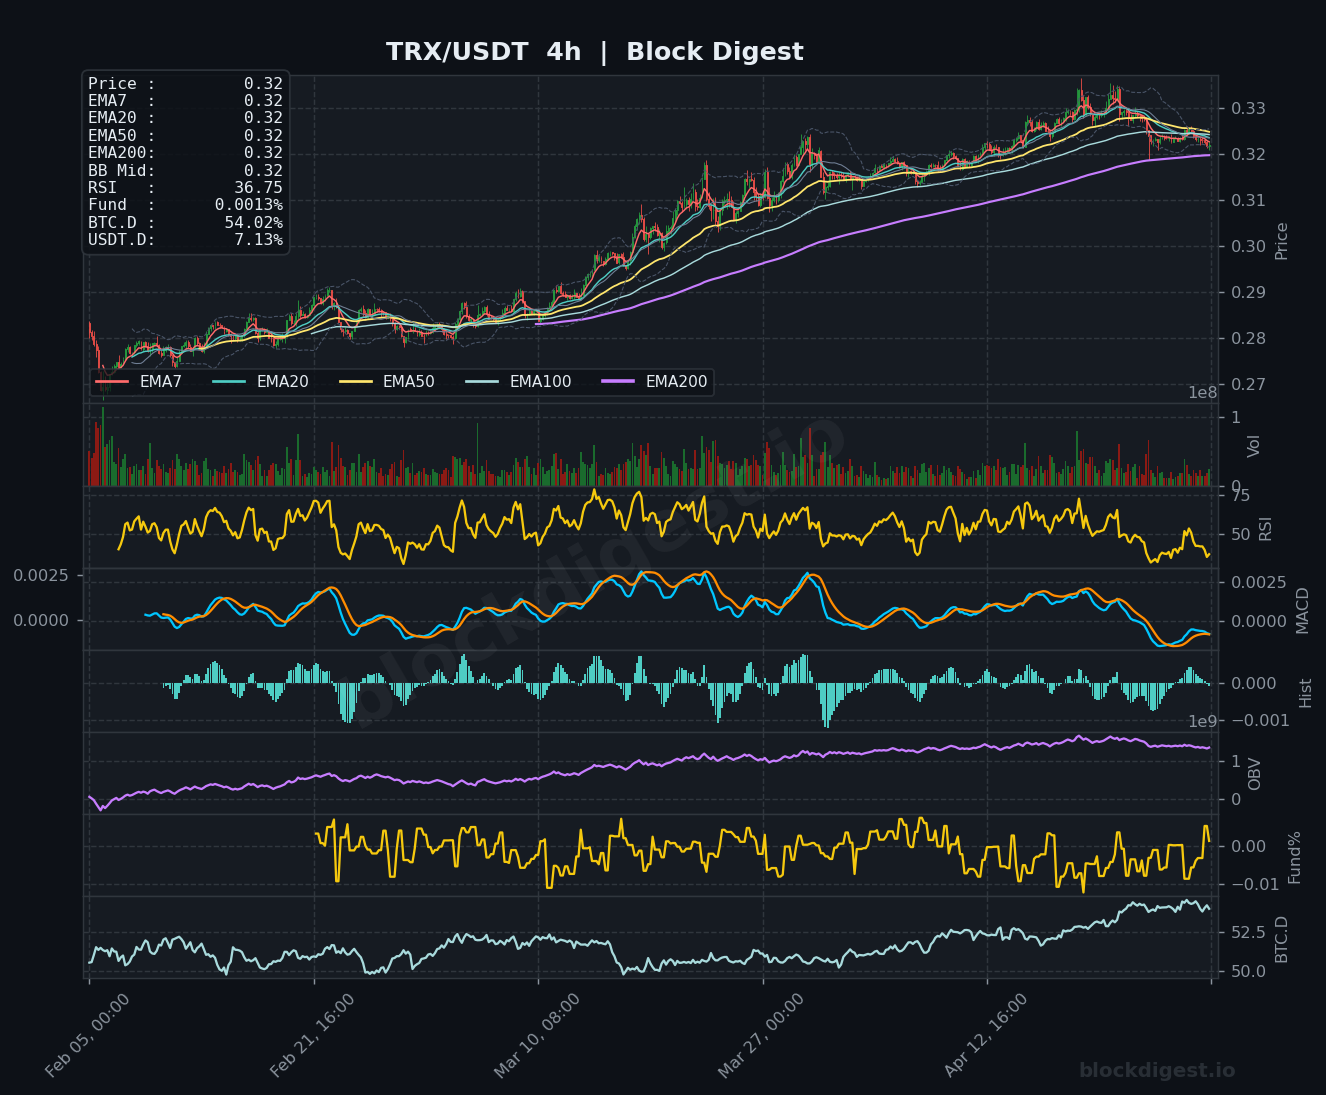
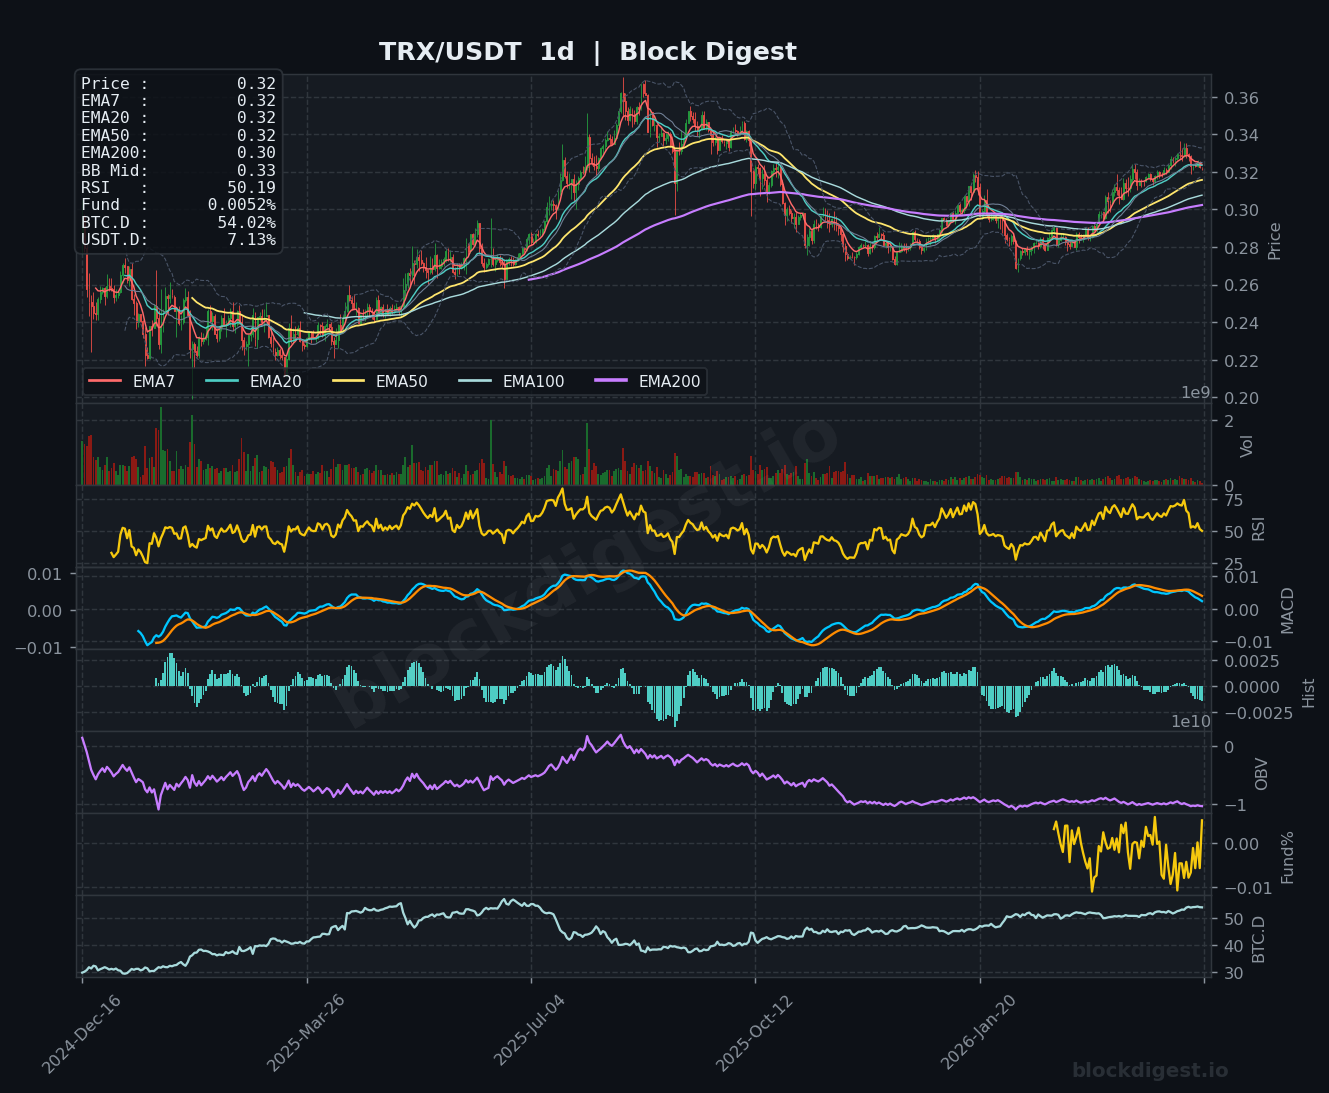
TRON (TRX)
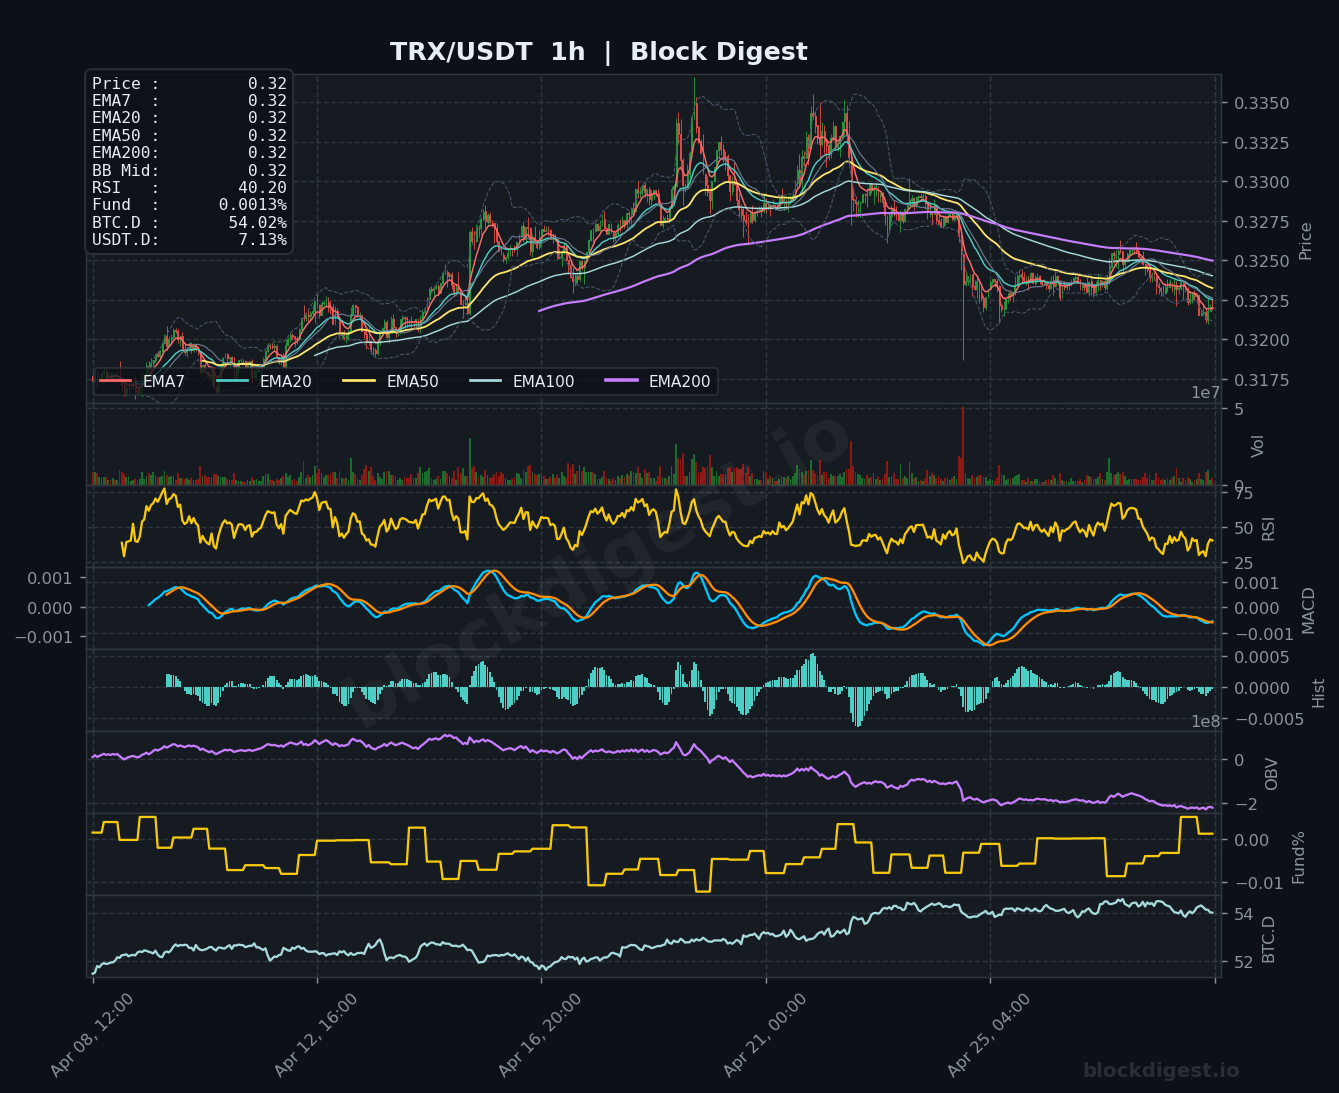
TRON trades at $0.32, exhibiting concerning weakness as it breaks down from recent consolidation patterns. The 1-hour chart shows TRX sliding below the EMA structure with RSI declining to 40.20, confirming bearish momentum acceleration. The 4-hour perspective reveals price breaking beneath critical support with RSI at 36.75, entering oversold territory and suggesting potential capitulation. The daily chart displays TRX below the EMA50 ($0.32) with RSI at 50.19 and MACD trending negative. The technical breakdown is particularly notable given TRX’s previous relative strength. Immediate support emerges at $0.3150-$0.3180, with resistance at $0.3250-$0.3280.
Altcoin Outlook
The altcoin landscape remains fragmented, with DOGE emerging as the clear technical leader displaying genuine breakout momentum, while SOL, TRX, and BNB show concerning weakness with bearish alignments across multiple timeframes. XRP and LTC maintain neutral consolidation patterns, awaiting directional catalysts. The elevated Bitcoin dominance at 54% continues suppressing broad-based altcoin rallies, while USDT dominance above 7% reflects persistent risk-off positioning. Traders should monitor whether DOGE’s strength can trigger broader meme coin sector rotation, and whether BNB’s critical support around $620 holds or breaks to signal deeper corrections across the altcoin complex.
Disclaimer: This analysis is for informational purposes only and does not constitute financial advice. Cryptocurrency markets are highly volatile and unpredictable. All trading decisions should be made based on your own research and risk tolerance. Block Digest is not responsible for any financial losses incurred as a result of acting on this content.
Charts