Weekly Market Overview
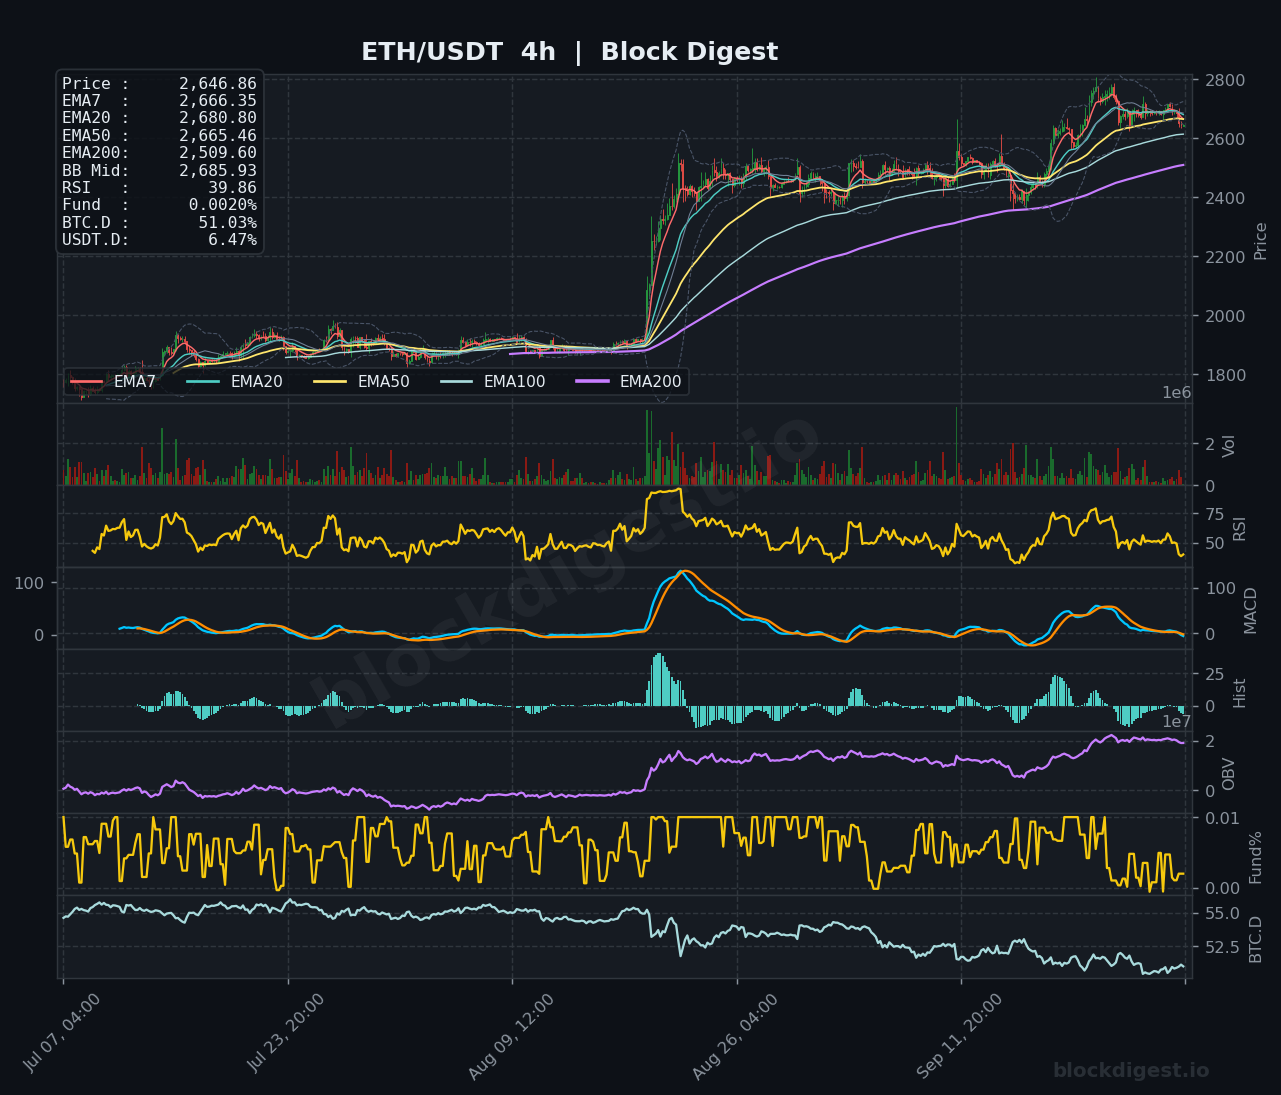
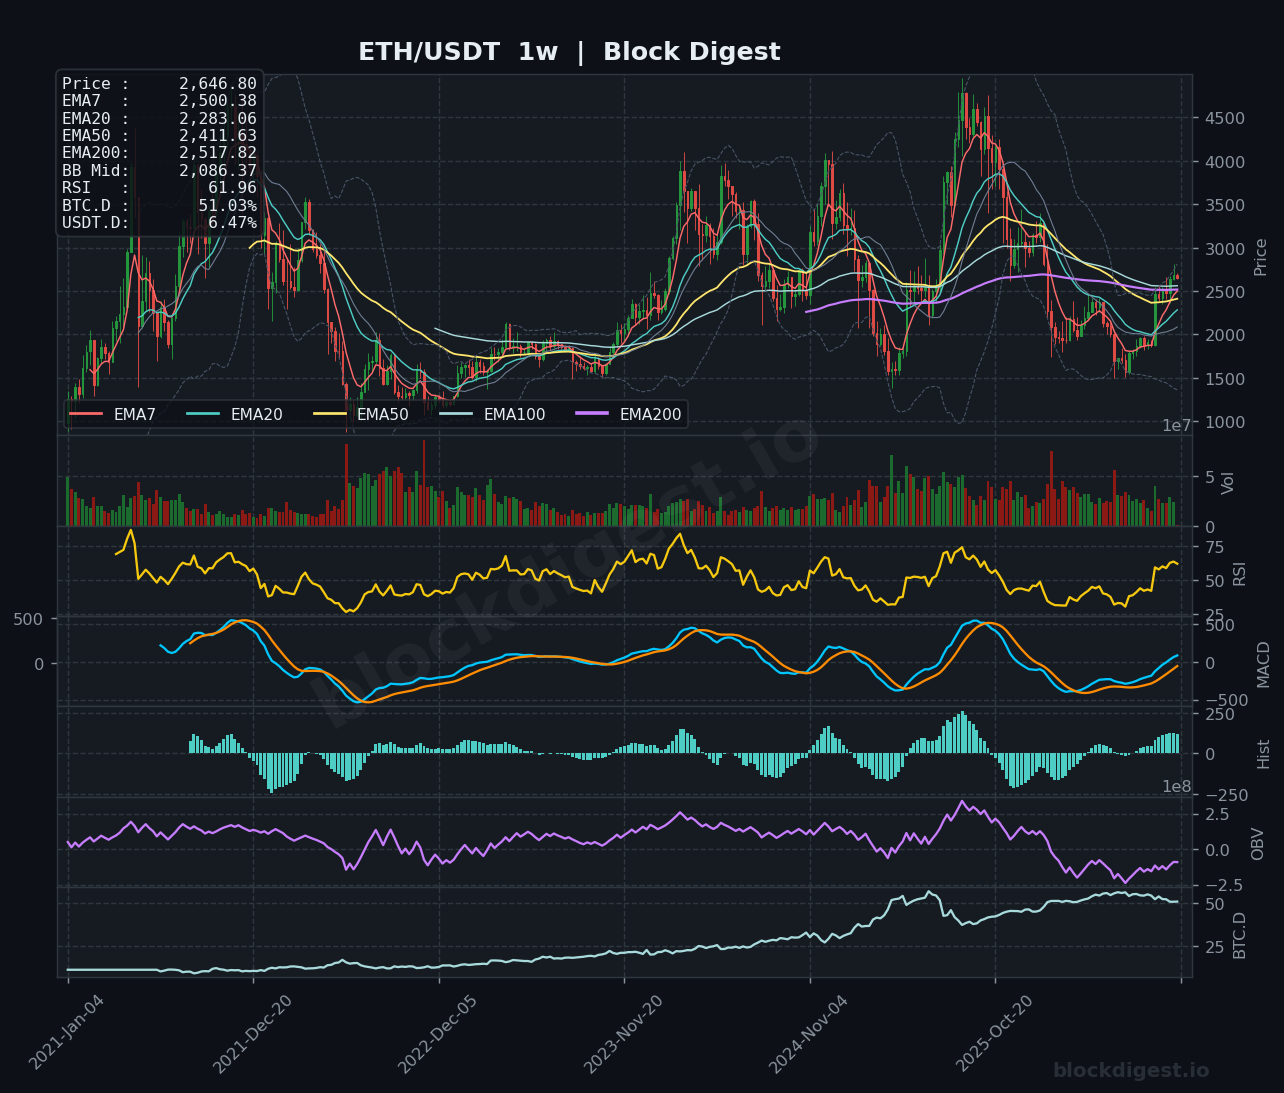
Ethereum is consolidating near multi-month highs, trading at 2646.86 after a powerful breakout from the 2000–2200 base. The weekly candle shows tight consolidation and slight upper-range compression beneath macro resistance, marking a pause after a period of aggressive expansion. The trend has shifted decisively bullish on the weekly timeframe, with the asset reclaiming all major moving averages. Market sentiment remains supportive, with the BD Pulse registering 68.8/100 for the period ending September 28, 2026.
Higher Timeframe Structure
The weekly EMA alignment confirms a structural breakout, with price holding firmly above both the 100-week (2561.30) and 200-week (2517.82) moving averages. Ethereum is positioned comfortably in the upper half of the Bollinger Band envelope, well above the midline of 2086.37. The 2500–2560 region has solidified as the primary macro support zone, while the 2800–3000 psychological zone now acts as the next major overhead supply barrier.
Multi-Timeframe Confluence
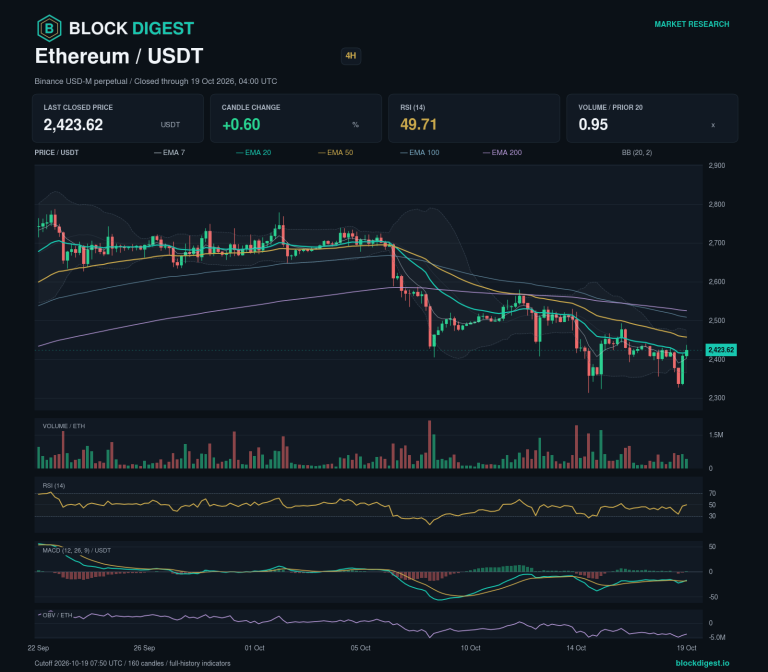
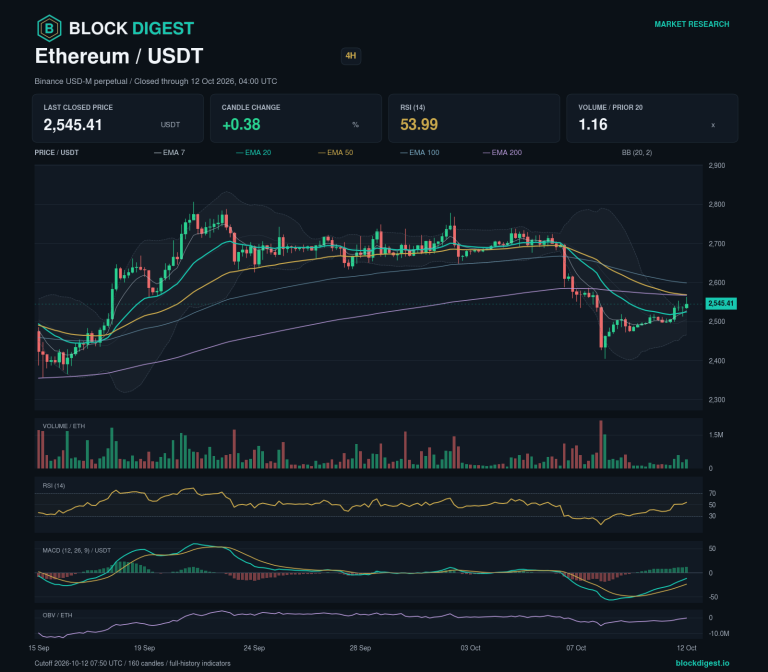
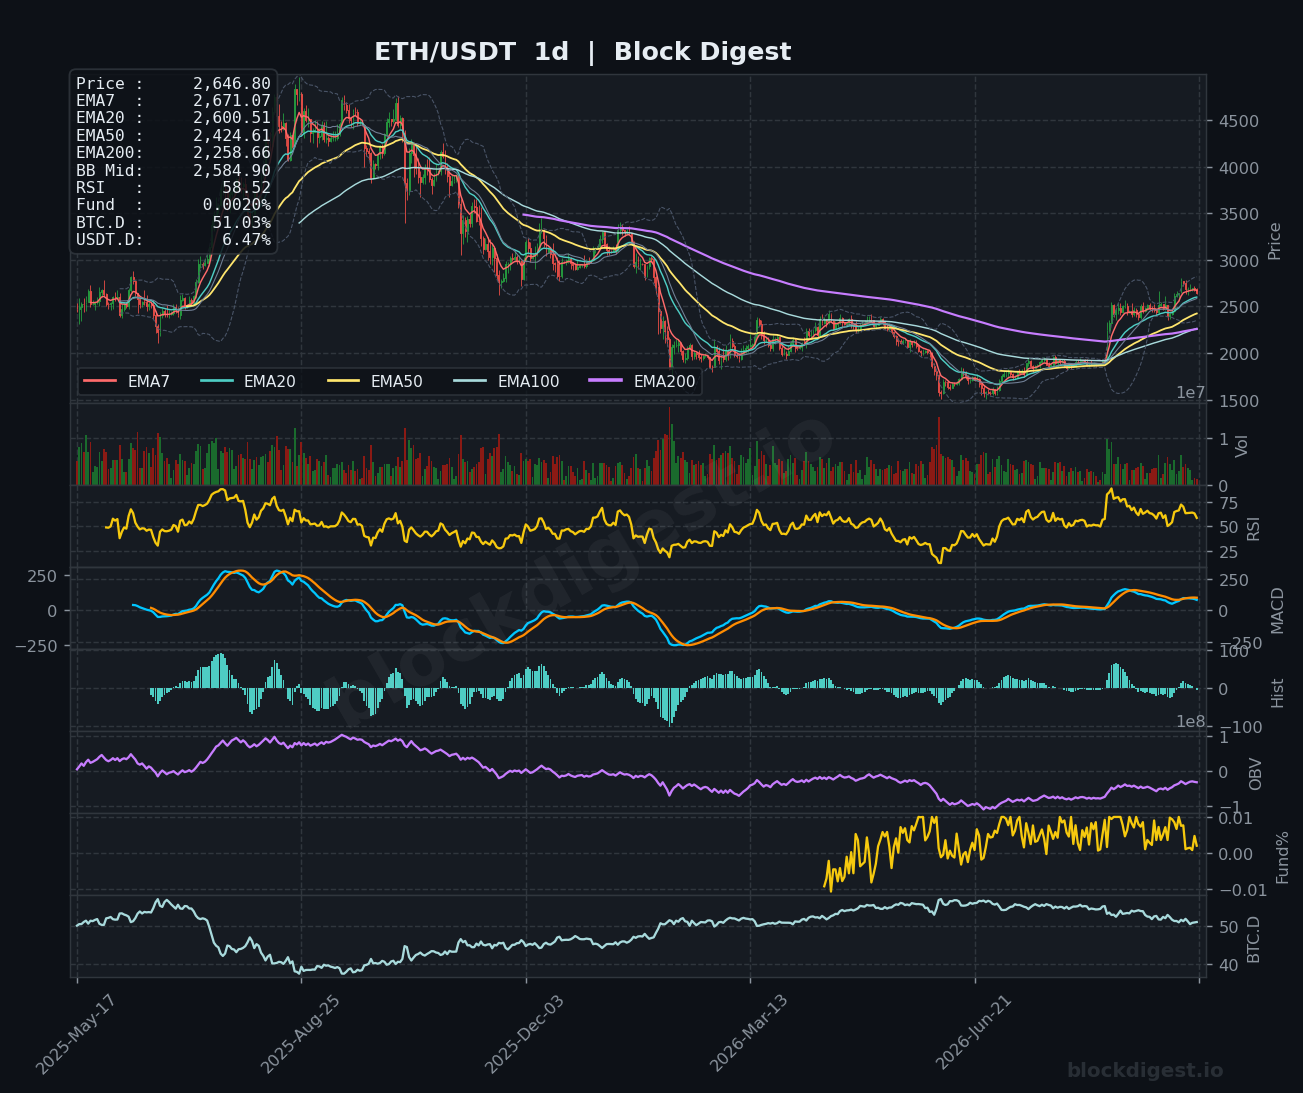
Weekly structure remains firmly bullish, while the daily timeframe is in a constructive consolidation phase above its 20 EMA. The 4-hour structure is experiencing a short-term intraweek pullback toward lower band support, but this looks like corrective digestion of recent gains rather than a structural breakdown. A dense demand cushion sits below spot, formed by the confluence of the daily 20 EMA, the 4-hour 100 EMA, and the weekly 100 EMA, keeping the broader bullish thesis intact as long as the 2600.00 level holds.
Key Weekly Levels
- Weekly Resistance: 2724.90 (4-hour upper Bollinger Band and immediate local swing supply cap); 2810.82 (Weekly upper Bollinger Band and primary macro range ceiling); 3000.00 (Psychological round-number barrier and major historical cycle resistance).
- Weekly Support: 2600.51 (Daily 20 EMA and psychological round-number support zone); 2561.30 (Weekly 100 EMA, acting as critical higher-timeframe baseline support); 2500.38 (Weekly 7 EMA aligned closely with the 4-hour 200 EMA).
Momentum & Volume Analysis
The weekly RSI at 61.96 indicates a bullish regime with room to run before reaching overbought territory, while the daily RSI at 58.52 holds above the centerline. Weekly MACD shows expanding bullish momentum, contrasting with the minor negative deceleration on the daily timeframe typical of range consolidation. The 4-hour RSI is approaching oversold levels, signaling potential short-term selling exhaustion. Funding rates remain neutral-to-low at 0.002%, suggesting an absence of speculative long leverage froth and leaving room for organic upside expansion.
Key Indicators Snapshot
| Indicator | Value | Context |
|---|---|---|
| ETH/USDT Spot Price | $2,646.86 | Current market price |
| Weekly 200 EMA | $2,517.82 | Key structural support |
| Weekly 100 EMA | $2,561.30 | Critical baseline support |
| Weekly 50 EMA | $2,411.63 | Higher timeframe support |
| Weekly 20 EMA | $2,283.06 | Long-term trend support |
| Weekly 7 EMA | $2,500.38 | Immediate trend support |
| Weekly RSI(14) | 61.96 | Bullish momentum regime |
| Daily RSI(14) | 58.52 | Moderately bullish stance |
BTC Dominance & Altcoin Implications
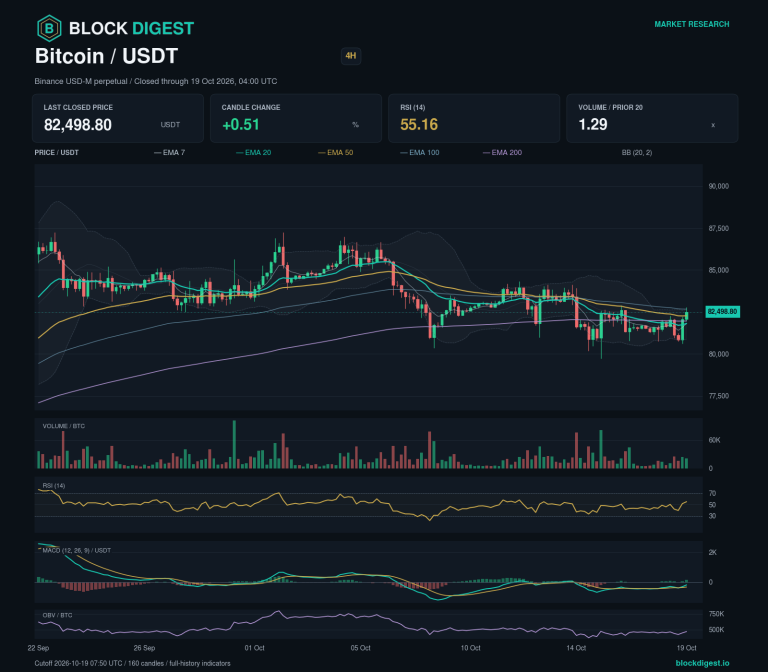
Bitcoin dominance is trending downward from prior swing highs, while USDT dominance stabilizes at low-to-moderate levels. This configuration suggests active capital rotation into Ethereum and major altcoins, increasing the likelihood that ETH outperforms BTC on upward extensions.
Risk Scenarios
- Bull case: Defense of the 2600.00–2600.51 support zone followed by a 4-hour close above the 4-hour 20 EMA (2680.81) is required to trigger a move toward 2724.90. A high-volume break of the 2810.82 weekly upper band would open targets at 2920.00 and 3000.00.
- Bear case: A sustained breakdown below the daily 20 EMA at 2600.51 on rising sell volume would signal a shift in momentum. Failure to hold the weekly 100 EMA (2561.30) and 7 EMA (2500.38) would likely expose downside targets at 2424.61 and 2283.06.
Weekly Outlook
The directional bias for the week ahead remains bullish consolidation, favoring dip-buying toward key support clusters as the macro trend expands. Higher-timeframe momentum is bolstered by a BD Extreme Index score of +1.25σ, suggesting the current pause is a healthy reset. Watch for weekly candle resolution relative to 2600.00, BTC dominance behavior around the 51% threshold, and any sudden expansion in perpetual funding rates. The setup remains focused on the 2600.51 and 2561.30 support levels as the primary defensive lines for potential upside triggers at 2724.90 and 2810.82.
Disclaimer: This analysis is for informational purposes only and does not constitute financial advice. Cryptocurrency markets are highly volatile and unpredictable. All trading decisions should be made based on your own research and risk tolerance. Block Digest is not responsible for any financial losses incurred as a result of acting on this content.
Stay Ahead of the Market
Follow BlockDigest for crypto market intelligence, research and real-time updates.