
Market Overview
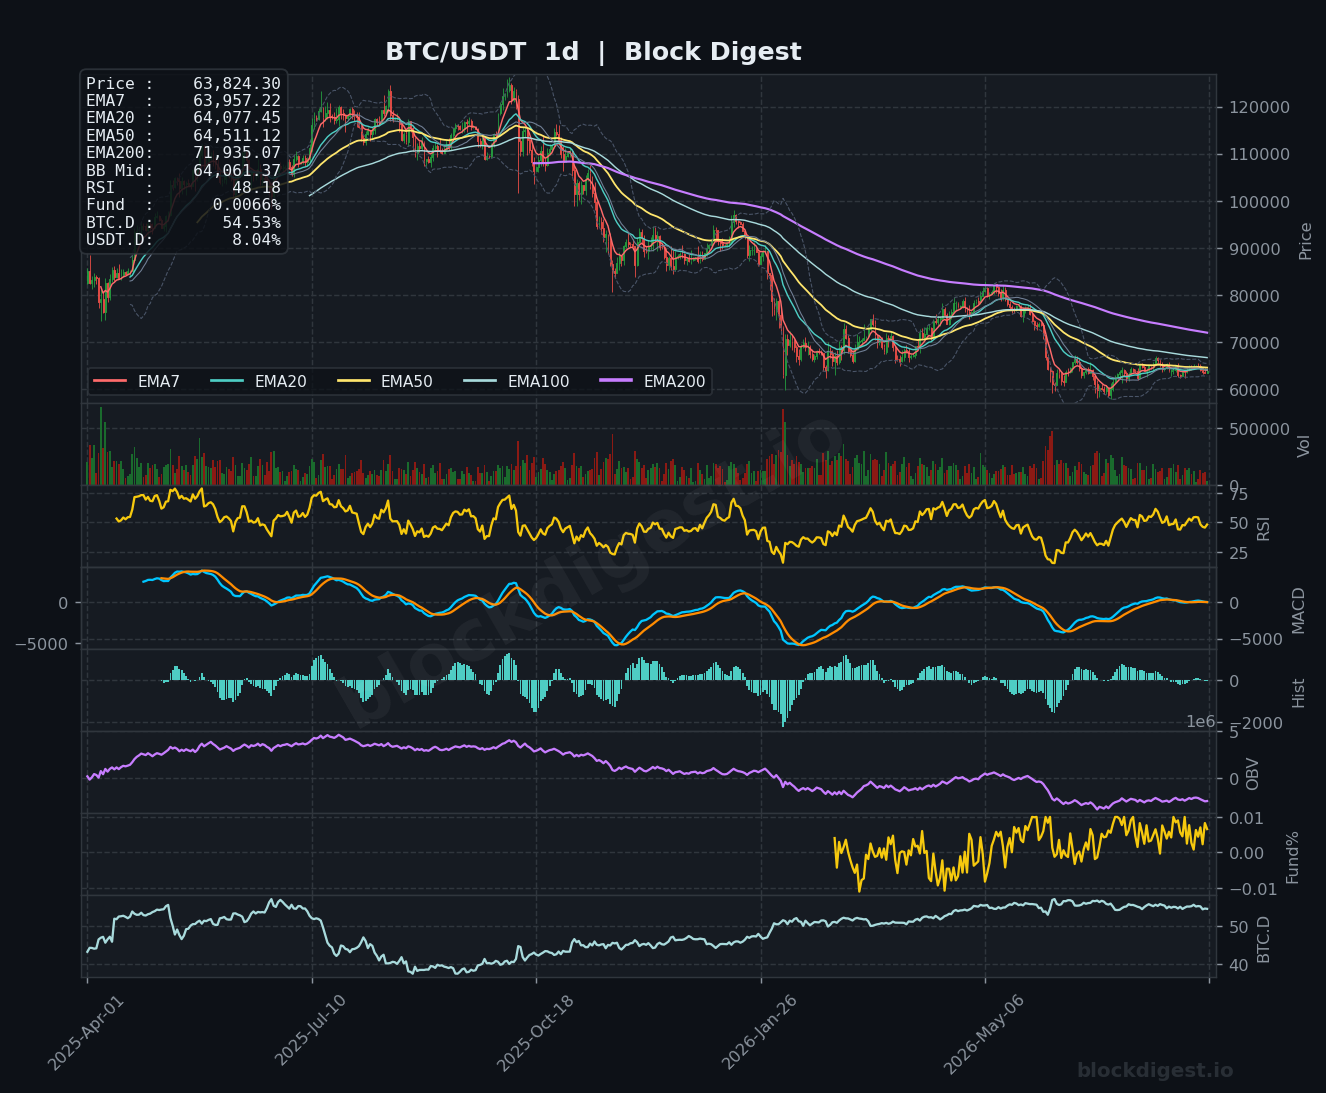
Bitcoin is trading at $63,824 as of August 13, 2026, caught in a structurally weak position on the daily timeframe after a prolonged downtrend from highs well above $100,000. Price is currently trading beneath all major daily EMAs — the EMA7 at $63,957, EMA20 at $64,077, EMA50 at $64,511, and the EMA200 sitting far overhead at $71,935 — painting a bearish EMA stack that has been in place for several months. The daily Bollinger Band midline sits at $64,061, and price remains unable to reclaim this level, suggesting the path of least resistance remains to the downside. The broader macro context is consolidatory at best, with BTC carving out a tight range between roughly $63,200 and $65,400 over the past week.
Multi-Timeframe Confluence
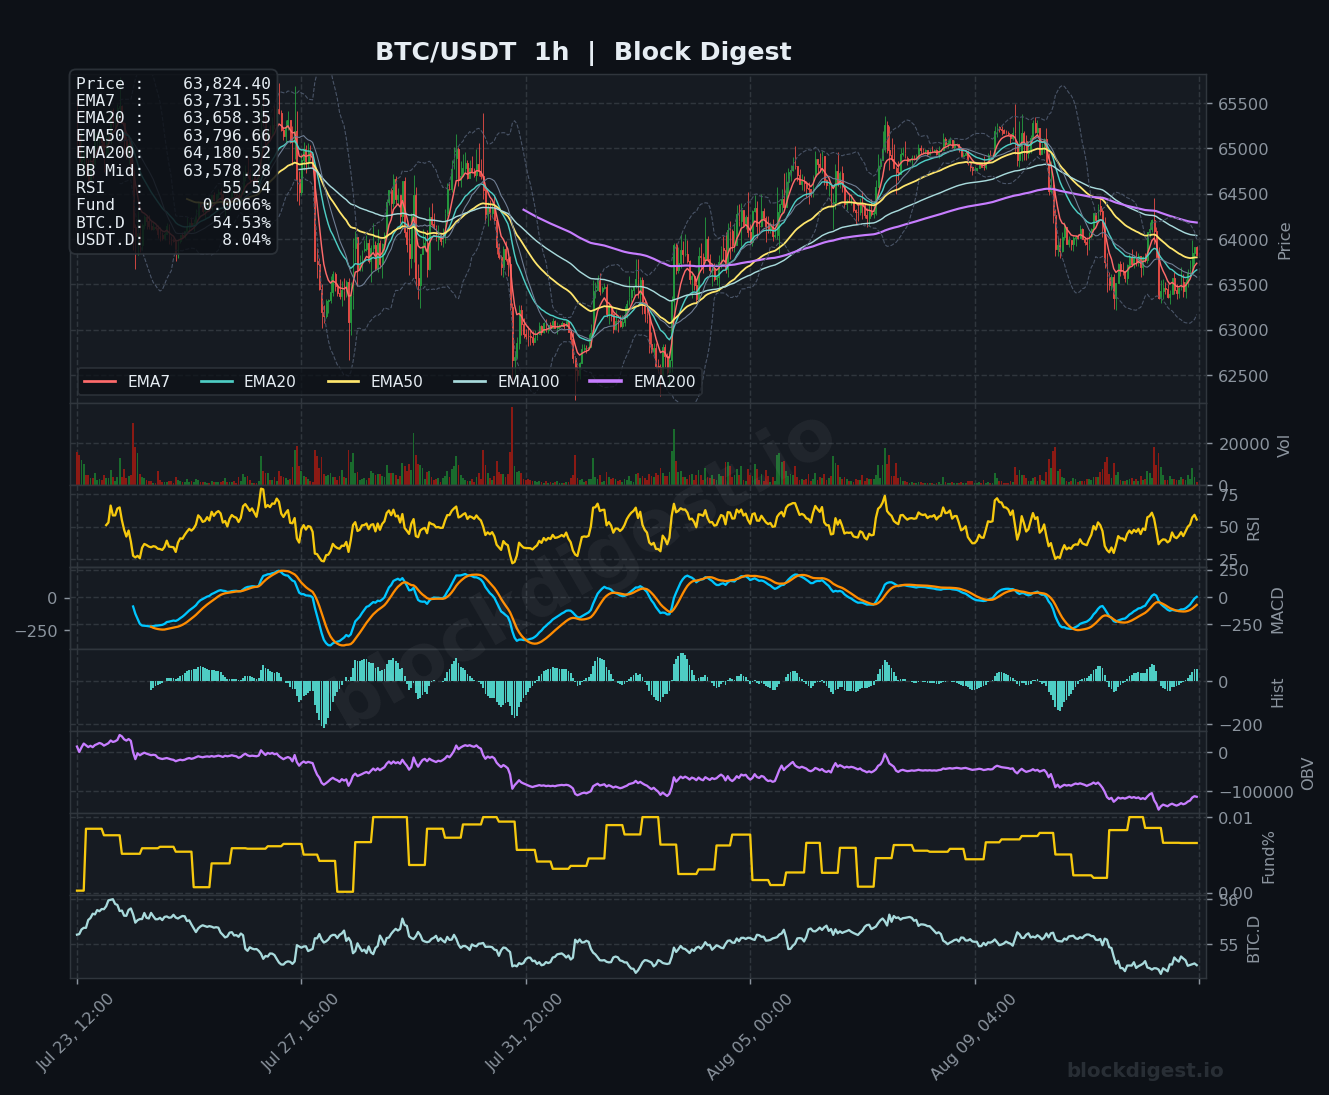
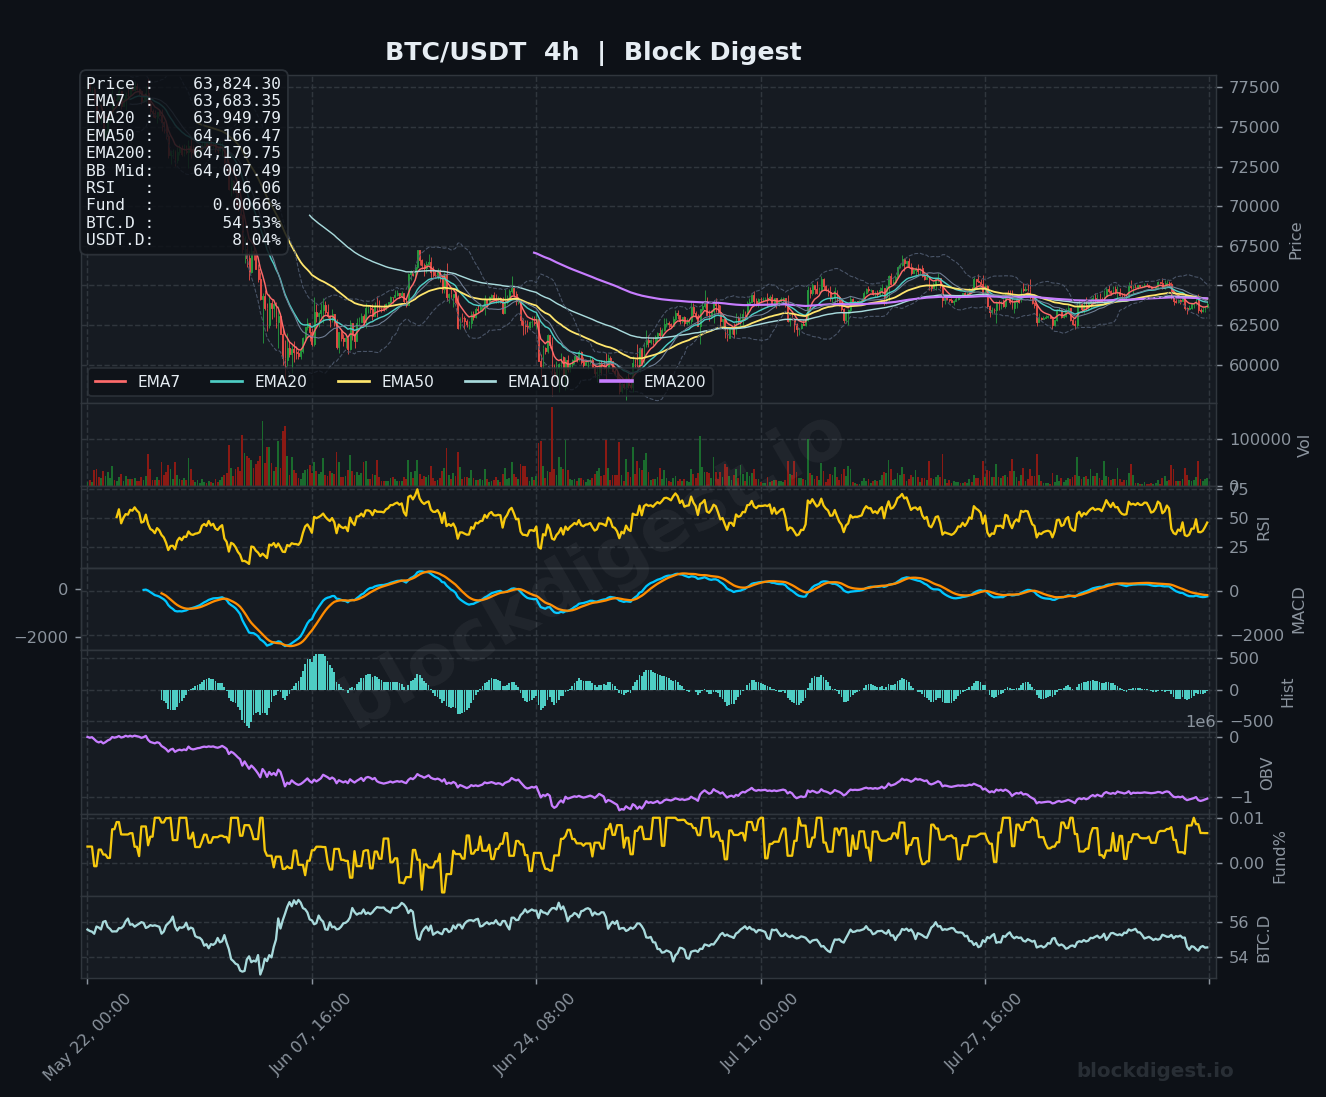
On the 1-hour chart, price is attempting a modest stabilization near $63,800, with short-term EMAs (EMA7 at $63,731 and EMA20 at $63,658) beginning to curl upward, though the critical EMA200 on this timeframe at $64,180 remains a near-term overhead obstacle. The 4-hour chart tells a more cautious story: price sits below both the EMA50 ($64,166) and EMA200 ($64,179), which have converged into a tight resistance cluster just above current levels, acting as a compression zone. The daily and 4-hour frames are aligned bearishly, while the 1-hour shows marginal stabilization — a divergence that typically resolves in favor of the higher timeframe trend. Confluent resistance between $64,100 and $64,200 across all three timeframes is the most immediately critical zone to monitor.
Key Levels to Watch
- Resistance: $64,100–$64,200 — tight cluster of 4h EMA50, 4h EMA200, and daily BB midline; the most consequential near-term ceiling
- Resistance: $64,511 — daily EMA50, representing the first meaningful bearish EMA barrier on the macro timeframe
- Resistance: $65,386 — the 7-day range high and recent swing top; a break here would constitute a meaningful structural shift
- Support: $63,578 — 1-hour Bollinger Band midline; an intraday reference and near-term floor
- Support: $63,199–$63,200 — 7-day range low; a decisive close below this level would increase bearish pressure significantly
- Support: $62,500–$62,800 — broader structural demand zone visible on the 4-hour chart, last tested during the early August flush
Momentum & On-Chain Signals
Our proprietary BD Pulse Score currently reads 32/100 — firmly in bearish territory — and this is corroborated by the daily RSI sitting at 48.18, hovering just below the neutral 50 line and failing to generate any sustained bullish momentum. The 4-hour RSI at 46.06 mirrors this weakness, while the 1-hour RSI at 55.54 is the lone bright spot, reflecting the short-term intraday bounce but insufficient to shift the broader narrative. The MACD on the daily is near zero but has yet to produce a convincing bullish crossover, and the OBV trend registering at -1 on the BD Pulse is a concerning signal — on-chain volume flow continues to favor distribution over accumulation across the measured period. The funding rate at +0.0072% is mild and positive, indicating modest long bias in perpetual markets without excessive leverage buildup — not a contrarian extreme.
BTC Dominance & Market Sentiment
BTC dominance is holding at 54.53%, a relatively elevated level that reflects continued capital consolidation into Bitcoin rather than rotation into altcoins — consistent with a risk-off or defensive posture across the broader crypto market. USDT.D at 8.04% remains elevated, suggesting a meaningful portion of market participants are sitting in stablecoins, which can be interpreted as either cautious accumulation waiting for confirmation or outright risk aversion. Until dominance begins to decline alongside price recovery, a broad altcoin-led risk-on rally appears unlikely.
Risk Scenarios
- Bullish case: A clean hourly close above $64,200 — reclaiming the 4h EMA50/EMA200 cluster — would open a path toward the $64,511 daily EMA50, with a further breakout above $65,386 potentially targeting the $67,000–$68,000 range. This scenario gains credibility if accompanied by a BTC dominance dip and OBV trend reversal.
- Bearish case: A decisive daily close below $63,200 — breaching the 7-day range low — would signal a breakdown from the current consolidation, with the next material support zone not appearing until $62,500–$62,800, and a broader flush potentially targeting $61,000 if selling pressure accelerates.
Outlook
The near-term bias leans cautiously bearish, with BTC trapped beneath a dense overhead EMA cluster and the BD Pulse Score at 32/100 offering little technical encouragement for bulls. The macro picture remains challenging — BTC is trading nearly 40% below its EMA200 on the daily — and July’s in-line CPI print has done little to shift Federal Reserve rate expectations in a way that would meaningfully catalyze a fresh crypto rally. The next 24–48 hours are pivotal: watch for a sustained reclaim of $64,200 as the primary bull trigger, or a breakdown below $63,200 as the bear confirmation signal. Until one of these levels is taken out with conviction, this market remains a range-bound, wait-and-see environment best navigated with reduced position sizing.
Disclaimer: This analysis is for informational purposes only and does not constitute financial advice. Cryptocurrency markets are highly volatile and unpredictable. All trading decisions should be made based on your own research and risk tolerance. Block Digest is not responsible for any financial losses incurred as a result of acting on this content.
Stay Ahead of the Market
Follow BlockDigest for crypto market intelligence, research and real-time updates.


